2241
A pilot study on the GABA+ level in midbrain of healthy volunteers using MEGA-PRESS techniqueYulu Song1, Tao Gong1, Fei Gao1, Richard A.E. Edden2, Weibo Chen3, and Guangbin Wang1
1Shandong Medical Imaging Research Institute, Jinan, China, 2The Johns Hopkins University School of Medicine, Baltimore, MD, United States, 3Philips Healthcare, Shanghai, China
Synopsis
Gamma-aminobutyric acid (GABA) in midbrain is insignificant to be measured. To determine the GABA+ level, we employed Mescher-Garwood point-resolved spectroscopy (MEGA-PRESS) by a small region of interest (ROI)(1.0 × 2.5 × 3.0 cm), which is a new technique that could precisely measure the level of the inhibitory neurotransmitter. The distribution is 2.47 ±0.66 (χ±SD),and it is prove that there was no correlation of GABA+ level with age in healthy volunteers.
Introduction
Gamma-aminobutyric acid (GABA) is a primary inhibitory neurotransmitter in brain,and it is insignificant to be measured by conventional proton magnetic resonance spectroscopy (1H-MRS)1. Mescher-Garwood point-resolved spectroscopy (MEGA-PRESS) can separate the peak of GABA at 3.0 ppm by using a new editing technique, and then measure the corresponding level. Because the signal is expected to contain contributions from both macromolecules (MM) and homocarnosine, in this study, the signal is labeled with GABA+ rather than GABA2、3. Although 1H-MRS has been used for several years to measure the level of GABA+ in the brain, it is still controversial whether the level of GABA+ in midbrain could be measured4. The midbrain is an important area for pathological changes in a number of neurodegenerative diseases, such as Parkinson's disease5、6. Due to the small size of midbrain, it is generally believed that MEGA-PRESS cannot be used for research purposes. The aim of this study was to determine the level of GABA+ in the midbrain of healthy volunteers by 1H-MRS technique, and explore the correlation between GABA+ and age.Methods
All magnetic resonance imaging (MRI) and MEGA-PRESS experiments were carried out using a 3T scanner (Achieva TX, Philips, Best, Netherlands) equipped with an eight-channel phased-array head coil. This study included 20 healthy volunteers who aged between 20 and 76 years. The region of interest (ROI) (1.0 × 2.5 × 3.0 cm) was selected for the measurement of midbrain GABA+ level. The GABA+ and FitError values of the patients were processed by Gannet, a GABA-MRS analysis tool that is based on MATLAB (MathWorks Inc., Natick, MA, USA), and then the Pearson’s correlation between GABA+ and age was analyzed.Results
The GABA+ level in the midbrain (fiterror < 15%) can be measured by using the MEGA-PRESS by a limited ROI (1.0 × 2.5 × 3.0 cm). The distribution is represented as 2.47 ±0.66(χ±SD).The results of Pearson’s correlation analysis showed that the GABA+ level in the midbrain had no significant relationship with age .Discussion
In this study, we found that the level of GABA+ in the midbrain could be measured by using a limited ROI (fiterror < 15%) with the aid of MEGA-PRESS technique, and also found that the concentration of GABA+ in the midbrain of healthy volunteers did not change with increase of age. In a previous study, the level of GABA+ in the frontal parietal lobe decreased with increase of age7. Similarly, the same results were found in the study of PD animal models8. The present study suggests that there is no significant correlation between GABA+ level and age in healthy volunteers, which is attributed to the small sample size, and probably the limited ROI.It is probably a good idea to relax the threshold of only including data with under 15% error.Conclusion
This study shows that MEGA-PRESS technique can be used to measure GABA+ level in the midbrain area by a limited ROI, and no significant correlation was observed between age and GABA+ level in healthy volunteers, however, a larger sample size is required to further confirm this conclusion.Acknowledgements
The authors thank those who participated in thetechnical preparation of this study, and they are especially grateful tothe healthy volunteers who volunteered for this study.References
1.Mccormick D A. GABA as an inhibitory neurotransmitter in human cerebral cortex.[J]. Journal of Neurophysiology, 1989, 62(5):1018.2.Gao F, Edden R A, Li M, et al. Edited magnetic resonance spectroscopy detects an age-related decline in brain GABA levels[J]. Neuroimage, 2013, 78(9):75-82.3.Elmaki E E A, Gong T, Nkonika D M, et al. Examining alterations in GABA concentrations in the basal ganglia of patients with Parkinson’s disease using MEGA-PRESS MRS[J]. Japanese Journal of Radiology, 2017:1-6.4.Mullins P G, Mcgonigle D J, O'Gorman R L, et al. Current practice in the use of MEGA-PRESS spectroscopy for the detection of GABA[J]. Neuroimage, 2014, 86(2):43-52.5.Cleve M, Gussew A, Wagner G, et al. Assessment of intra- and inter-regional interrelations between GABA+, Glx and BOLD during pain perception in the human brain - A combined 1H fMRS and fMRI study.[J]. Neuroscience, 2017, 365:125.6.Brix M K, Ersland L, Hugdahl K, et al. “Brain MR spectroscopy in autism spectrum disorder—the GABA excitatory/inhibitory imbalance theory revisited”[J]. Frontiers in Human Neuroscience, 2015, 9:365.7.Louis E D, Hernandez N, Dyke J P, et al. In Vivo Dentate Nucleus Gamma-aminobutyric Acid Concentration in Essential Tremor vs. Controls[J]. Cerebellum, 2017, 17(5):1-8.8.Grewal M, Dabas A, Saharan S, et al. GABA quantitation using MEGA‐PRESS: Regional and hemispheric differences[J]. Journal of Magnetic Resonance Imaging, 2016, 44(6):1619-1623.Figures
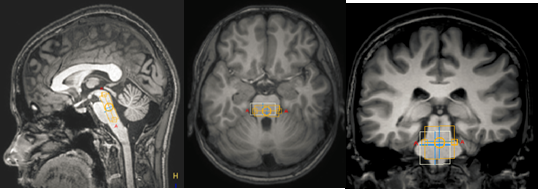
Fig. 1. The ROIs' position in the midbrain for spectroscopic measurement using MEGA-PRESS technique. The yellow box represents the location of the ROI (1.0 × 2.5 × 3.0 cm) in the sagittal, axial, and coronal images.
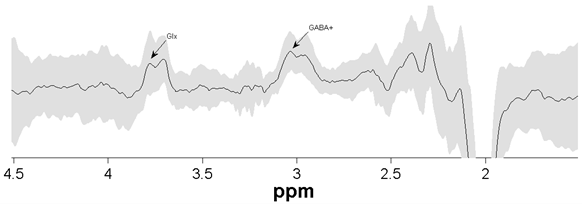
Fig. 2. The mean (± standard deviation) GABA-edited spectra obtained by the MEGA-PRESS technique in the midbrain.