2240
Quantification of Glutamate/Glutamine using LCModel for MEGA-PRESS sequence at 3 T1Psychological and Brain Sciences, Indiana University, Bloomington, IN, United States
Synopsis
We conducted a Monte-Carlo simulation to investigate the quantification of glutamate (Glu) and glutamine (Gln) using MEGA-PRESS and LCModel at 3 T. The results demonstrate that both glutamate and glutamine can be reliably quantified along with Gamma-aminobutyric acid if the spectrum linewidth is smaller than 0.06 ppm. However, our in vivo results showed a higher ratio of Glu/Gln, which is out of the physiological range measured by other methods. Our work suggests that glutamate and glutamine can be quantified at high accuracy in theory but the accuracy might be compromised in practice by other factors that affects the spectrum quality.
Introduction
Gamma-aminobutyric acid (GABA) can be reliably quantified using a GABA-edited MEGA-PRESS pulse sequence 1. In that pulse sequence, both glutamate (Glu) and glutamine (Gln) are co-edited and their corresponding peaks in the difference spectrum can be resolved at 3 Tesla. Henry et al. showed that at 4 T LCModel can reliably measure GABA and Glu but not Gln based on phantom data and simulation 2. Nezhad et al. argued that Glu and Gln can be reliably quantified using MEGA-PRESS with appropriate quality control of the spectrum (e.g. linewidth < 8 Hz) 3. In order to gain more insight in the Glu/Gln quantification with MEGA-PRESS, we simulated 3 T MEGA-PRESS spectra using Vespa (https://scion.duhs.duke.edu/vespa/project) and processed them with LCModel. The results were compared with those from in vivo data.Methods
1. Simulation
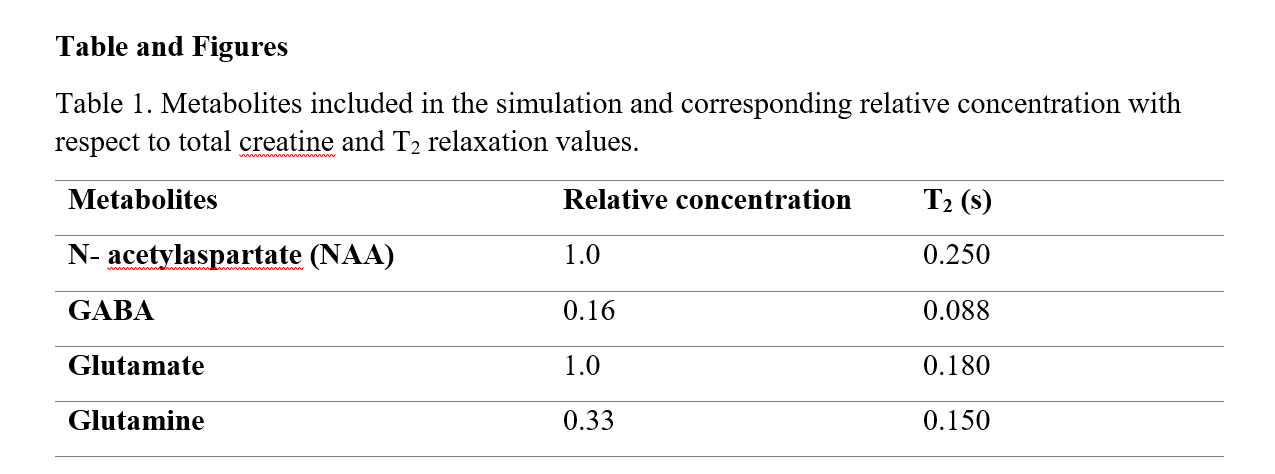
MEGA-PRESS spectra were synthesized using the Simulation module of Vespa. The spectra included metabolites of N- acetylaspartate (NAA), GABA, glutamate, and glutamine, with 2048 data points and a bandwidth of 1024 Hz. The concentration as a ratio to NAA was set to 0.2, 1, and 0.33 based on the physiological values from literature 4. The T2 relaxation values were chosen base on several references 4-6. Baseline signals from seven macromolecule were added to the difference spectra but with a scaling factor of 0.1. Eight different Tb (controlling T2* effect) values were used to achieve different linewidths. The noise level was fixed at which the SNR was around 90 for linewidth of 0.024 ppm. Table 1 lists the metabolites and the corresponding parameters in the simulation.
2. In vivo data
A total number of 43 subjects were scanned on a TIM Trio scanner with the following parameters: TR/TE = 1500/68 ms, bandwidth = 2000 Hz, 2048 data points, number of measurements = 256, editing pulse bandwidth = 44 Hz, scan time = 4 min. The voxel of interest was selected at the region of the dorsal anterior cingulate (voxel size 15 × 20 × 25 mm3). Manual shimming was performed to obtain good spectra. The full width at half maximum (FWHM) of shimming was below 16 Hz. A water reference scan was also acquired afterwards with 8 averages.
The synthesized spectra and in vivo data were exported to LCModel (version 6.3-1 J) and fittings were performed with the basis set with Kaiser Coupling Constants downloaded from Dr. Ulrike Dydak’s lab (http://purcell.healthsciences.purdue.edu/mrslab/basis_sets.html). The fitting range was 0.6 – 4 ppm without water scaling. For the in vivo data, Eddy current correction was performed.
Results
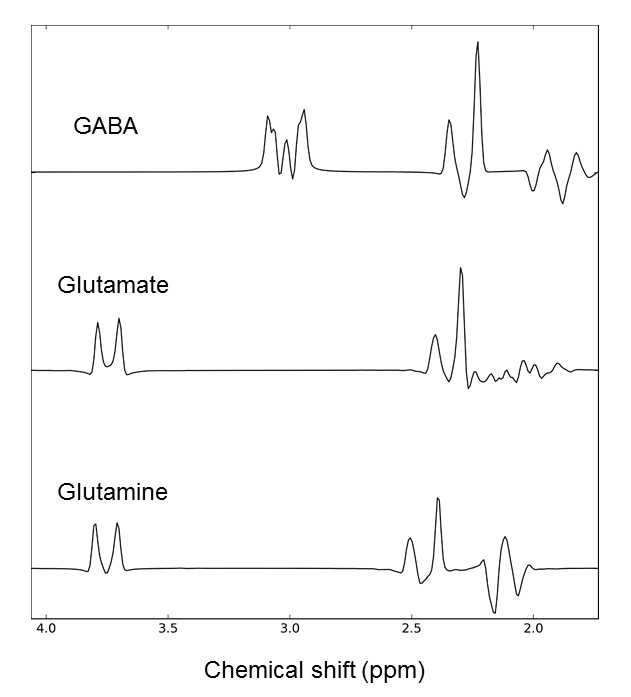
Fig. 1 compares the 3 T difference spectra of MEGA-PRESS for GABA, Glu, and Gln. The separation of Glu and Gln peaks is about 0.2 ppm.
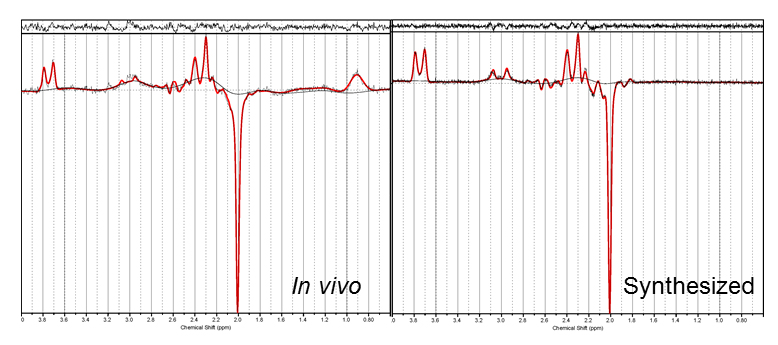
Fig. 2 compares the simulated spectrum and the in vivo spectrum. The two spectra are highly similar to each other except that the in vivo spectrum has a residual lipid peak around 0.9 ppm.
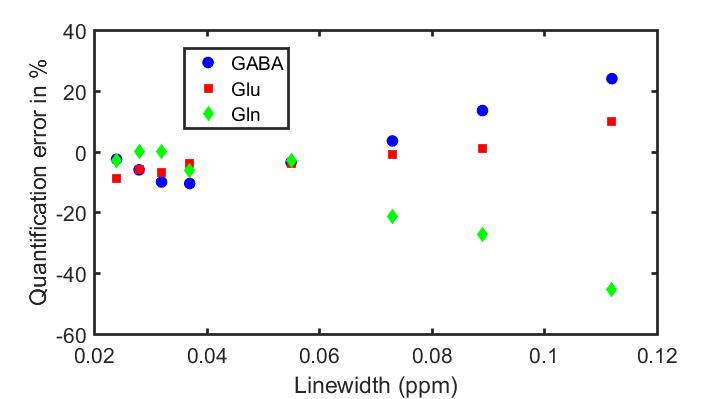
Fig. 3 shows the quantification error as a function of linewidth from synthesized spectra of GABA, glutamate, and glutamine. All the three metabolites are effectively measured when the linewidth is below 0.06 ppm. GABA tends to be overestimated and Gln tends to be underestimated at higher linewidth. In spite of that, glutamate can still be reliably quantified with an error < 10%.
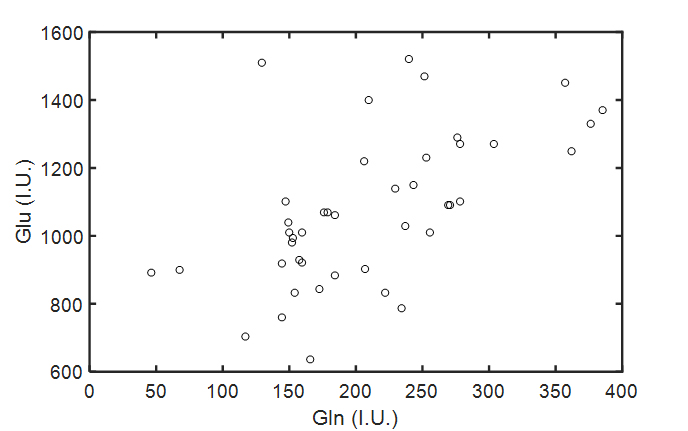
Fig. 4. Dispalys the scatter plot of Glu and Gln quantified by LCModel for the in vivo data. The correlation r = 0.58 and corresponding p value is 4.4e-5. The mean Glu/Gln ratio is 5.12.
Discussion
The simulation results demonstrate that glutamate and glutamine can be accurately measured along with GABA using the GABA-edited MEGA-PRESS sequence and LCModel if the linewidth of the spectrum is smaller than 0.06 ppm (or 7.68 Hz at 3 T). This observation agrees well with Nezhad’s recently work. One of their criteria for Glu/Gln quantification is NAA linewidth < 8 Hz. However, the Glu/Gln ratio from our in vivo results is out of the physiological range even excluding those with linewidth > 0.06 ppm. By examining the fitting in Fig. 3, it is likely that LCModel overfits the baseline, causing substantial underestimation of Gln (the peak at 2.4 ppm). We also noticed that the double peaks from GABA is not as prominent in the human data as in the synthesized data. That might be related to head motion or macromolecules contamination, making GABA quantification more challenging. Our work suggests that glutamate and glutamine can be quantified at high accuracy in theory but the accuracy might be compromised in practice by other factors that affects the spectrum quality.Acknowledgements
We thank Dr. Brian Soher for his technical support on Vespa. We also thank Dr. Ulrike Dydak for many insightful discussions and access to LCModel.References
1. Mescher M, Merkle M, Kirsch J, Garwood M, Gruetter R. Simultaneous in vivo spectral editing and water suppression, NMR Biomed. 1998;11:266–272.
2. Henry ME, Lauriat TL, Shanahan M, Renshaw PF, Jensen JE. Accuracy and stability of measuring GABA, glutamate, and glutamine by proton magnetic resonance spectroscopy: a phantom study at 4 Tesla. J Magn Reson, 2011;208:210.
3. Sanaei Nezhad F, Anton A, Michou E, Jung J, Parkes LM, Williams SR. Quantification of GABA, glutamate and glutamine in a single measurement at 3 T using GABA-edited MEGA-PRESS. NMR Biomed. 2018;31:e3847.
4. Zhang Y, Shen J. Simultaneous quantification of glutamate and glutamine by J-modulated spectroscopy at 3 Tesla. Magn Reson Med. 2016;76:725.
5. Scheidegger M, Hock A, Fuchs A, Henning A. T2 relaxation times of 18 brain metabolites determined in 83 healthy volunteers in vivo. Proc. ISMRM, 2014;p2947.
6. Zaaraoui W, Fleysher L, Fleysher R, Liu S, Soher BJ, Gonen O. Human brain-structure resolved T(2) relaxation times of proton metabolites at 3 Tesla. Magn Reson Med. 2017;57:983.
Figures