2239
Longitudinal relaxation times of macromolecules and their suppression in MEGA-PRESS 1H-MR-brain spectra at 3 T1Jena University Hospital - Friedrich Schiller University Jena, Jena, Germany, 2Michael Stifel Center for Data-driven and Simulation Science Jena, Jena, Germany, 3Abbe School of Photonics, Jena, Germany, 4Center of Medical Optics and Photonics, Jena, Germany
Synopsis
Taking advantage of the adiabatic inversion based macromolecule (MM) suppression approach, the MM contamination of the neurotransmitter GABA can be significantly reduced in MEGA-PRESS 1H-MR brain spectra. In this work, the longitudinal relaxation times (T1) of brain macromolecules were determined in posterior cortex of healthy subjects in order to adjust the inversion delays for MEGA-PRESS based measurements of pure GABA. Compared to main brain metabolites, T1 times of MMs are significantly shorter and further reveal a very low inter-individual variation, which allows us to use the MM nulling approach without substantial T1 weighing related attenuations of metabolite signals and further to apply fixed TI settings instead of performing individual T1 measurements in future studies.
Introduction
MEGA-PRESS 1H-MRS measurements of inhibitory neurotransmitter GABA allow investigations of neurochemical processes modulating neuronal activity in brain1. However, overlapping macromolecule (MM) contributions are a common problem of conventional in vivo MEGA-PRESS applications. In this work we further analyze a MM suppression approach, which relies on adiabatic inversion of the longitudinal magnetization2. By studying the subject specific inversion recovery behavior of MMs (and main brain metabolites) in the in posterior cortex we are aiming to determine the appropriate inversion times to achieve optimal MM suppression and apply them in sub-sequent MEGAPRESS measurements in healthy subjects.Materials and Methods
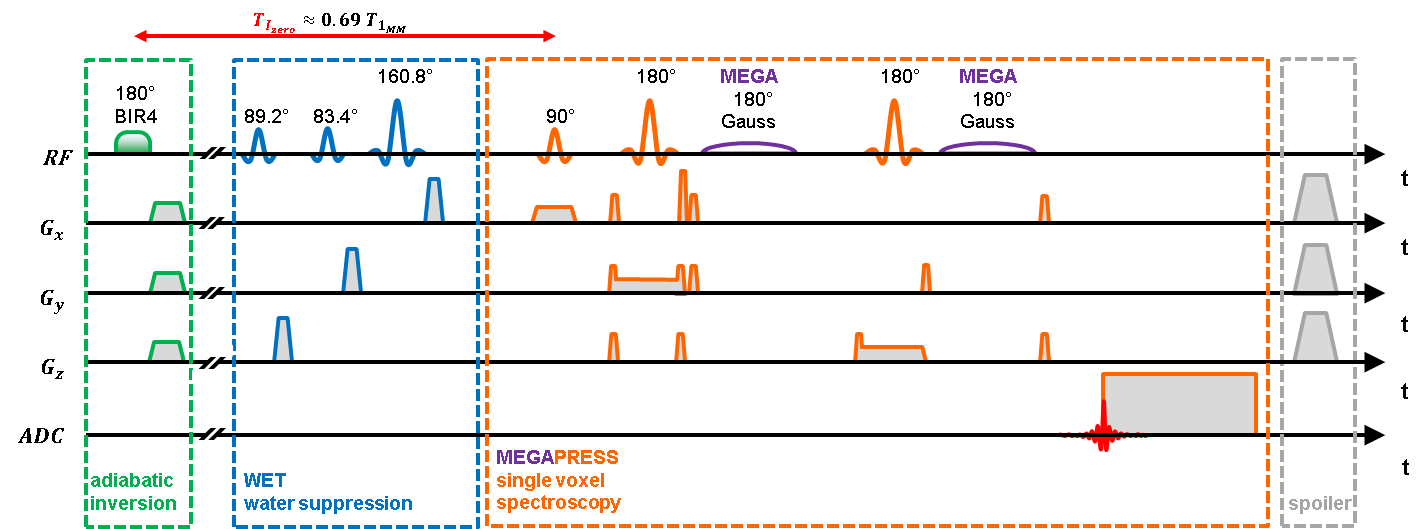
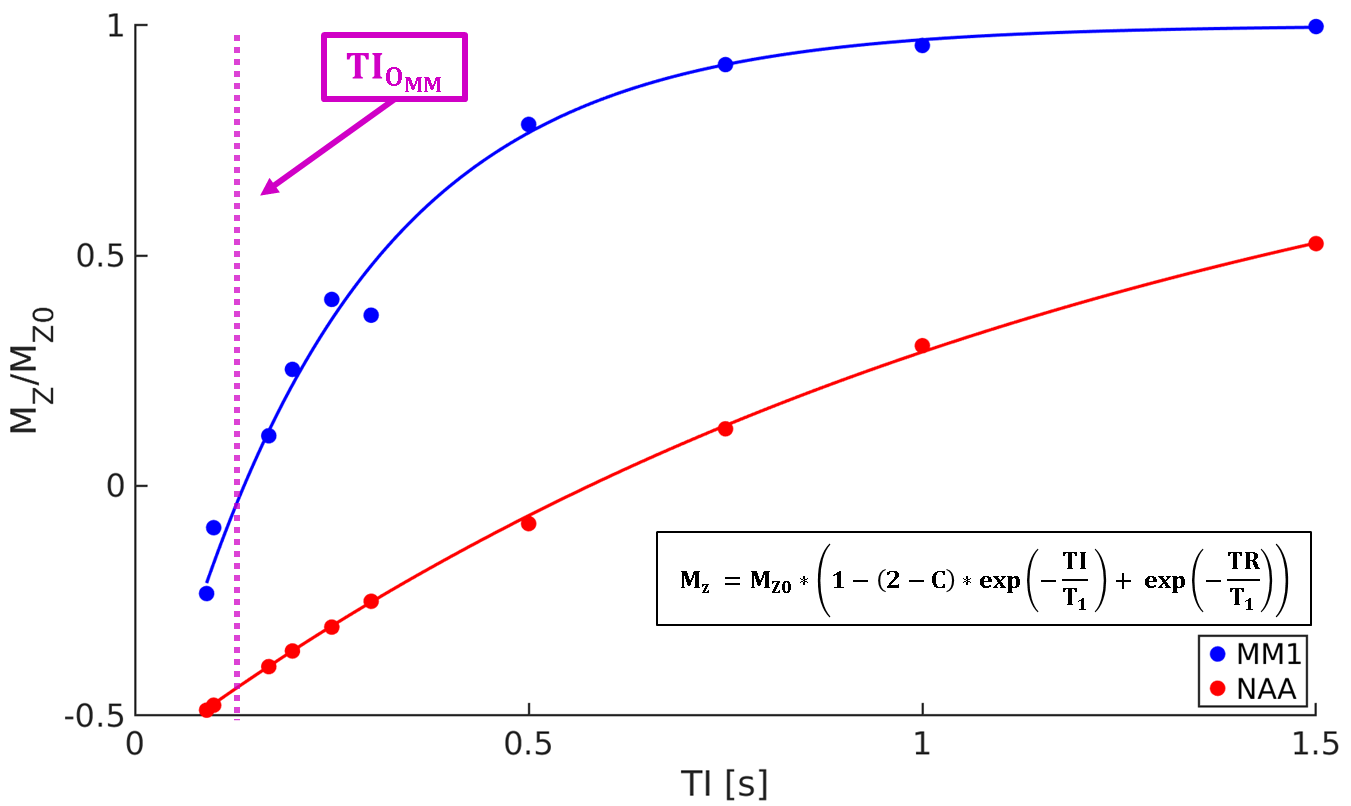
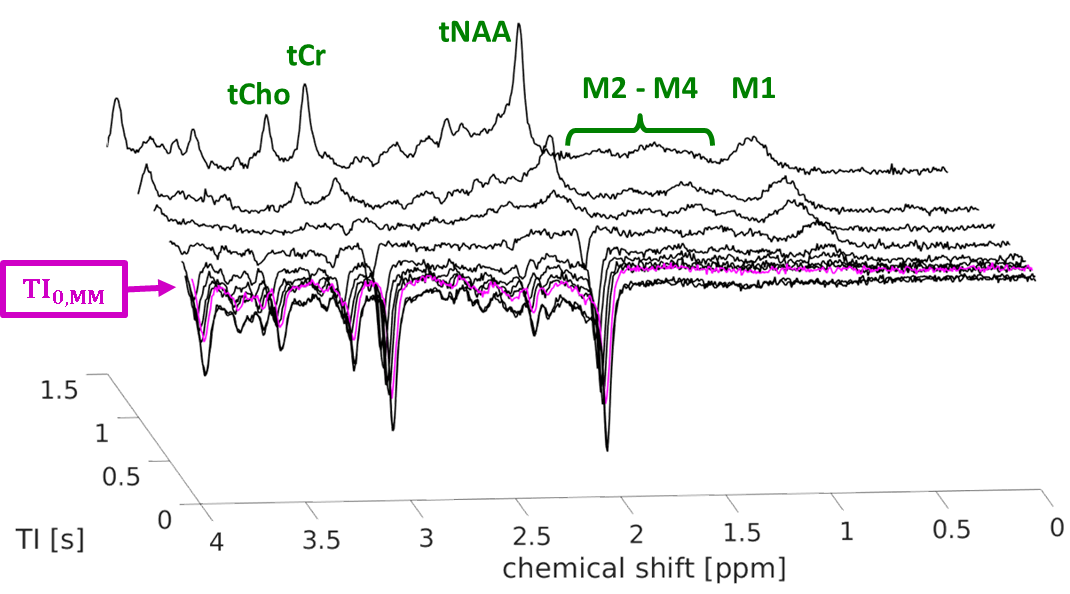
In vivo measurements were conducted in nine male subjects (22-42 yrs.) with a clinical whole-body 3 T MR scanner (Magnetom Prisma VE11B, Siemens Healthineers AG) and a vendor supplied 64-channel head-matrix coil. All spectroscopic scans were performed in posterior cortex (PC, 25 ml, see Fig. 1) with an in-house written sequence (s. Fig. 2) featuring the PRESS scheme based volume selection, MEGA editing option as well as non-localized, adiabatic magnetization inversion with freely adjustable inversion times (5120 ms BIR4 pulse). All spectra were quantified with jMRUI3 by using own prior-knowledge sets. In the first step, series of non-edited spectra were acquired with varying TI’s to track the inversion recoveries of main brain metabolites (NAA and tCr) as well as of the MM compound resonating at 0.9 ppm (TR/TE = 3280/30 ms, TI =91 to 1500 ms, s. Fig. 3). Subsequently, these intensity evolutions were fitted to determine the particular T1 time constants, which were used for the TI adjustment in the MM nulling approach (s. Fig. 3 and Fig. 4). In the second step, MEGA-PRESS scans were performed with (‘MMnulMEGA’) and without (‘ConvMEGA’) MM nulling to obtain the pure and MM contaminated GABA intensities, respectively (TR/TE = 3280/69 ms, alternating 17 ms Gaussian editing pulses at 1.9 and 7.5 ppm). For inter-individual comparisons the GABA intensities were normalized with corresponding total creatine intensities (GABA+/tCr, GABA/tCr).Results
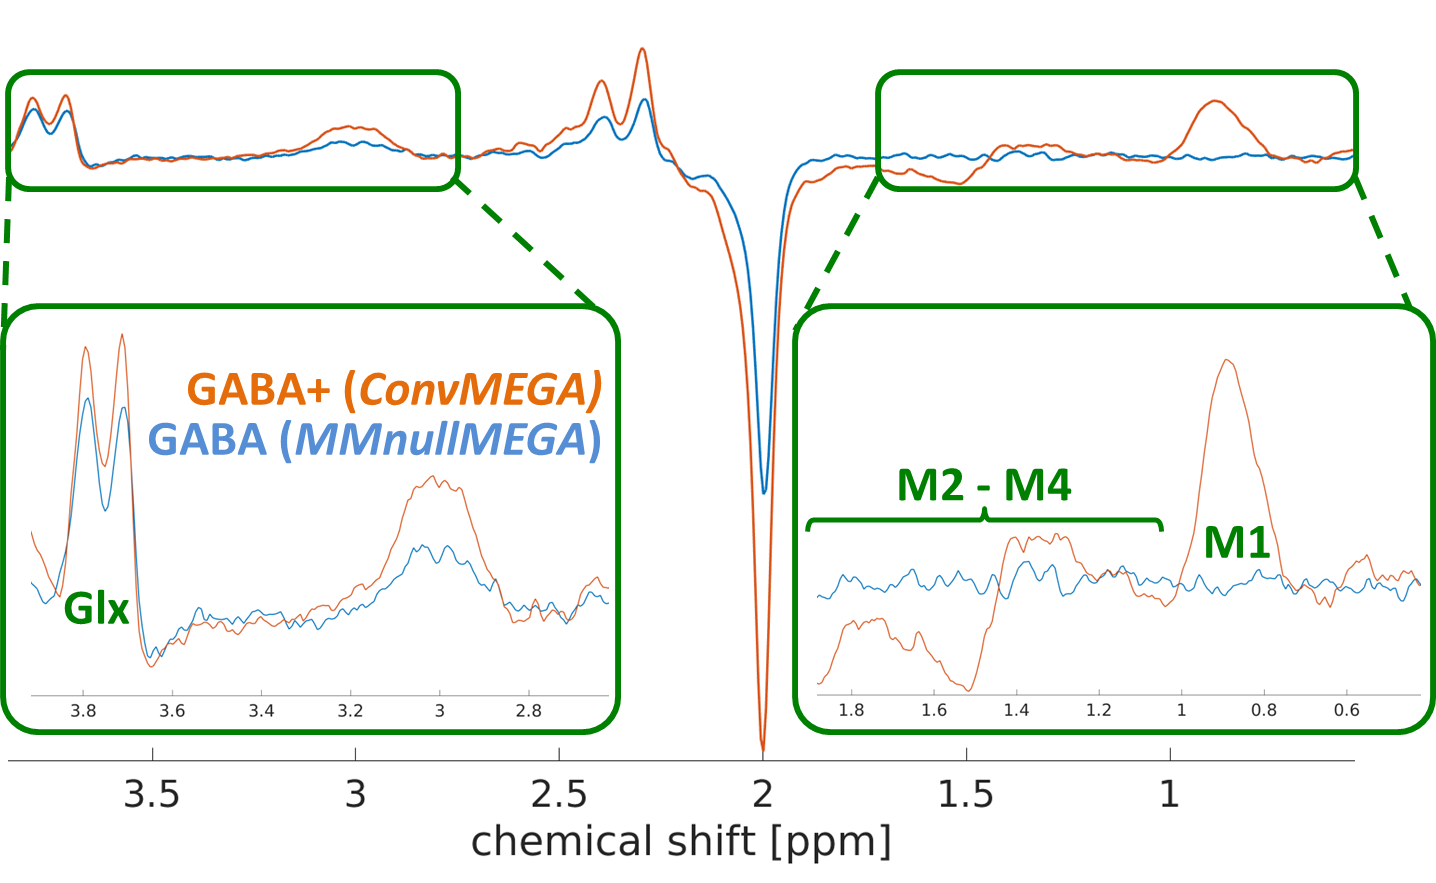
Averaged over all subjects, the mean T1 times of 1.3 ± 0.2 s and 1.3 ± 0.3 s were determined for NAA and tCr resonances, respectively. For the MM resonance at 9 ppm, the mean T1 time 0.27 ± 0.04 s was estimated, which corresponds to the mean MM nulling TI0, MM value of 0.143 ± 0.009 s. By selecting this TI value and by considering the estimated T1 times of NAA (or even tCr), an overall NAA intensity attenuation of approximately 43% can be assumed due to T1 weighting. Similar attenuation can be approximated for the intensity of GABA resonance at 3 ppm, which, as reported previously, reveals very similar T1 value as NAA4. Representative MEGA-PRESS difference spectra acquired with and without MM nulling are shown in Fig. 5 (blue graph: MMnullMEGA; red graph: ConvMEGA). Compared to ConvMEGA spectrum, the MMnullMEGA spectrum reveals an almost flat baseline in the MM range, which indicates for a robust MM suppression. On the other hand, the MMnullMEGA spectrum is also showing a distinct lower NAA intensity, which is associated with the progressing signal recovery at selected TI0,MM delay. Averaged over all subjects, the mean pure GABA/tCr ratios amounted 0.3 ± 0.01 and were approximately one third of MM contaminated GABA+/tCr ratios (0.9 ± 0.01).Discussion and Conclusion
In this work we studied the subject dependent inversion recovery behavior of the longitudinal magnetization of different metabolites and MM in the in posterior cortex. By fitting the acquired TI series we showed that the T1 values of MM (T1,MM = 0.27 ± 0.04 s) are approximately 5 times shorter than the other main brain metabolites of interest. This again allows us to use the adiabatic inversion based MM suppression method with moderate, T1 weighting related signal attenuation. The low inter-individual variation of T1,MM (15 %) also allows to suppose a use of a fixed TI0, MM value in further studies. However to obtain a more generalized conclusion, this measurements should be expanded to other brain areas and metabolites. Alternately this approach can be used to suppress metabolites in order to access pure MM spectra and determine der transversal relaxation properties.Acknowledgements
Andreas Masek is supported by a graduate scholarship from the Friedrich-Schiller-University Jena (Landesgraduiertenstipendium).
Alexander Gussew acknowledge funding from the German Research Foundation (DFG, GU 1108/3-1; RE 1123/22-1).
References
1Mullins PG et al.. Current practice in the use of MEGA-PRESS spectroscopy for the detection of GABA. NIMG 1. 2014, 86: 43-52.
2Gussew A, Masek A. et al.. Intrinsic inversion recovery-based macromolecular nulling in MEGA-PRESS 1H-MR brain spectra. In: Proc 26th Annual Meeting ISMRM, Paris, France, p. 1281.
3Stefan D et al.. Quantitation of magnetic resonance spectroscopy signals: the jMRUI software package. Meas. Sci. Technol. 2009, 20(10): 104035.
4Puts NA et al.. Measuring the longitudinal relaxation time of GABA in vivo at 3 Tesla. J Magn Reson Imaging. 2013, 37(4):999-100.
Figures