2237
LCModel comparison of MEGA-PRESS and HERMES for GABA (and GSH) editing at 3T1Canon Medical Research USA, Mayfield Village, OH, United States, 2Center for Biomedical Imaging, Clinical and Translational Science Institute, University at Buffalo, The State University of New York, Buffalo, NY, United States, 3Buffalo Neuroimaging Analysis Center, Department of Neurology, Jacobs School of Medicine and Biomedical Sciences at the University at Buffalo, The State University of New York, Buffalo, NY, United States, 4Russell H. Morgan Department of Radiology and Radiological Science, The Johns Hopkins University School of Medicine, Baltimore, MD, United States, 5F. M. Kirby Research Center for Functional Brain Imaging, Kennedy Krieger Institute, Baltimore, MD, United States
Synopsis
HERMES is a new Hadamard-based editing sequence that allows for the simultaneous acquisition of overlapping metabolite signals – most notably GABA and glutathione (GSH) at TE 80. As such, HERMES is an alternative to conventional GABA measurement using TE 68 MEGA-PRESS, providing GSH information “for free.” In this work, we showed in a series of matched-voxel spectra that %SD values from LCModel were on average only slightly larger for HERMES than for MEGA-PRESS, suggesting that only a small price is paid in terms of GABA sensitivity.
Introduction
GABA, gamma-aminobutyric acid, is the primary inhibitory neurotransmitter implicated in a variety of neurological and psychiatric disorders1. MEGA-PRESS2, a J-difference editing technique, is the most commonly used 3T pulse sequence for measuring GABA concentrations, typically at TE 68. More recently, the power of Hadamard-encoded editing has been employed in the HERMES sequence to simultaneously acquire information about two or more overlapping metabolite signals3,4. In particular, HERMES can be used to simultaneously measure both GABA and glutathione (GSH), the primary brain antioxidant, in the time it would take MEGA-PRESS to measure just one. But is there a price to pay in terms of lost GABA sensitivity? In this work, we quantified changes in GABA spectrum quality using the Cramer-Rao lower bounds provided with LCModel fitting (the %SD values)5.Methods
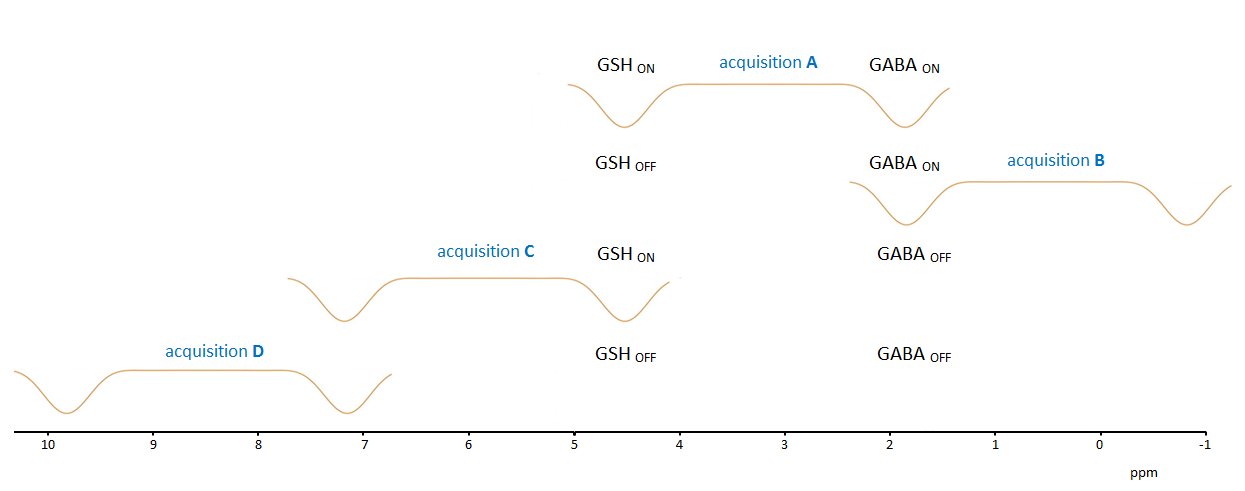
MEGA-PRESS and HERMES spectra were acquired sequentially at TE 68 ms and 80 ms, respectively, on a Canon Vantage TitanTM 3T scanner from matched voxel locations in a variety of GM-rich brain regions: posterior cingulate cortex (PCC); mid-cingulate cortex (MCC); anterior cingulate cortex (ACC); and thalamus (TH). For some spectra, new “universal” pulses were used for localization and editing,6,7 whereas for others (notably those from the thalamus), higher bandwidth vendor-supplied pulses were used to minimize chemical shift displacement. In all cases, however, editing pulse centers were spaced at TE/2. Other scan parameters for these sequences: 1024 data points; 500 μs dwell time; TR = 1800 or 2000 ms, number of excitations (NAQ) = 224-256 (cortex voxels) or 256-320 (thalamus). MEGA-PRESS editing frequencies were “water-symmetric” at 1.9 and 7.5 ppm. HERMES editing was achieved using a single dual-inversion-band pulse whose overall frequency was shifted for the four acquisition types A, B, C, and D (Fig. 1). Hadamard combinations yielded GABA-edited (A+B-C-D) and GSH-edited (A-B+C-D) spectra. For these editing frequencies, both sequences yield GABA+ (GABA plus co-edited macromolecular (MM) signal).
Individual shots were phase- and frequency-aligned using the residual water peak as a reference. (For HERMES, pairwise alignment of A shots with B and C shots with D was used to minimize the effect of editing applied at 4.56 ppm.) The special ‘mega-press-2’ (MP2) scheme in V6.3-1B of LCModel was used to fit the GABA-edited difference spectra, initially with the default analysis window (1.9-4.2 ppm) and then also with a narrower range (1.9-4.0 ppm). For the GSH-edited HERMES spectra, the same limited analysis window (1.9-4.0 ppm) was used with a stiffened baseline (DKNTMN = 0.3), no MM components, and a basis set that contained GSH, NAA, NAAG, and two choline components. (The latter only contributed small resonances at ~3.65 ppm in the difference spectrum.)
Because no correction was made for CSF content in the voxel, analysis focused on GABA+/tCr and GSH/tCr values, with total creatine (tCr) measured from edit-off spectra (D acquisitions for HERMES). Relaxation correction8,9 was applied using T1/T2 = 1310/88 ms for GABA, 1400/152 ms for tCr, and 397/120 ms for GSH.
Results
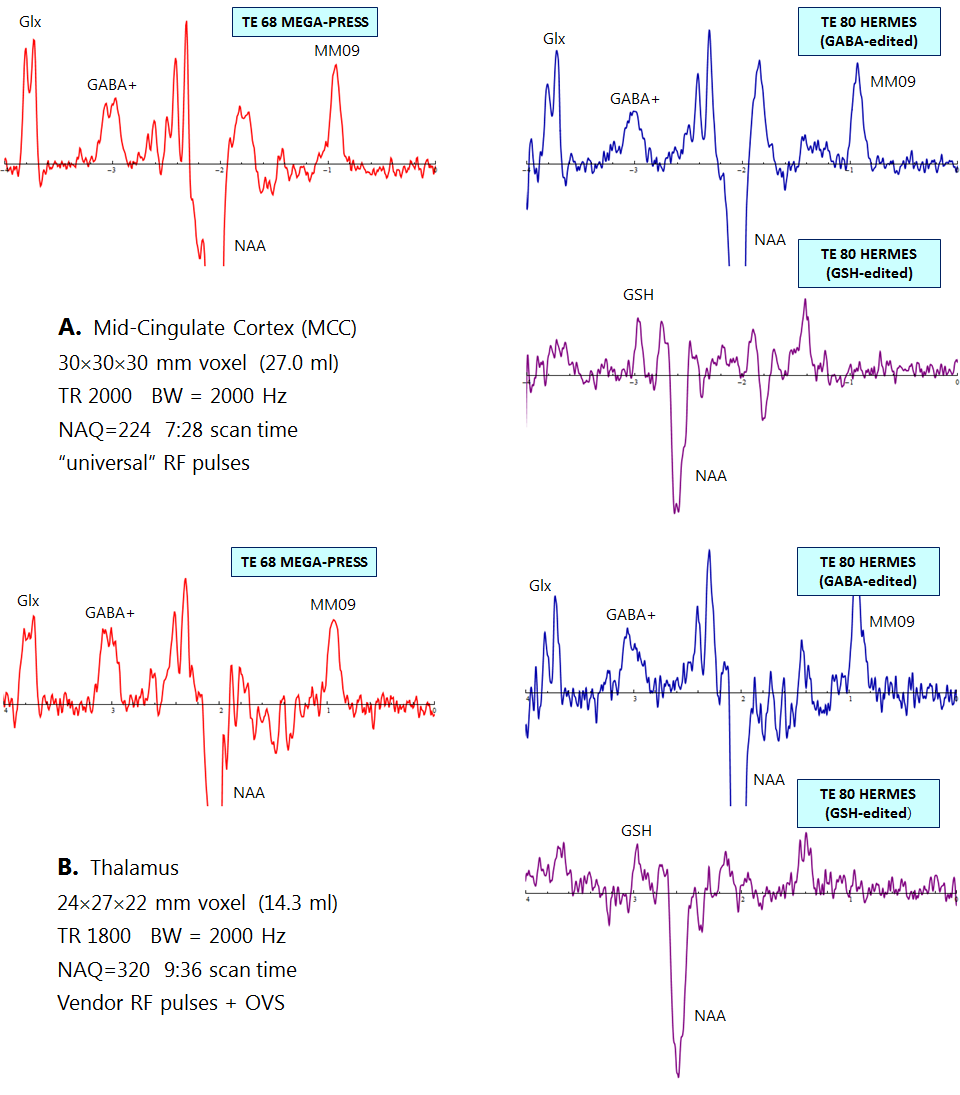
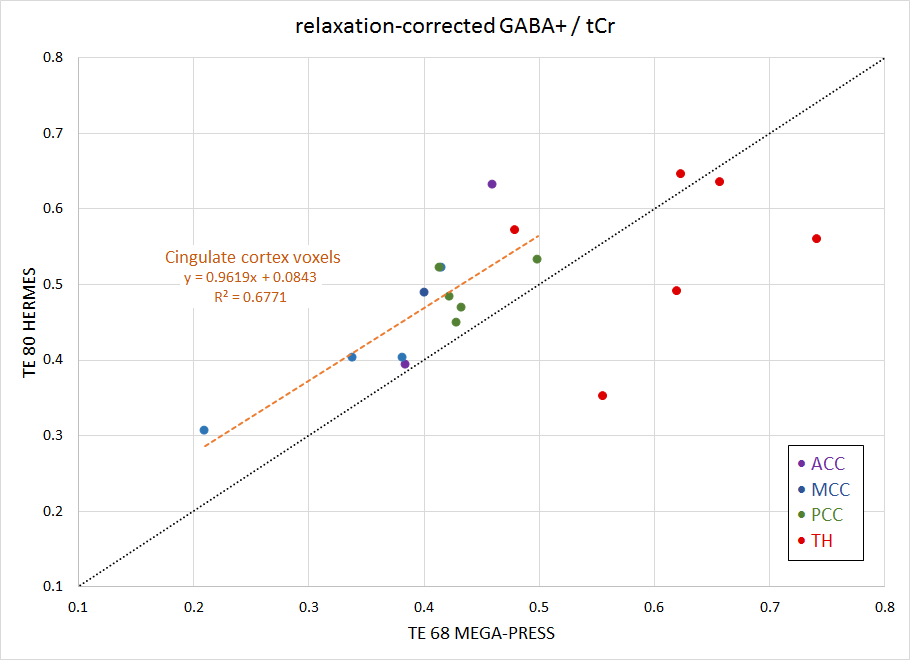
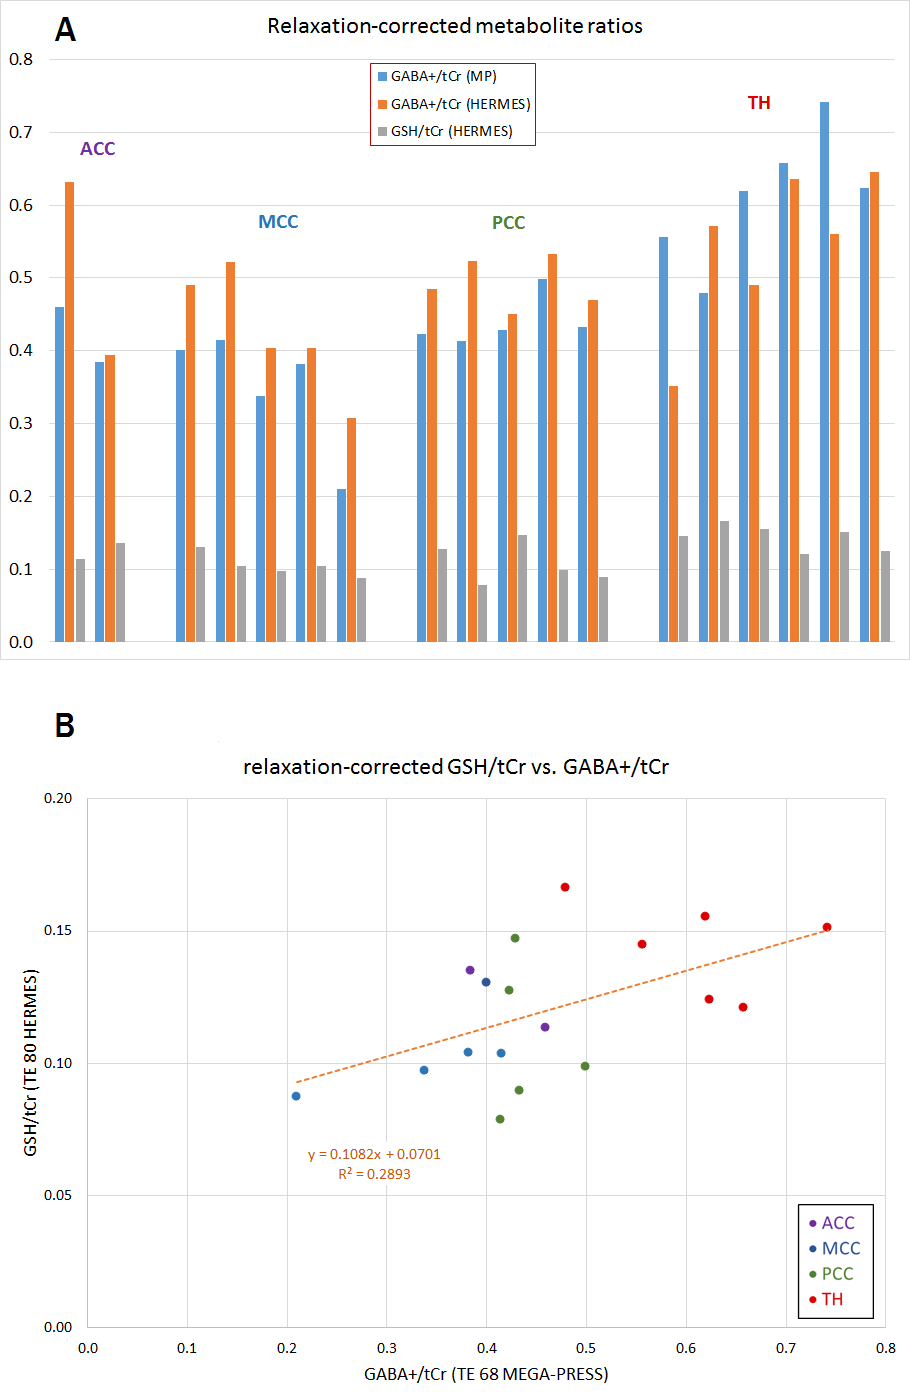
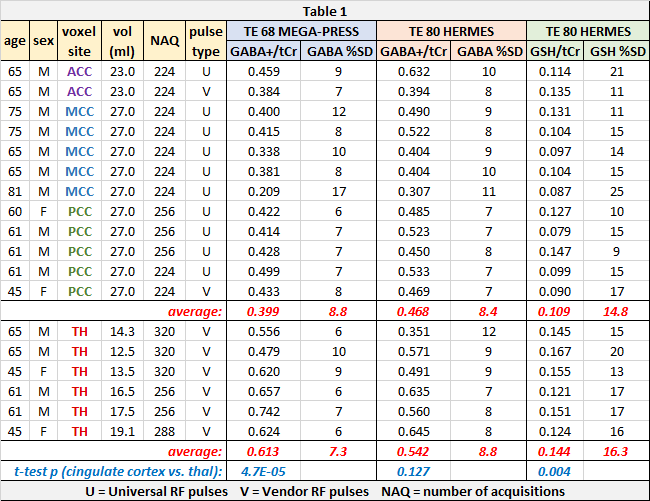
Representative spectra from MCC and thalamus voxels appear in Fig. 2. Relaxation-corrected LCModel results for GABA+/tCr and GSH/tCr appear in Table 1, plus averages and p values. GABA+/tCr values for HERMES vs. MEGA-PRESS are plotted in Fig. 3, along with a linear fit of data from the larger cingulate cortex voxels. Metabolite ratios from Table 1 are displayed graphically in Fig. 4, with a plot of the relationship between GSH/tCr and GABA+/tCr.Discussion and Conclusions
LCModel %SD values from MP2 fitting with default settings were noticeably larger for HERMES than for MEGA-PRESS. However, the HERMES spectra also contained more imperfectly canceled water signal from the editing at 4.56 ppm. Reducing the analysis range to 1.9-4.0 ppm brought the “believability” of the HERMES results much closer to MEGA-PRESS levels. Averaged values give a feel for the difference:
Default analysis range average GABA %SD values: 8.1 (MEGA-PRESS) vs. 11.5 (HERMES)
Reduced range values: 8.3 (MEGA-PRESS) vs. 8.6 (HERMES)
In other words, there is not a large price to be paid in terms of GABA sensitivity from using HERMES to acquire GSH data as well. However, LCModel parameters should be chosen with care, because remote, seemingly innocuous artifacts in the analysis window can boost reported %SD values.
Relaxation-corrected GABA+/tCr values for HERMES and MEGA-PRESS aligned well for the cingulate cortex voxels. Thalamus voxels were smaller and more difficult to shim (as reflected in the FWHM values reported by LCModel), so results were more scattered. Perhaps some GABA+ intensity was lost due to reduced S/N at TE 80. Nevertheless, GABA+/tCr (from MEGA-PRESS) and GSH/tCr values were significantly higher in the thalamus than in the cingulate cortex.
Acknowledgements
No acknowledgement found.References
1. Mullins PG, McGonigle DJ, O’Gorman RL, et al. Current practice in the use of MEGA-PRESS spectroscopy for the detection of GABA. NeuroImage. 2014;86:43–52.
2. Mescher M, Merkle H, Kirsch J, Garwood M, Gruetter R. Simultaneous in vivo spectral editing and water suppression. NMR Biomed. 1998;11(6):266‐272.
3. Chan KL, Puts NAJ, Schär M, Barker PB, Edden RAE. HERMES: Hadamard encoding and reconstruction of MEGA‐edited spectroscopy. Magn Reson Med. 2016;76(1):11‐19.
4. Saleh MG, Oeltzschner G, Chan KL, et al. Simultaneous edited MRS of GABA and glutathione. Neuroimage. 2016;142:576‐582.
5. Provencher SW. Estimation of metabolite concentrations from localized in vivo proton NMR spectra. Magn Reson Med. 1993;30:672-679.
6. Saleh MG, Rimbault D, Mark Mikkelsen M, et al. Multi-Vendor Standardized Sequence for Edited Magnetic Resonance Spectroscopy. NeuroImage (under revision).
7. Saleh MG, Rimbault D, Mark Mikkelsen M, et al. A Universal Edited MRS Sequence for 4 Vendors. Proceedings of the 27th Annual Meeting ISMRM, Montreal, Canada, 2019 (submitted).
8. Oeltzschner G, Chan KL, Saleh MG, Mikkelsen M, Puts NA, Edden RAE. Hadamard editing of glutathione and macromolecule‐suppressed GABA. NMR Biomed. 2018;31:e3844.
9. Mlynarik V, Gruber S, Moser E. Proton T1 and T2 relaxation times of human brain metabolites at 3 tesla. NMR Biomed. 2001;14:325-331.
Figures