2236
Macromolecule free measurement of GABA with MASE-sLASER and MEGA-sLASER sequences in the human brain at 7T1Erwin L. Hahn Institute for Magnetic Resonance Imaging, Essen, Germany, 2Donders Institute for Brain, Cognition and Behavior, Nijmegen, Netherlands
Synopsis
MEGA edited 3 ppm signal can be severely contaminated with macro-molecules. Using two distinct acquisition methods of MASE-sLASER and MEGA-sLASER both at TE = 68 ms at 7T, we show the feasibility of macromolecule free estimation of GABA with LCModel. The presence of GABA line at 2.28 ppm in the spectra acquired with both techniques plays a crucial role for this.
Introduction
The J editing1 or MEGA editing2 method for measuring GABA has the danger of coediting other J-coupled metabolites in the edited 3ppm signal. Any coupled metabolite with a resonance frequency close to 1.89ppm which is inverted by the editing pulse and has a coupling partner at 3ppm will contribute in the edited 3ppm signal. There are macro-molecules (MM) that satisfy this condition3,4 and hence MM signal is co-edited with GABA leading to the 3ppm edited signal often being termed GABA+. We recently demonstrated that with the MASE-sLASER sequence at TE=68 ms, it is possible to measure the GABA resonance at 2.28ppm well separated from the neighboring Glutamate resonance at 2.35ppm at 7T5. At the same TE, the MEGA editing method is frequently used as an efficient tool to measure the GABA resonance at 3ppm. In this study, we use these two MRS tools to explore the degree to which measured GABA concentrations obtained with these two distinct methods are similar.Methods
Sequence implementation: MASE-sLASER and MEGA-sLASER sequences were implemented as described previously5. Data acquisition: In total, 7 healthy subjects (2 female; age 29.7±5.8 years) participated in this study, with approval from the local ethics committee. In vivo scans were performed on a 7T system (Magnetom 7T, SIEMENS Healthcare GmbH, Germany) with a 32 channel Rx and single channel Tx head coil (Nova Medical, NY). An anatomical reference image was acquired using 3D MPRAGE6. B0 shimming was performed using FASTESTMAP7. Single voxel MRS data were collected from two voxels of size 20x20x20mm3 positioned in predominantly GM and predominantly WM regions in the occipital lobe (Figure1) of 7 healthy subjects using MASE-sLASER (TR=4500ms,TEs=68ms,NEX=64,scan time=5:06mins) and MEGA-sLASER (TR=4500ms,TE=68ms,NEX=64,scan time=5:06min). Data analysis: Data were analyzed using LCModel8,9 JMRUI10 and MATLAB (version 2016b,Natick,MA). For the MASE-sLASER data, the basis set for the LCModel analysis consisted of twenty-one simulated metabolites. For the MEGA-sLASER editing data, six edited metabolites were modelled: GABA, Glu, Gln, NAA, NAAG, and GSH were included in the basis set. Each edited spectral model was created by subtracting a simulated MEGA-off spectrum from a simulated MEGA-on spectrum.Results
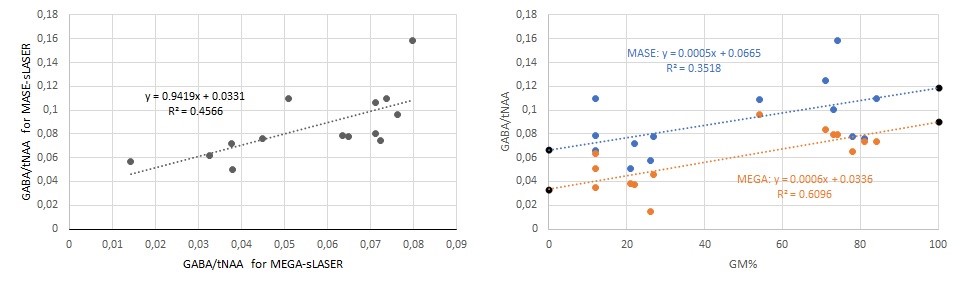
Figure1 shows examples of MEGA-sLASER and MASE-sLASER spectra acquired at TE=68 ms from predominantly GM and WM voxels of a healthy human brain (subject3) and the corresponding voxel positions. Figure2 (left) shows the correlation between GABA/tNAA of MEGA and GABA/tNAA of MASE acquisitions both estimated by LCModel. In Figure2 (right), we show the best fit and the corresponding R squared of the GABA/tNAA ratio relative to GM fraction for MASE-sLASER (blue) and MEGA-sLASER (orange) acquisitions separately.Discussion
Our estimation of 3ppm MEGA edited GABA with LCModel at 7T is MM free. There are two arguments supporting this assertion. First, in our MEGA edited spectra, in addition to GABA at 3ppm, GABA at 2.28ppm is also fully coedited. This is because the narrow bandwidth editing pulse (BW=133Hz) does not invert the 2.28ppm line. Therefore, the GABA line at 2.28ppm contributes in the MEGA edited spectra in the same fashion as 3ppm GABA line but with the important feature of lacking MM contamination. Compared with 2.28ppm line measured with MASE-sLASER, the 2.28ppm line here is not separated from the neighboring Glutamate. LCModel however will still incorporate it to estimate the GABA signal. Second, the linear correlation between the GABA/tNAA ratio measured with the MEGA-sLASER sequence and GABA/tNAA ratio measured with MASE-sLASER sequence which are both estimated by LCModel has the slope of about 1 (0.94) (Figure2, left). This shows a very strong correlation between the two distinct methods to measure GABA when LCModel is used. The GABA ratio in pure GM relative to in pure WM that is derived from intercepts of the best fits of MASE-sLASER and MEGA-sLASER (Figure2, right) represent somewhat different values (1.78 for MASE-sLASER and 2.69 for MEGA-sLASER). However, both values lie well in the range of what has previously been reported in the literature11-15. The ratio of 1.78 derived from MASE-sLASER technique in this study matches with reports by Mikkelsen et al11 Geramita et al12, and Zhu et al13. The ratio of 2.69 derived with the MEGA-sLASER technique in this study matches with reports by Choi et al14 and Jensen et al15. Conclusion: Using LCModel analysis we validated two fundamentally distinct GABA measurement techniques namely MASE-sLASER and MEGA-sLASER at TE=68ms against each other. The presence of the 2.28ppm line in the spectra acquired with both techniques is shown to be crucial for estimating MM free GABA with LCModel.Acknowledgements
This work was funded by the Helmholtz Alliance ICEMED – Imaging and Curing Environmental Metabolic Diseases, through the Initiative and Networking Fund of the Helmholtz Association.References
1. Rothman DL, Petroff OA, Behar KL, Mattson RH. Localized 1H NMR measurements of gamma-aminobutyric acid in human brain in vivo. Proc Natl Acad Sci U S A. 1993;90(12):5662-6
2. Mescher M, Merkle H, Kirsch J, Garwood M, Gruetter R. Simultaneous in vivo spectral editing and water suppression. NMR Biomed. 1998;11(6):266-72.
3. Behar KL, Ogino T. Characterization of macromolecule resonances in the 1H NMR spectrum of rat brain. Magn Reson Med. 1993;30(1):38-44.
4. Behar KL, Rothman DL, Spencer DD, Petroff OA. Analysis of macromolecule resonances in 1H NMR spectra of human brain. Magn Reson Med. 1994;32(3):294-302.
5. Rohani Rankouhi S, Hong D, Dyvorne H, Balchandani P, Norris DG. MASE-sLASER, a short-TE, matched chemical shift displacement error sequence for single-voxel spectroscopy at ultrahigh field. NMR Biomed. 2018:e3940.
6. Mugler JP, 3rd, Brookeman JR. Three-dimensional magnetization-prepared rapid gradient-echo imaging (3D MP RAGE). Magn Reson Med. 1990;15(1):152-7.
7. Gruetter R, Tkac I. Field mapping without reference scan using asymmetric echo-planar techniques. Magn Reson Med. 2000;43(2):319-23.
8. Provencher SW. Estimation of metabolite concentrations from localized in vivo proton NMR spectra. Magn Reson Med. 1993;30(6):672-679.
9. Provencher SW. Automatic quantitation of localized in vivo 1H spectra with LCModel. NMR Biomed. 2001;14(4):260-264.
10. Naressi A, Couturier C, Devos JM, Janssen M, Mangeat C, de Beer R, et al. Java-based graphical user interface for the MRUI quantitation package. Magn Reson Mater Phy. 2001;12(2-3):141-52.
11. Mikkelsen M, Singh KD, Brealy JA, Linden DE, Evans CJ. Quantification of gamma-aminobutyric acid (GABA) in (1) H MRS volumes composed heterogeneously of grey and white matter. NMR Biomed. 2016;29(11):1644-1655.
12. Geramita M, van der Veen JW, Barnett AS, et al. Reproducibility of prefrontal gamma-aminobutyric acid measurements with J-edited spectroscopy. NMR Biomed. 2011;24(9):1089-1098.
13. Zhu H, Edden RA, Ouwerkerk R, Barker PB. High resolution spectroscopic imaging of GABA at 3 Tesla. Magn Reson Med. 2011;65(3):603-609.
14. Choi IY, Lee SP, Merkle H, Shen J. In vivo detection of gray and white matter differences in GABA concentration in the human brain. Neuroimage. 2006;33(1):85-93.
15. Jensen JE, Frederick Bde B, Renshaw PF. Grey and white matter GABA level differences in the human brain using two-dimensional, J-resolved spectroscopic imaging. NMR Biomed. 2005;18(8):570-576.
Figures