2235
Simultaneous modelling of Hadamard encoded spectra for GABA and GSH using LCModel1Neuroimaging, King's College London, London, United Kingdom, 2Russell H. Morgan Department of Radiology and Radiological Science, The Johns Hopkins University School of Medicine, Baltimore, MD, United States, 3F. M. Kirby Research Center for Functional Brain Imaging, Kennedy Krieger Institute, Baltimore, MD, United States, 4Radiology and Radiological Science, The Johns Hopkins University School of Medicine, Baltimore, MD, United States
Synopsis
Low-concentration metabolites like γ-aminobutyric acid (GABA) and glutathione (GSH) can be measured at 3T using spectral-editing magnetic resonance spectroscopy methods like MEGAPRESS, HERMES or HERCULES. We propose a novel analysis approach based on
Introduction
Reliable detection of low-concentration neurochemicals with magnetic resonance spectra is challenging at 3 T due to strong overlap. J-difference editing helps separate the resonances of γ-aminobutyric acid (GABA) and glutathione (GSH) from overlaying signals with spectral-editing methods like MEGAPRESS1, HERMES2 or HERCULES3.
MRS data analysis software packages, like LCModel5, Gannet6, Tarquin7 or jMRUI8, currently perform single-spectrum analysis only. Here, we explored whether simultaneous modelling and fitting of HERMES difference and sum spectra in LCModel yielded improvement of metabolite quantitation compared to traditional single-spectrum modelling and independent fitting of the individual difference and sum spectra.
Methods
MR data were acquired on a 3T MR750 General Electric scanner (Chicago, IL, USA), using the body coil for transmission and a 32-channel head coil for receive. Eight healthy participants (mean age=32.5±9.3 years) were recruited, ethical approval and informed consent were obtained. Data were acquired using HERMES: TR = 2s; TE = 80ms; 5kHz receiver bandwidth; 4096 data points; 320 averages; phase cycle length of two; 90° excitation pulses; 137° refocusing pulses and 20ms sinc-Gaussian editing pulses at 1.9 ppm and 4.56 ppm; CHESS water suppression; voxel size = 2.5×4.0×3.0 cm3 (RL×AP×SI) in the dorso-medial prefrontal cortex.
Pre-processing with FID-A4 included receiver-coil combination, removal of motion corrupted averages, and frequency and phase correction with spectral registration9. The four averaged HERMES sub-spectra (A, B, C, and D - figure 1) were Hadamard-transformed to yield the GABA-edited (GABAdiff = A + B – C – D) and GSH-edited (GSHdiff = A – B + C - D) difference spectra and the sum spectra. All three resulting spectra were concatenated with 1.2 ppm gaps and saved in LCModel RAW format. HERMES metabolite basis functions were created for 19 spin systems using full-density matrix simulations in FID-A for 2013 spatial positions using shaped RF pulse waveforms.
Analysis was performed in LCModel for a) each individual difference spectrum (GABAdiff, GSHdif), b) the sum spectrum and c) the concatenated spectrum. LCModel control files were modified to prevent LCModel from applying phase corrections or soft constraints on GABA estimates. Metabolite levels relative to tCr (=Cr+PCr) and NAA+NAAG were estimated for all spectra (GABAdiff, GSHdiff, sum and concatenated). Since the HERMES difference spectra do not contain Cr signals, tCr from the sum spectra served as reference signal for them.
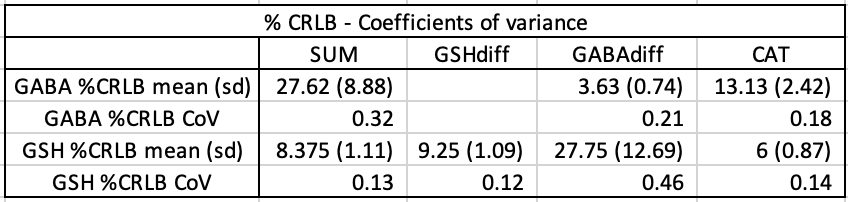
Fit quality was assessed by evaluating Cramer-Rao lower bounds (CRLB). Coefficients of Variance (CV) were calculated for each metabolite and fitting approach across all subjects. Test-retest CVs could be calculated for five subjects who underwent repeated acquisitions.
Results
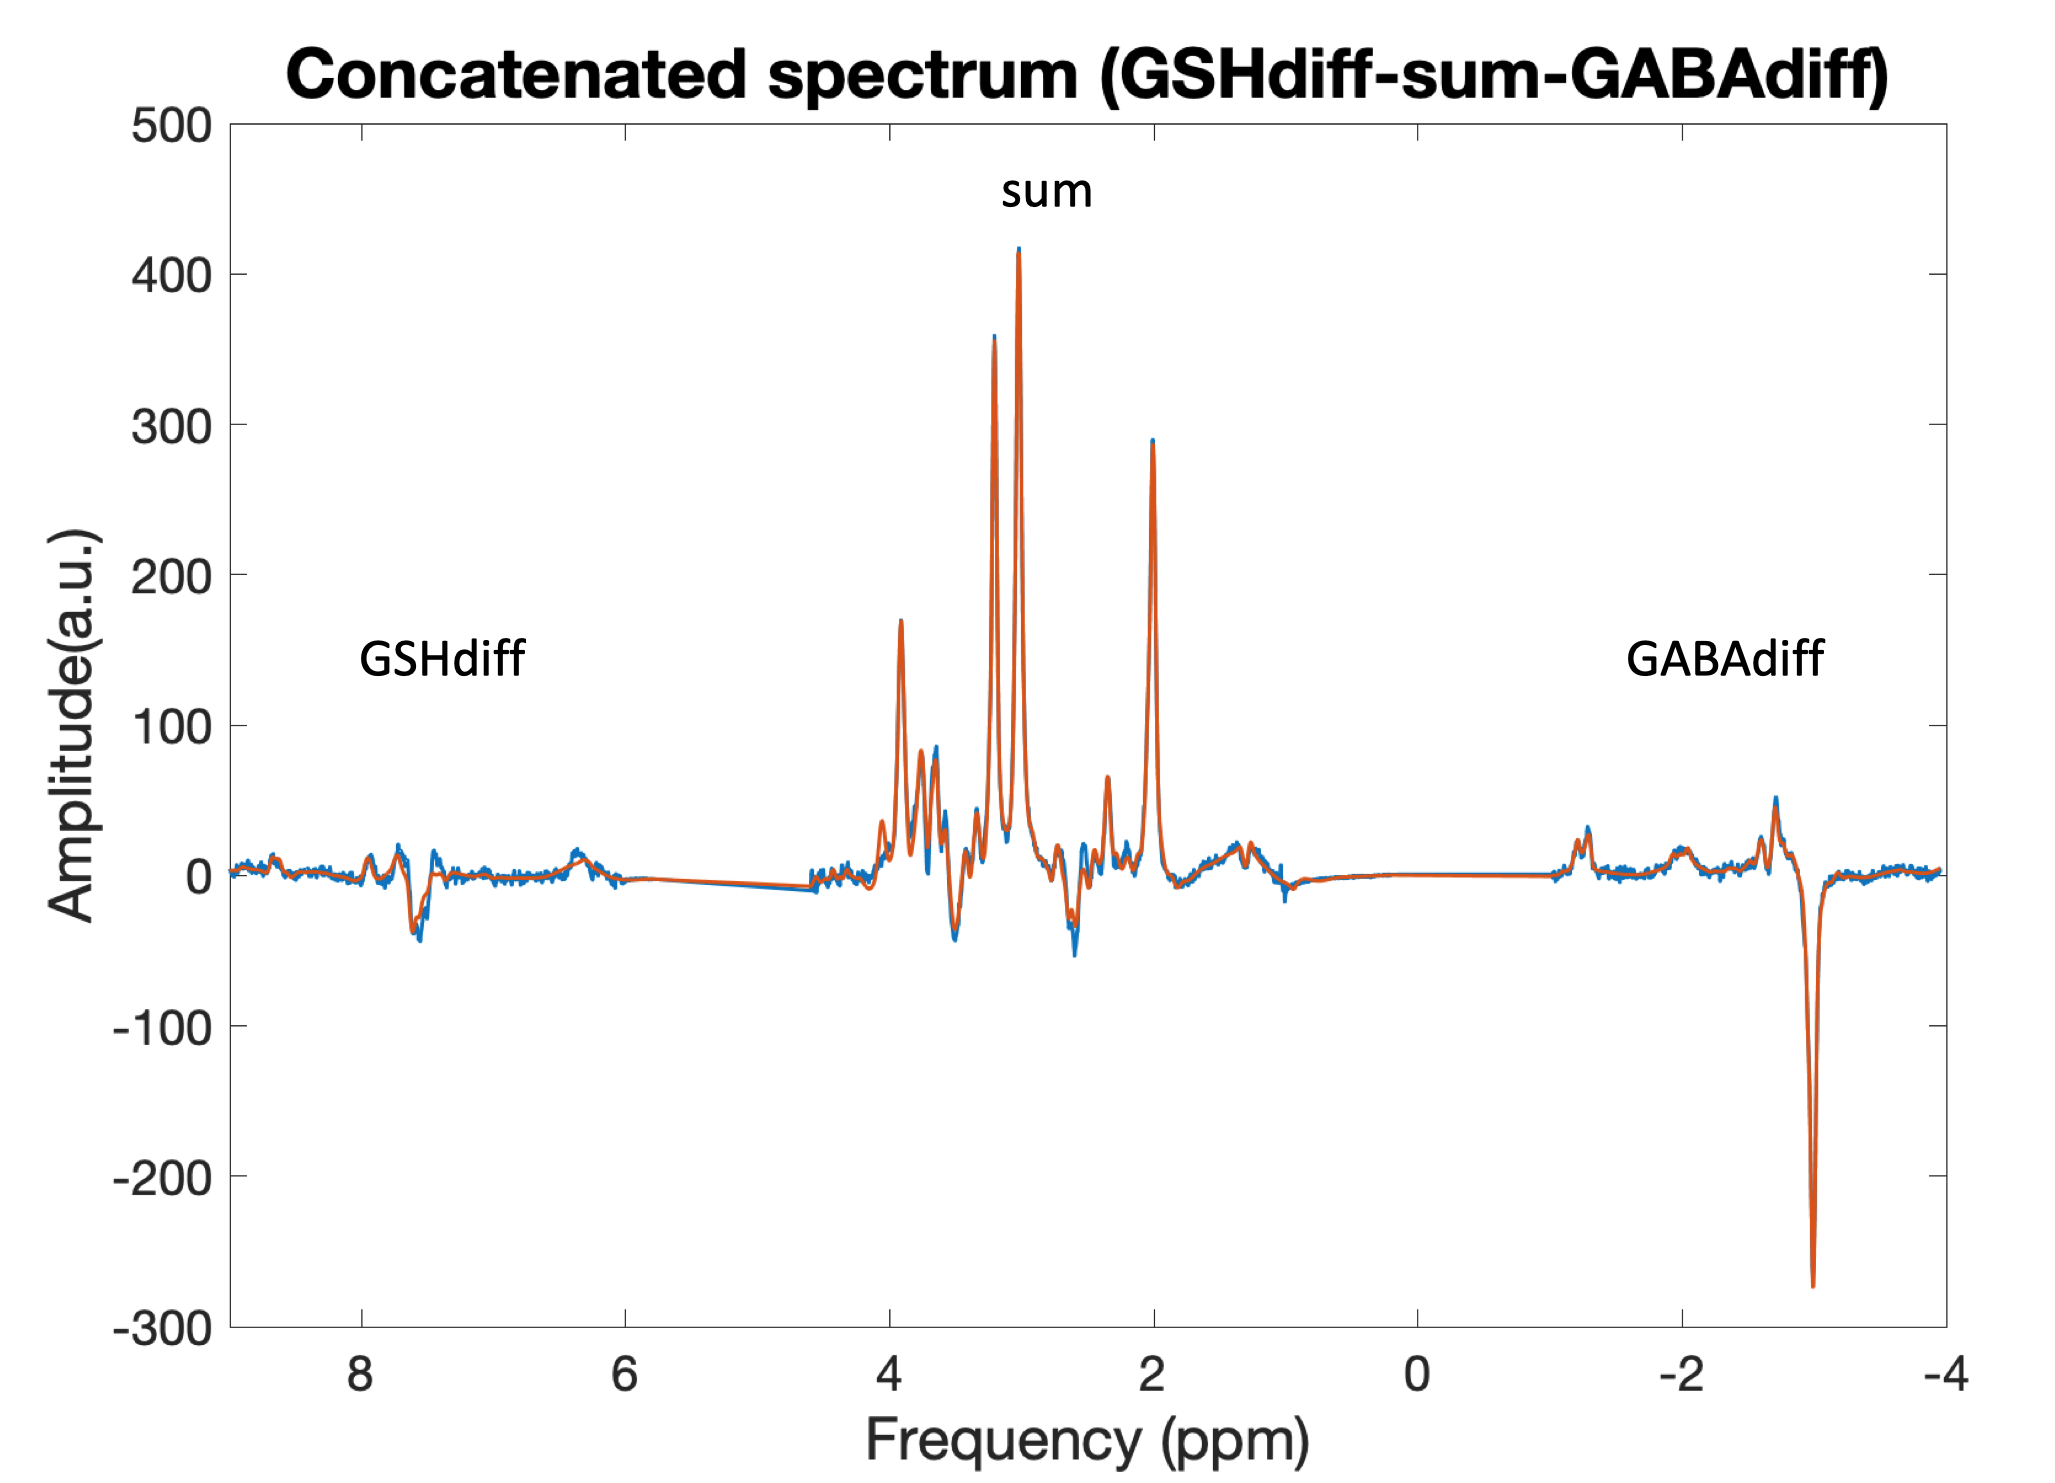
Fitted spectra for the sum, GABA and GSH difference spectra are shown in Figure 2a, with the corresponding concatenated fitted spectrum presented in Figure 2b.
Mean (±SD) GABA and GSH CRLBs are shown for all fitting approaches in Table 1. Metabolite CVs across all subjects are shown for all fitting approaches in Table 2. Test-retest analysis results are shown in Table 3.
Discussion
Metabolite concentrations yielded by our technique are in good agreement with literature reported values. Within-dataset consistency is considered to be improved due to the more constrained concatenated spectrum.
Unlike single-spectrum analyses, the concatenated method makes use of all available spectral information, without relying on internal LCModel soft constraints. CVs for GABA/tCr and GSH/tCr estimates for the concatenated approach agreed with published results. GSH/tCr CVs were considerably lower for the concatenated approach, while GABA/tNAA was considerably lower for the GABAdiff approach, potentially due to the much simpler model. Improvements were observed for the concatenated results compared to edited difference results for GSH, yet not for GABA as its edited spectrum provides enough information for a good fit without any other additional information from the sum and GSHdiff spectra.
Future investigations will study larger datasets and adapt the concatenated fitting approach for HERCULES data.
Conclusions
We successfully implemented an analysis pipeline for simultaneous modelling of GABA/GSH HERMES sum and difference spectra with LCModel. Based on preliminary results, we consider the concatenated analysis a more suitable approach for HERMES data sets.Acknowledgements
GO and RAEE received support from NIH grants R01 EB016089, R01 EB023963, and R01MH106564.References
1. Mescher M, & Garwood M, NMR Biomed, 1998,11, 266–272.
2. Chan K. et al,, Magn Reson Med, 2016, 76, 11–19.
3. Oeltzschner G, Neuroimage, 2018, 185, 181–190.
4. Simpson R et al, Magn Reson Med, 2017, 77, 23–33.
5. Provencher S, Magn Reson Med, 1993, 30, 672–679.
6. Evans, C.J. & Edden, J Magn Reson Imag, 2014, 40, 1445–1452.
7. Wilson M et al., Magn. Reson. Med. 65, 1–12.
8. Naressi A et al., Magn. Reson. Mater. Phys. 12, 141–152.
9. Near J, Magn Reson med, 2014, 73, 44-50
Figures