2234
Reliability of in vivo Glx measurements from GABA-edited MRS at 3T1Department of Radiology, University of Calgary, Calgary, AB, Canada, 2Hotchkiss Brain Institute, University of Calgary, Calgary, AB, Canada, 3Alberta Children's Hospital Research Institute, University of Calgary, Calgary, AB, Canada, 4Department of Neuroimaging, Institute of Psychiatry, Psychology and Neuroscience, London, United Kingdom, 5Russel H Morgan Department of Radiology, The Johns Hopkins School of Medicine, Baltimore, MD, United States, 6F.M. Kirby Centre for Functional MRI, Kennedy Krieger Institute, Baltimore, MD, United States, 7General Electric Healthcare, Calgary, AB, Canada, 8School of Psychology, University of Birmingham, Birmingham, United Kingdom
Synopsis
To measure glutamate and GABA, two spectroscopy sequences are typically performed. Here we investigate the reliability of measuring Glx (glutamate+glutamine) from the same editing sequence used to measure GABA (MEGA-PRESS). We found that Glx measured using the unedited (“off”) sub-spectra of a macromolecule suppressed MEGA-PRESS sequence (MM-suppressed, TE=80ms) moderately agreed with Glx measured using a short-echo PRESS sequence. However, Glx measured using the off sub-spectra of a GABA+ (TE=68ms) MEGA-PRESS sequence and the co-edited Glx signal from the difference spectra of both GABA-edited MEGA-PRESS sequences showed poor agreement.
Introduction
Alterations in the excitatory/inhibitory balance are characteristic of many psychiatric and neurological disorders1. While glutamate (primary excitatory neurotransmitter, often quantified as the combined signal of glutamate and glutamine; Glx) can be measured relatively easily using a standard point resolved spectroscopy sequence (PRESS), γ-aminobutyric acid (GABA; primary inhibitory neurotransmitter) is typically measured using the editing technique Mesher-Garwood PRESS (MEGA-PRESS)2. Thus, to quantify both Glx and GABA, two MRS acquisitions are often performed. This results in a longer scan session and limits the ability to compare GABA and Glx levels in the same tissue due to potential differences in voxel localisation and the likelihood of movement between sequences.
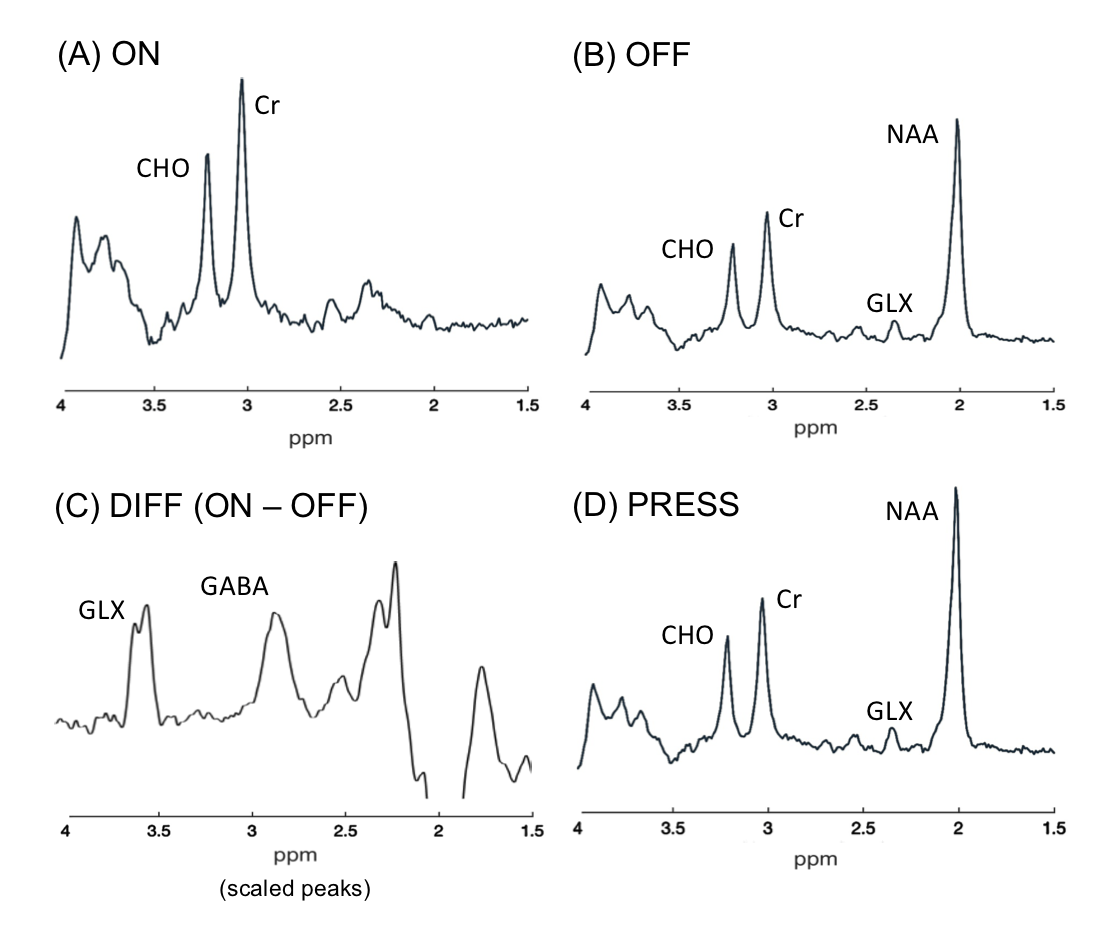
GABA-edited MEGA-PRESS consists of alternating two pulse sequences, one with an editing pulse applied at 1.9ppm (ON) and one with a non-editing pulse applied elsewhere (OFF)3. In the difference (DIFF) spectrum, the overlapping metabolites are removed to reveal GABA (Figure 1). The OFF sub-spectrum is similar to a short-echo (SE; TE=30-35ms) PRESS spectrum, but has a longer echo time to accommodate the editing pulses. Therefore, the OFF sub-spectrum contains metabolites including Glx. Additionally, Glx is co-edited with GABA and therefore also appears in the DIFF spectrum. There is recent evidence that Glx measured using the OFF sub-spectra (but not the DIFF spectra) of a GABA+ (TE=68ms) MEGA-PRESS sequence correlates with Glx measured using a TE=80ms PRESS sequence4, but the reliability of using either method for Glx quantification compared to a SE-PRESS has yet to be investigated.
This study determines the agreement of Glx measured from the OFF and DIFF spectra from two GABA-edited MEGA-PRESS sequences (GABA+, TE=68ms, and macromolecule (MM)-suppressed GABA, TE=80ms) with Glx measured from a SE-PRESS sequence.
Methods
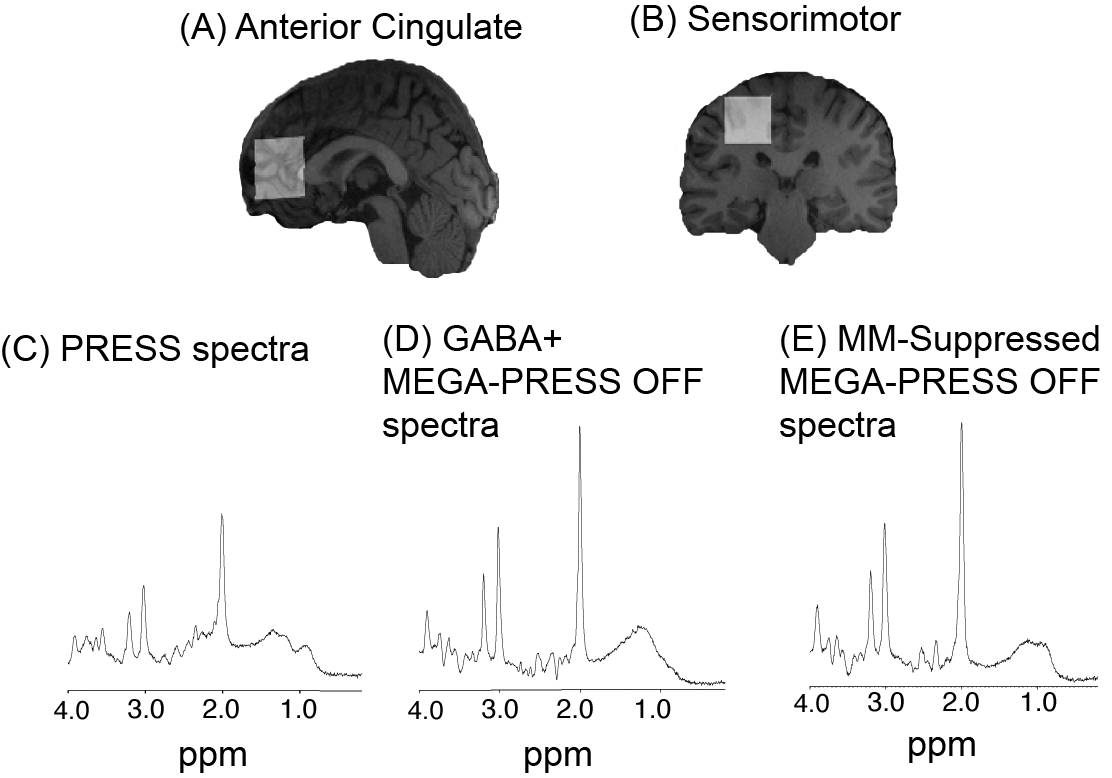
Fifteen healthy, right-handed male participants (18-30y) were scanned on a 3T GE 750w scanner using a 32-channel head coil. 3×3×3cm3 voxels were placed in the left sensorimotor cortex (SM) and the anterior cingulate cortex (AC) (Figure 2). MRS data were acquired using (1) SE-PRESS (TR/TE=1800/35ms, 64 averages), (2) GABA+ edited MEGA-PRESS (TR/TE=1800/68ms, 14ms editing pulses at 1.9ppm and 7.46ppm, 320 averages), and (3) MM-suppressed GABA edited MEGA-PRESS (TR/TE=1800/80ms, 20ms editing pulses at 1.9ppm and 1.5 ppm, 320 averages). FID-A5 was used to isolate and average the OFF sub-spectra, and calculate the DIFF spectra from the MEGA-PRESS data. Glx was quantified relative to water using LCModel6 for all spectra. Data quality was assessed by visual inspection and metabolite linewidth; spectra with a linewidth over 0.1ppm were excluded. Reliability of Glx from the MEGA-PRESS data compared to the SE-PRESS data as an ideal standard was assessed using Bland-Altman plots and intraclass correlation coefficients (ICC), values above 0.5 were considered in agreement7.Results
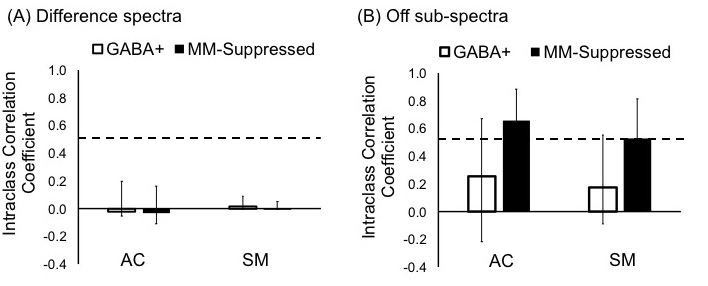
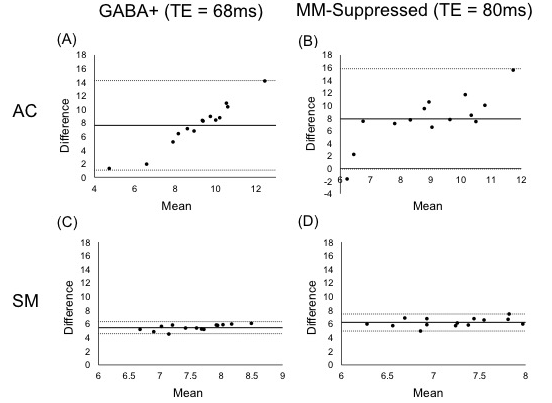
Glx measured from either DIFF spectra (GABA+ and MM-suppressed) showed poor agreement (ICC<0.5) with Glx measured using SE-PRESS (Figure 3A). Bland-Altman plots show a systematic bias, with all Glx measured using the MEGA-PRESS sequences being on average 6-8iu lower than Glx measured using the SE-PRESS sequence (Figure 4).
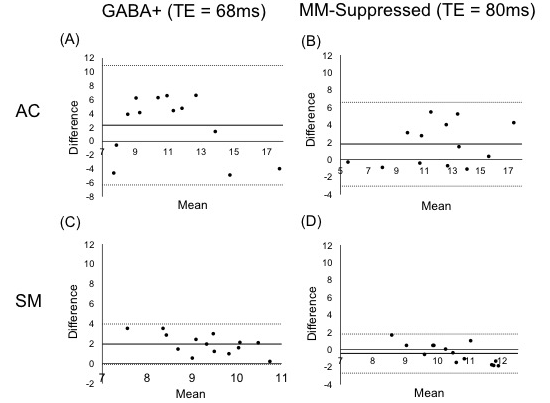
Glx values from the OFF MM-suppressed data show moderate agreement with Glx values from the SE-PRESS spectra in both the anterior cingulate (ICC=0.657) and the sensorimotor cortex (ICC=0.527). Glx values from the OFF GABA+ data showed poor agreement (ICC<0.5; Figure 3B). Bland-Altman plots show a small bias of between 0-2iu (Figure 5).
Discussion and Conclusion
Glx measured using the OFF sub-spectra from the MM-suppressed MEGA-PRESS data were in agreement with Glx from the SE-PRESS sequence and could replace using a separate SE-PRESS sequence. However, Glx measured from the OFF sub-spectra of a standard GABA+ MEGA-PRESS sequence could not. Glx measured from the co-edited Glx peak in the DIFF spectra using either MEGA-PRESS sequence also showed poor agreement.
The difference between the agreement of the MM-suppressed and the GABA+ measures of Glx may be due to the increased TE of the MM-suppressed sequence (TE=80ms). The TE in a SE-PRESS is minimized to maximize all signals and measure multiple metabolites. However, there is evidence that a TE of 80ms is suitable for glutamate due to its signal evolution. A TE of 80ms aims to maximise the glutamate peaks whilst minimising overlapping peaks8,9. The 68ms TE used in GABA+ MEGA-PRESS may result in a non-ideal signal to isolate and measure Glx. The ability to extract Glx values from the same sequence used to measure GABA will enable direct comparison of the two metabolites from the same tissue, an asset when studying neurological disorders characterised by an imbalance in excitation and inhibition (glutamate and GABA).
Acknowledgements
This work was funded by the the University Research Grants Committee, University of Calgary and the Natural Sciences and Engineering Research Council of Canada.References
1. Duncan NW, Wiebking C, Northoff G. Associations of regional GABA and glutamate with intrinsic and extrinsic neural activity in humans-A review of multimodal imaging studies. Neurosci. Biobehav. Rev. 2014;47:36–52 doi: 10.1016/j.neubiorev.2014.07.016.
2. Mullins PG, McGonigle DJ, O’Gorman RL, et al. Current practice in the use of MEGA-PRESS spectroscopy for the detection of GABA. Neuroimage 2014;86:43–52 doi: 10.1016/j.neuroimage.2012.12.004.
3. Mescher M, Merkle H, Kirsch J, Garwood M, Gruetter R. Simultaneous in vivo spectral editing and water suppression. NMR Biomed. 1998;11:266–272.
4. Maddock RJ, Caton MD, Ragland JD. Estimating glutamate and Glx from GABA-optimized MEGA-PRESS: Off-resonance but not difference spectra values correspond to PRESS values. Psychiatry Res. - Neuroimaging 2018;279:22–30 doi: 10.1016/j.pscychresns.2018.07.003.
5. Simpson R, Devenyi GA, Jezzard P, Hennessy TJ, Near J. Advanced processing and simulation of MRS data using the FID appliance (FID-A)—An open source, MATLAB-based toolkit. Magn. Reson. Med. 2017;77:23–33 doi: 10.1002/mrm.26091.
6. Provencher SW. Automatic quantitation of localized in vivo 1H spectra with LCModel. NMR Biomed 2001;14:260–264.
7. Koo TK, Li MY. A Guideline of Selecting and Reporting Intraclass Correlation Coefficients for Reliability Research. J. Chiropr. Med. 2016;15:155–163 doi: 10.1016/j.jcm.2016.02.012.
8. Schubert F, Gallinat J, Seifert F, Rinneberg H. Glutamate concentrations in human brain using single voxel proton magnetic resonance spectroscopy at 3 Tesla. Neuroimage 2004;21:1762–1771 doi: 10.1016/j.neuroimage.2003.11.014.
9. Mullins PG, Chen H, Xu J, Caprihan A, Gasparovic C. Comparative reliability of proton spectroscopy techniques designed to improve detection of J-coupled metabolites. Magn. Reson. Med. 2008;60:964–9 doi: 10.1002/mrm.21696
Figures