2233
Functional magnetic resonance spectroscopy towards detection of initiated release of GABA in chemogenetically modified mice1Biological and Chemical Physics, Weizmann Institute of Science, Rehovot, Israel, 2Neurobiology, Weizmann Institute of Science, Rehovot, Israel
Synopsis
Dynamics of γ -aminobutyric acid (GABA) concentrations in the brain has been shown to vary under a variety of activation paradigms using functional magnetic resonance spectroscopy (fMRS). To provide better understanding of the underlying cellular mechanisms involved, we used fMRS on chemogenetically engineered mice at ultrahigh fields (15.2T), allowing us to investigate the dynamics of metabolites in response to activation of a specific neuronal population (GABAergic) in the reticular nucleus. fMRS data from four mice was analyzed using LCModel and did not show any significant change in GABA.
Introduction
The dynamics of brain metabolites under activation paradigms or perturbation of homeostasis has been investigated over the years using functional Magnetic Resonance Spectroscopy (fMRS). One main studied metabolite is γ -aminobutyric acid (GABA), the key inhibitory neurotransmitter. Previous studies in humans showed that changes in local GABA concentrations during a variety of tasks, including motor learning [1], working memory [2], reinforcement learning [3] psychological stress [4] etc. To date, the source of the observed changes in GABA during fMRS activation remains unexplained, and it is unclear whether they are attributed to neurotransmitter cycling, metabolic fluxes or some other mechanism.
A significant drawback of fMRS in humans is its lack of specificity: a given task involve multiple inter-connected neuronal networks, brain regions and cell types. Furthermore, given the rapid, millisecond timescales of neurotransmitter release, it is unclear which dynamic cellular processes are responsible for the observed MRS changes. To gain an understanding of the links between the activity of specific circuit components and the observed fMRS signal, we combined fMRS at ultrahigh fields (15.2T) with chemogenetic manipulations of neural activity. Chemogenetics allows sustained activation (~hours) of specific neuronal populations (e.g. GABAergic) within target brain regions by systemic administration of pharmacological compounds that lead to specific excitation or silencing of defined circuit components. These experiments will pave the way to provide additional insights into the above questions.
Methods
Mice: We injected 4 male Gad2-IRES-Cre mice [5] with Cre-dependent adeno-associated virus (AAV) expressing the engineered receptor hM3Dq [6,7]. Expression was achieved in GABAergic neurons of the Reticular Thalamic nucleus (RT), which has inhibitory projections to the Ventral Anterior-Lateral and Ventral Postero-Laterl complexes of the thalamus and the Globus Pallidus [8]. Injecting the mice with Compound21 intraperitoneally resulted in activation of the engineered GABAergic neurons within the RT.
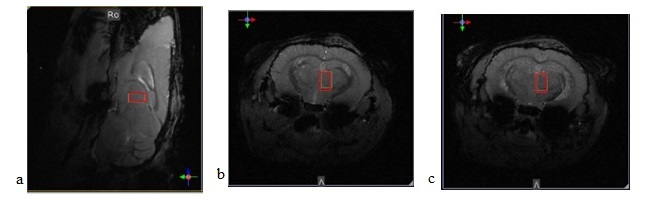
MRS: We collected MR data in a 15.2T Bruker Biospec, with 1H CryoProbe 2-element array. Acquiring anatomical images using a T1 weighted FLASH sequence ( voxels , in plane FOV with points, FA= and TR/TE=72.2/4.2 ms) allowed us to focus our single voxel spectroscopy () on the neuronal projection site (Fig. 1). Second order shimming resulted in water linewidths of 17-19 Hz. We collected metabolite spectra using PRESS (TR/TE=2500/16.5ms) with a total of 1024 repetitions (42 minutes) prior to injection and 2048 repetitions (84 minutes) following injection.
Data analysis: The post-injection MRS data was divided into two 1024-repetition segments; this was done to differentiate between the initial activation buildup and the sustained steady state. We fitted each segment’s data (as well as the pre-injection spectra) using LCModel v6.3 [9] with a basis set of 18 metabolites: alanine (Ala), aspartate (Asp), creatine (Cr), -aminobutyric acid (GABA), glucose (Glc), glutamate (Glu), glutamine (Gln), glutathione (GSH), glycine (Glyc), glycerophosphorylcholine (GPC), phosphorylcholine (PCh), myo-inositol (Ins), lactate (Lac), N-acetylaspartate (NAA), N-acetylaspartylglutamate (NAAG), phosphocreatine (PCr), phosphorylehtanolamine (PE), and taurine (Tau). We separately calculated the percent change of each metabolite during the two post-injection segments, relative to the pre-injection segment.
Results
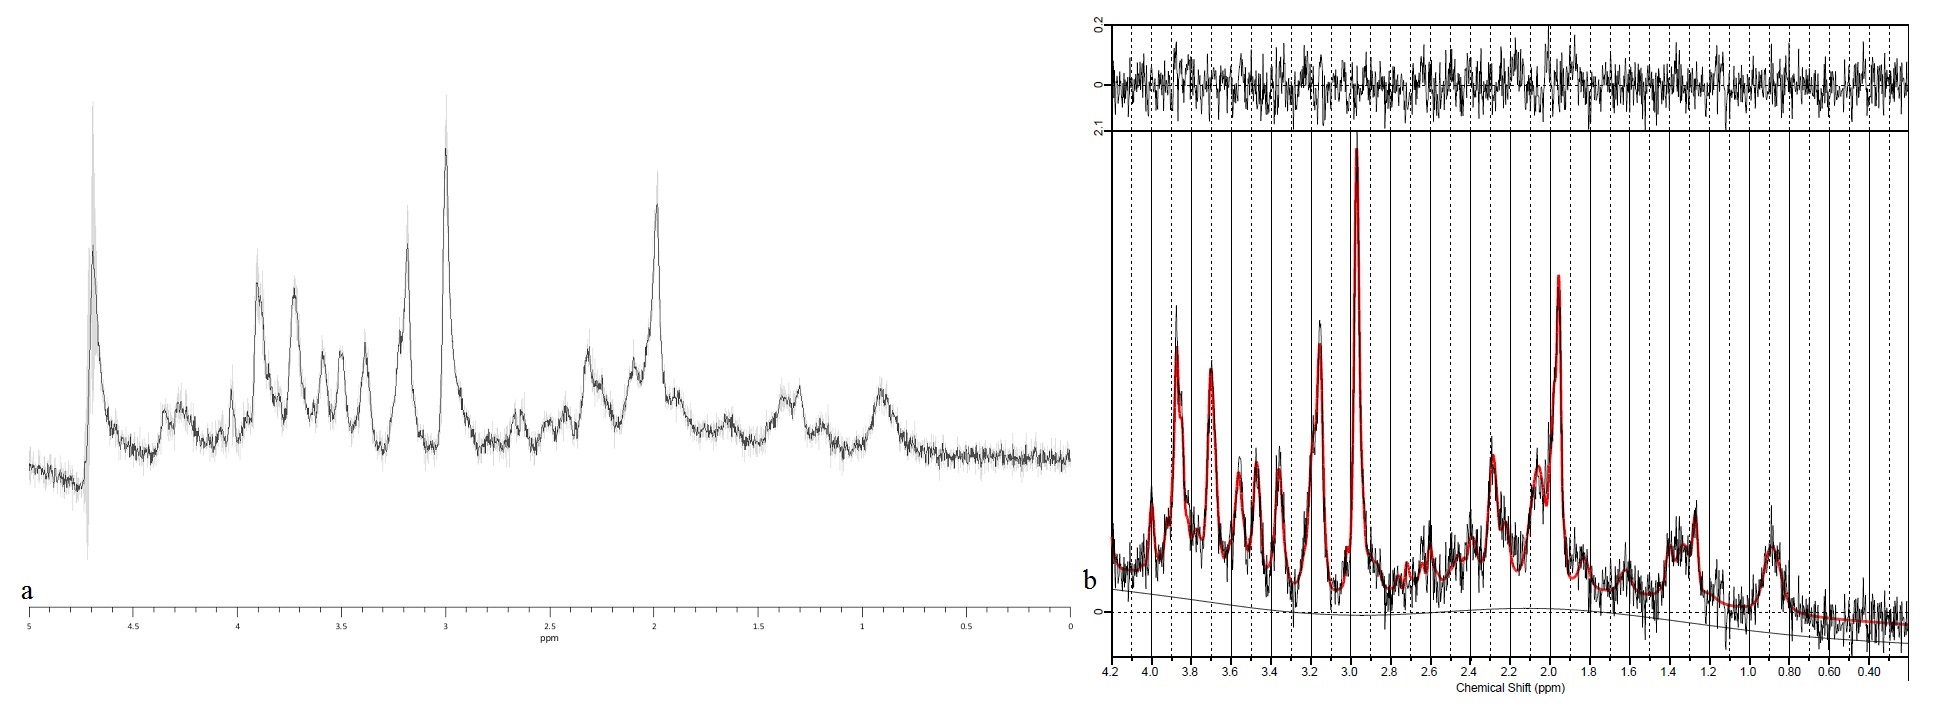
Fig. 2a shows the spectrum prior to injection, obtained by averaging over all four mice, alongside inter‑subject standard deviations, demonstrating the stability of our system and measurement protocols (for visualization purposes only, the data was deconvolved using the QUECC algorithm and a water reference dataset). Fig. 2b shows a sample LCModel fit.
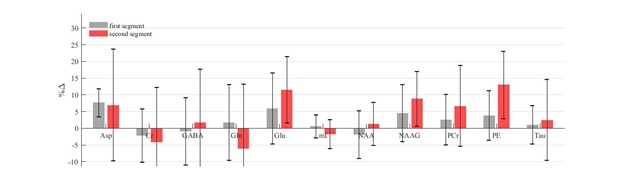
Fig. 3 shows the percent change in each reliably quantified metabolite (rCRLB<15%) relative to rest in each of the two segments. No significant change was seen for any of the metabolites.
Discussion and Conclusions
The current study combined a novel, specific and controlled fMRS paradigm with the high sensitivity and spectral resolution offered by ultrahigh fields (15.2T) to examine the origins of the GABA signal changes reported in human studies. The lack of any observed metabolic changes can be explained by several factors. First, it is possible that the effect sizes are too small given our modest sample size (4 mice). Second, our usage of long activation segments – 42 minutes each – forced by the small sample size, could have obscured the temporal dynamics of the metabolites, resulting in a “temporal partial volume artifact”. These concerns can be addressed by increasing the sample size, which will in turn increase our statistical power and also enable us to examine shorter temporal segments.
Despite the cellular specificity of chemogenetics, the sustained neuronal activation it produces might trigger subsequent network dynamics and cascades. Furthermore, the neuronal activation might also recruit nearby cells (e.g. astrocytes) and it should be kept in mind that the measured response we observed is the sum of all such processes.
Acknowledgements
Assaf Tal acknowledges the support of the Monroy‐Marks Career Development Fund, the Krenter-Katz Fund and the Minerva Foundation.References
1. Floyer-Lea, Anna, et al. "Rapid modulation of GABA concentration in human sensorimotor cortex during motor learning." Journal of neurophysiology 95.3 (2006): 1639-1644.
2. Michels, Lars, et al. "Frontal GABA levels change during working memory." PloS one 7.4 (2012): e31933.
3. Bezalel, Vered, Rony Paz, and Assaf Tal. "Inhibitory and excitatory mechanisms in the human cingulate-cortex support reinforcement learning: A functional Proton Magnetic Resonance Spectroscopy study." NeuroImage 184 (2019): 25-35.
4. Hasler, Gregor, et al. "Effect of acute psychological stress on prefrontal GABA concentration determined by proton magnetic resonance spectroscopy." American Journal of Psychiatry167.10 (2010): 1226-1231.
5. Taniguchi, Hiroki, et al. "A resource of Cre driver lines for genetic targeting of GABAergic neurons in cerebral cortex." Neuron 71.6 (2011): 995-1013.
6. Sternson, Scott M., and Bryan L. Roth. "Chemogenetic tools to interrogate brain functions." Annual review of neuroscience37 (2014): 387-407.
7. Shapiro, Mikhail G., Shawnalea J. Frazier, and Henry A. Lester. "Unparalleled control of neural activity using orthogonal pharmacogenetics." ACS chemical neuroscience3.8 (2012): 619-629.
8. Allen brain atlas – mouse connectivity - http://connectivity.brain-map.org/?searchMode=source&sourceDomain=262&primaryStructureOnly=true&isi=false&transgenicLines=177838584&initImage=TWO_PHOTON&experimentCoordinates=6200,4400,7450&experiment=156252954
9. Provencher, Stephen W. "Automatic quantitation of localized in vivo 1H spectra with LCModel." NMR in Biomedicine 14.4 (2001): 260-264.
Figures