2230
Quantification of Glutathione and Ascorbate in the Human Brain using Short-TE PRESS.1Radiology, Stanford University, Stanford, CA, United States
Synopsis
The SNR advantage of short-TE methods over long-TE editing-methods provided a compelling motivation for reliable quantification of glutathione using LCModel. In this study, we improved the accuracy of the glutathione basis by using an experimental glutathione in our otherwise synthetic LCModel basis. We further added ascorbate as a complementary measure of oxidative stress. Validation was made using a brain metabolite titration phantom with a matrix of glutathione and ascorbate. The near perfect linear regression results demonstrated that both GSH and ASC at physiological concentrations can be reliably quantified using LCModel. In vivo study also showed consistent glutathione quantification.
INTRODUCTION
In a recent comparison of PRESS and MEGA-PRESS quantification of glutathione (GSH) in human brain at 3T, Nezhad et al.1 demonstrated a clear need for phantom validation when using basis-set fitting of metabolites such as GSH in short TE PRESS. Although MEGA-PRESS was found to have a clear advantage in the Nezhad study, the SNR advantage of short-TE methods over long-TE editing-methods provided a compelling motivation for improving, testing, and validating a short-TE basis for glutathione. Due to the complexity of the GSH resonances and their dependence on temperature, simulated basis spectra are often inaccurate, resulting in compromised in vivo quantification.2 In this study, this problem was remedied by using an experimental GSH (pH 7.2, 37C) spectrum in our otherwise synthetic LCModel basis. We further explored adding experimental ascorbate (ASC) spectrum to our basis set for its value as a complementary measure of oxidative stress. The impact of ASC was also important as it partially overlaps with GSH signals.METHODS
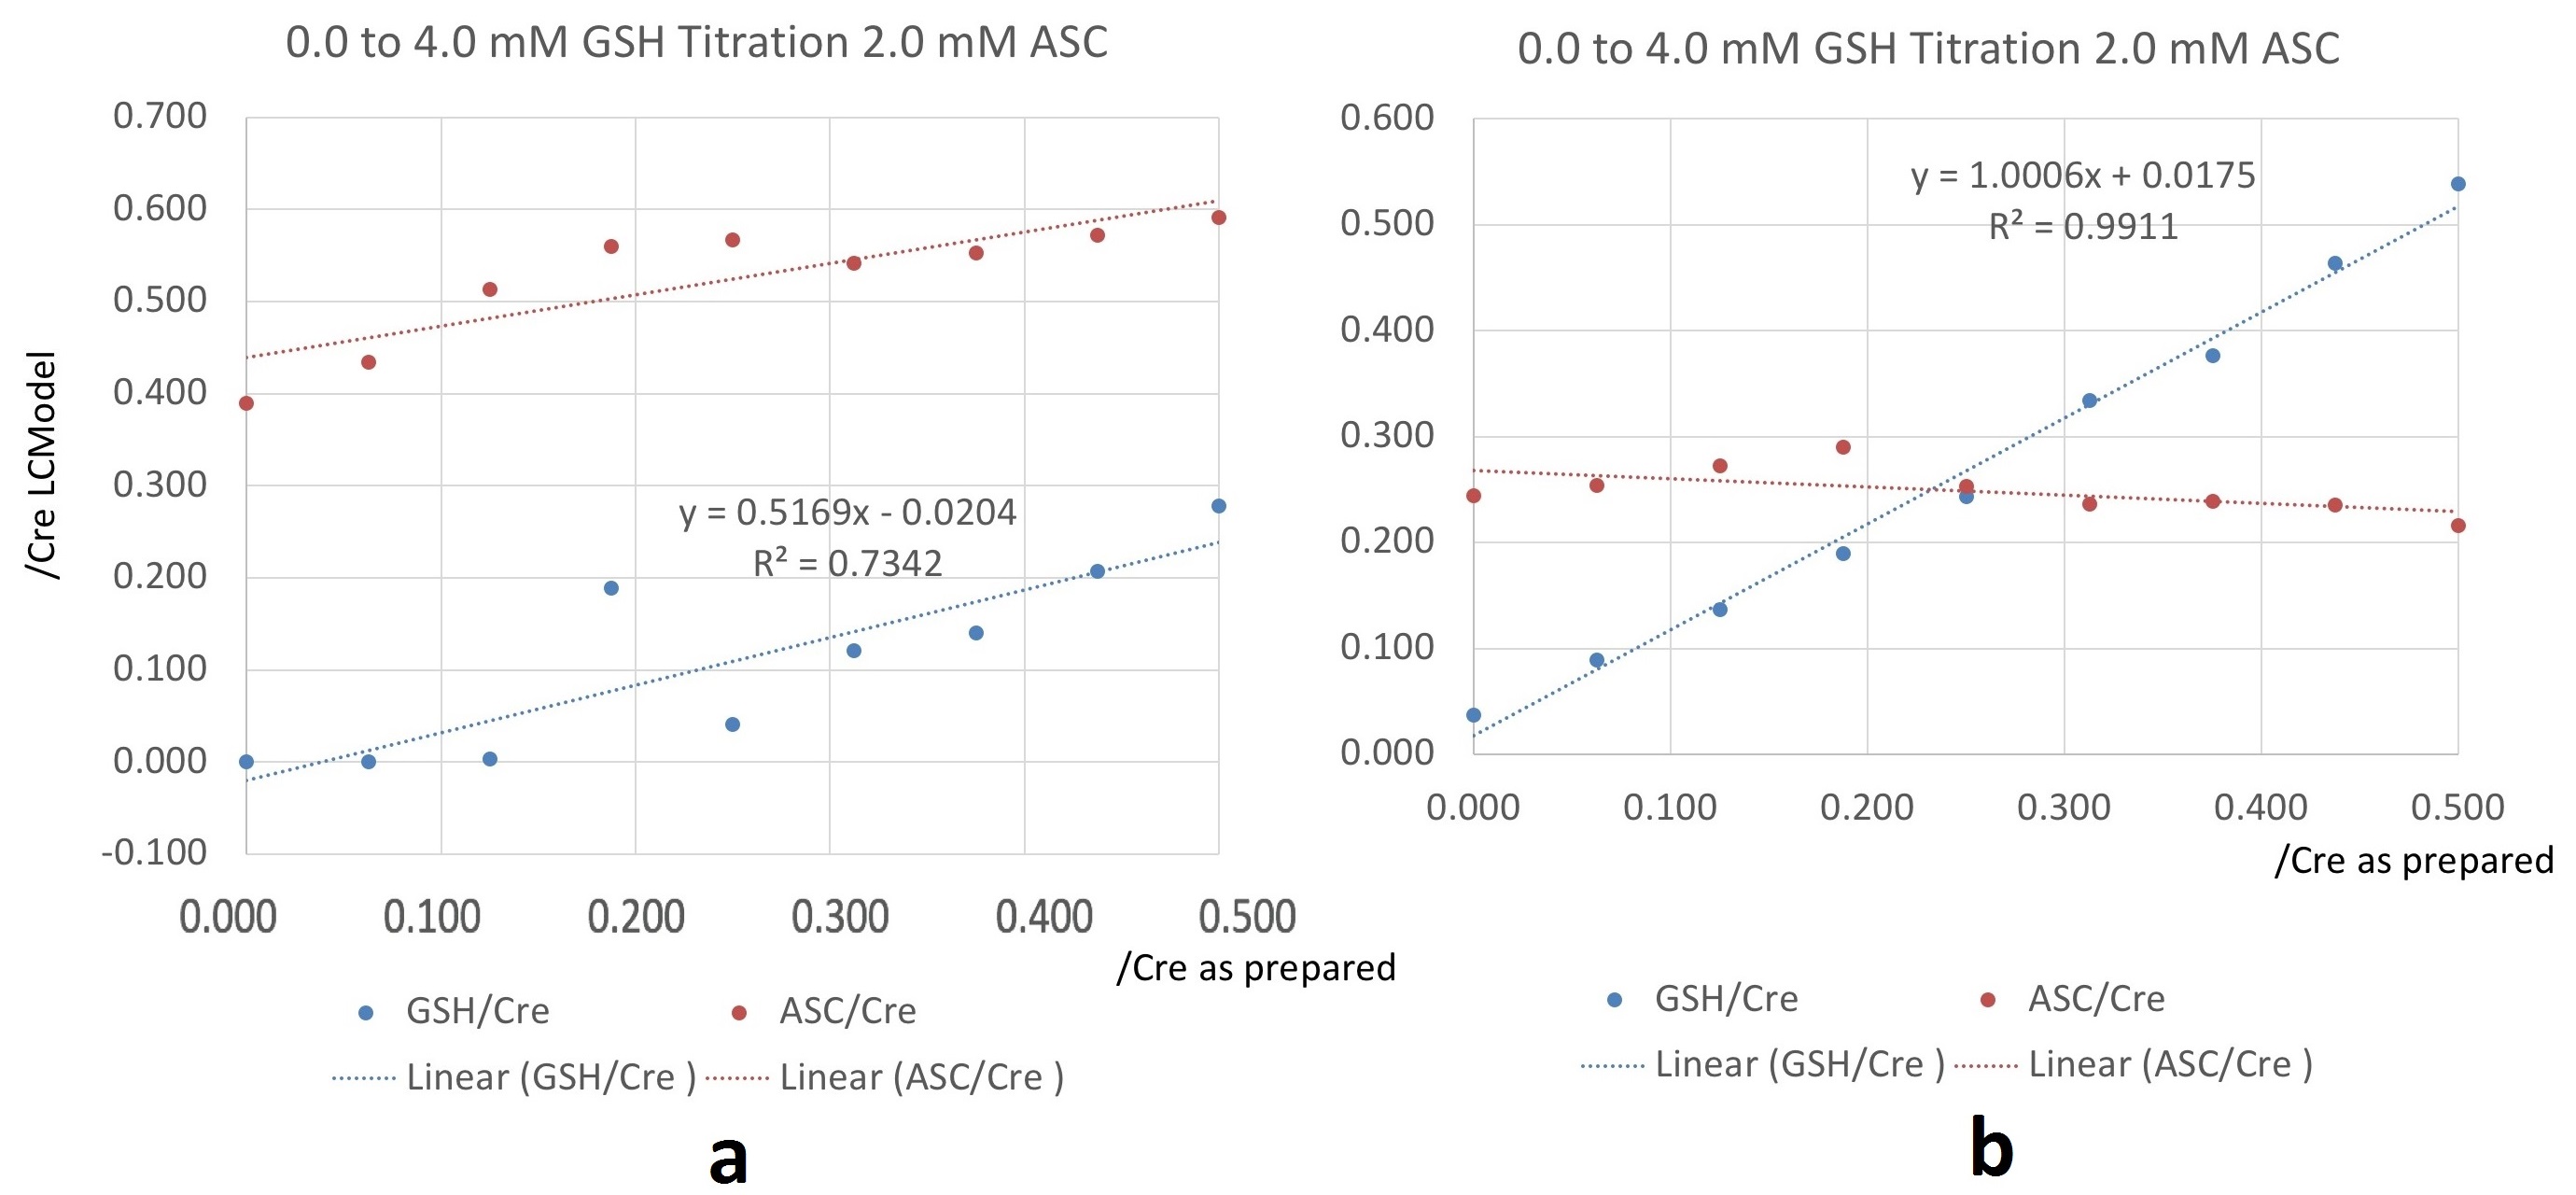
Validation was made using a 37C brain metabolite titration phantom with varying GSH and ASC concentrations, having each metabolite concentration ranging from 0 to 4.0 mM in 0.5 mM steps. Prior to LCModel fitting3, phantom data were modified with in-vivo lineshapes (0.05 ppm) and SNR (140:1 for NAA). Linear regressions of both GSH and ASC titrations were also made. The hybrid LCModel basis set was also tested for repeatability on in vivo spectra where data were acquired six times from a voxel in the occipital lobe of a healthy subject in one exam. To avoid partial suppression of resonances above 3.8 ppm, a GE PROBE-p™ sequence was used with a reduced water-suppression RF pulse bandwidth of 75Hz. All spectra were acquired on a GE 750 3T scanner with 2x2x2cm voxel, TE/TR=35ms/2s, 64 averages, 2:56 min total scan time.RESULTS
Spectra and their LCModel fits for the GSH titration with ASC at 2 mM using the all simulated basis set versus hybrid basis set are shown in Figure 1a and Figure 1b respectively. Those for the ASC titration with GSH at 2 mM using the all simulated versus hybrid basis sets are shown in Figure 2a and Figure 2b respectively. Figure 3 and Figure 4 shows the linear regressions of GSH and ASC titrations, respectively. Figure 5 shows a representative in vivo spectrum and its LCModel fit. Estimated from the in vivo repeatability study, GSH/(PCr+Cr) in the occipital lobe was 0.199+/-0.027 with a mean CRLB of 14% while ASC/(PCr+Cr) was 0.321+/-0.053 with a mean CRLB of 16%.DISCUSSION
Compared to using the all simulated basis set, linear regression results showed clear improvement in the quantification of GSH and ASC using the hybrid basis set. The near perfect linear regression results of both GSH and ASC titrations using the hybrid basis set demonstrated that both GSH and ASC at physiological concentrations can be reliably quantified using a short-TE PRESS acquisition in combination with an improved LCModel basis set. Assuming an 8 mM (PCr+Cr) concentration, the estimated GSH in OCC was 1.59+/-.22 mM, consistent with the study by Nezhad et al.CONCLUSION
With an accurate and complete basis set, in vivo GSH can be reliably quantified from short TE PRESS spectra without editing using LCModel. Compared to the editing method with long TE, short TE measurement utilizes higher SNR and thus requires shorter acquisition time.Acknowledgements
NIH EB015891, NIH MH110683, the Lucas foundation, GE Health Care, and the Stanford Center for Cognitive and Neurobiological ImagingReferences
1. Sanaei Nezhad, F., Anton, A., Parkes, L. M., Deakin, B., and Williams, S. R. (2017) Quantification of glutathione in the human brain by MR spectroscopy at 3 Tesla: Comparison of PRESS and MEGA-PRESS. Magn Reson Med 78, 1257-1266
2. Kaiser, L. G., Marjanska, M., Matson, G. B., Iltis, I., Bush, S. D., Soher, B. J., Mueller, S., and Young, K. (2010) (1)H MRS detection of glycine residue of reduced glutathione in vivo. J Magn Reson 202, 259-266
3. Provencher, S. W. (2001) Automatic quantitation of localized in vivo 1H spectra with LCModel. NMR Biomed 14, 260-264
Figures