2228
Editing MRS lineshapes using the convolution theorem: potential for applications to statistical analysis of heterogeneous tissue1CRMBM, Aix Marseille University, Marseille, France
Synopsis
The statistical distribution of a number of measurement parameter values in heterogeneous tissues can be analyzed based on MR spectra, using a paradigm recently introduced by us. However, the MR resonances in question are affected by influences on line shape other than those exerted by the measurement parameter to be analyzed, e.g., by magnetic-field inhomogeneity. We demonstrate here that desired and spurious line shape contributions can be efficiently disentangled by judiciously employing the convolution theorem. This method should facilitate future applications of our method of tissue heterogeneity assessment.
Introduction
Signal filtering techniques have been established practice in high-resolution 1D and 2D NMR spectroscopy for many decades 1, and are mostly aimed at improving signal-to-noise ratio and/or resolution of MR spectra. One frequently used procedure is the Lorentzian-Gaussian lineshape transformation, consisting of (i) deconvolution with a Lorentzian function, followed by (ii) convolution with a Gaussian of the same linewidth. Morris et al. have suggested to replace the Lorentzian in this scheme by an empirical reference lineshape to compensate for lineshape contributions that are not typically Lorentzian 2.
We present here a new deconvolution strategy for cases with significant lineshape broadening due to variations, across an observed volume, of a particular parameter of interest, x, with known influence on chemical shift, δ, i.e., δ = f(x). The goal of our algorithm is to compensate for all lineshape contributions that are not due to x, without otherwise affecting the experimentally obtained lineshape. The parameter x in question, indirectly observable by MRS, may be pH (31P) 3; Mg2+ (31P) 4 or Ca2+ concentration (19F) 5; temperature (1H) 6, and others. Here, we discuss a computer simulation for x = temperature, as significant thermal heterogeneity occurs, e.g., in tissues under hyperthermia treatment. Simulations and experiments for further parameters, x, were also performed (data not shown).
Methods
Two types of MR spectra were numerically simulated: spectra assumed to represent tissues in the (i) presence and (ii) absence of x gradients. The latter spectra served as reference lines with which to deconvolve the former. We then extracted quantitative descriptors of the statistical distribution of x values: weighted mean and weighted median, standard deviation, range, skewness, kurtosis, and entropy 6. All calculations were performed using EXCEL (vs. 14.4.7 for Macintosh, Microsoft, Redmond, USA), with a StatPlus:mac module (version v5, AnalystSoft, Walnut, CA, USA) for Fourier transformation.Results and Discussion
The basic assumption of our novel approach is that any x-related contribution to the line shape in question is independent of x-unrelated contributions. Under this condition, the x-related contribution can be obtained from an experimentally obtained line shape by removing all x-unrelated (spurious) contributions through deconvolution (Fig. 1, red arrow). The chemical shift of a water 1H MRS resonance is a linear function of temperature. We simulated an experiment where the water 1H MRS spectrum of a given biological tissue is first measured at thermal equilibrium (i.e., before application of hyperthermia) to obtain the water line shape in the absence of temperature gradients (Fig. 1, bottom center; Lorentzian reference spectrum, Sref, representing spurious lineshape contributions only). Then, raw spectra obtained during hyperthermia (Sraw in Fig. 1, bottom left; Lorentzian) are deconvolved with the reference spectrum to yield line shapes defined by temperature gradients only (Sdecon in Fig. 1, bottom right; chemical-shift converted to temperature).
In practice, deconvolution is executed using the deconvolution theorem (blue arrows) 6 as follows. First, iFT of Sraw and Sref yield FIDraw and FIDref (Fig. 1, top left and top center), respectively; however, in practical experiments FIDraw and FIDref are usually acquired directly. Then, complex division of FIDraw with FIDref yields FIDdecon (Fig. 1, top right) which is Fourier transformed to give Sdecon. Note that in this example, Sref has been set on resonance (0 Hz), corresponding to an unmodulated exponential function (FIDref). If Sref is not on resonance, FIDdecon needs to be complex multiplied with the iFT of a synthetic spectrum representing a delta function at the chemical shift of Sref. The same algorithm can be applied to cases where x represents a parameter other than temperature, as mentioned in Introduction.
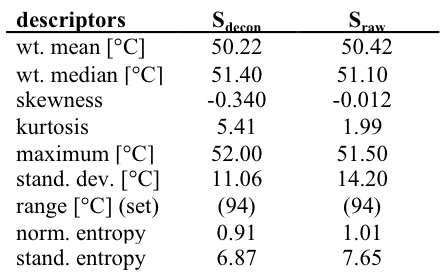
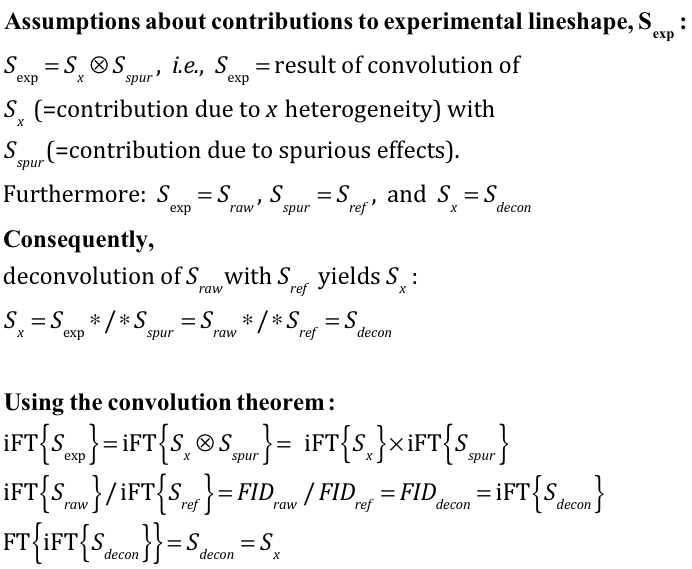
A comparative summary of the statistical descriptor values obtained for the simulated temperature distributions in Fig. 1, with and without deconvolution, is given in Table 1. Since in this basic simulated example all resonances are symmetric, there is virtually no difference between means, medians and maxima for raw vs. deconvolved distributions, within the precision of the simulation (at 200 digital points or histogram bins for each distribution). However, as deconvolution results in a narrowing of the distribution curve, standard deviation is necessarily decreased and kurtosis increased for Sdecon vs. Sraw, whereas skewness and entropy are influenced by the cutoff at high and low temperatures (ranges judiciously chosen; identical for Sdecon and Sraw). Further results confirmed our algorithm for a range of bi and trimodal distributions as well (data not shown). The basic equations, generalized for any applicable parameter x, are given in Fig. 2.
Conclusion
A new algorithm using the convolution theorem was proposed to correct for spurious lineshape contributions to MRS resonances sensitive to particular physico-chemical parameters in heterogeneous tissue.Acknowledgements
Funding by CNRS (UMR 7339) is gratefully acknowledged.References
1. Hull, W. E. Two-dimensional NMR spectroscopy, Applications for chemists and biochemists. 2nd ed. (Croasmun WR, Carlson, R. M. K., editors.). Weinheim: VCH Publishers; 1994. 2. Morris, G. A., Barjat, H., Horne, T. J. Reference deconvolution methods. Prog Nucl Magn Reson Spectrosc 1997;31:197–257. 3. Lutz NW, Le Fur Y, Chiche J, Pouyssegur J, Cozzone PJ. Quantitative in-vivo characterization of intracellular and extracellular pH profiles in heterogeneous tumors: a novel method enabling multiparametric pH analysis. Cancer Res 2013;73:4616–4628. 4. Lutz NW, Bernard M. Multiparametric quantification of heterogeneity of metal ion concentrations, as demonstrated for [Mg2+] by way of 31P MRS. J Magn Reson 2018;294:71-82. 5. Lutz NW, Bernard M. Multiparametric quantification of the heterogeneity of free Ca2+ concentration by 19F MR spectroscopy. J Magn Reson, DOI: 10.1016/j.jmr.2018.10.009. 6. Lutz NW, Bernard M. Multiparametric quantification of thermal heterogeneity within aqueous materials by water 1H NMR spectroscopy: Paradigms and algorithms. PLoS One 2017;12:e0178431.Figures