2227
Simultaneous edited detection of GABA, glutathione and ethanol using HERMES1Russell H. Morgan Department of Radiology and Radiological Science, The Johns Hopkins University School of Medicine, Baltimore, MD, United States, 2F. M. Kirby Research Center for Functional Brain Imaging, Kennedy Krieger Institute, Baltimore, MD, United States, 3Department of Clinical and Health Psychology, University of Florida, Gainesville, FL, United States, 4Center For Cognitive Aging and Memory, McKnight Brain Institute, University of Florida, Gainesville, FL, United States
Synopsis
HERMES allows simultaneous edited detection of multiple low-concentration metabolites in the human brain. Here, HERMES editing of GABA, glutathione (GSH) and ethanol (EtOH)
Introduction
Edited magnetic resonance spectroscopy (MRS) resolves overlapping signals of low-concentration metabolites for improved quantification. Recently, Hadamard Encoded and Reconstruction of MEGA-edited Spectroscopy (HERMES) has been demonstrated, allowing simultaneous edited detection of multiple metabolites for two- and three-fold acceleration of data acquisition compared to sequential acquisition1,2. Here, we demonstrate a four-step HERMES editing scheme to allow the simultaneous edited detection of GABA, glutathione (GSH) and ethanol (EtOH), designed for studies of acute alcohol administration, and the brain chemistry of alcoholism and withdrawal. After moderate alcohol consumption, brain EtOH concentration rises above the ~1 mM detection limit of MRS, and EtOH becomes directly detectable in the MR spectrum. The mechanism of action of alcohol is complex, but includes facilitation of GABAA receptor function3. Prior MRS studies have demonstrated that EtOH reduces brain GABA levels acutely4, and that GABA is reduced in young binge drinkers5. GSH is a major antioxidant in the brain and is interpreted as a marker of oxidative stress (OS). Alcohol raises levels of reactive oxygen species and OS is a major mechanism of alcohol-related tissue damage6. One preliminary study (using non-edited MRS) showed that heavy alcohol use is associated with reduced hippocampal GSH7.Methods
Experiments were conducted on Siemens MAGNETOM Prisma 3 T MRI scanners using a 64-channel head coil.
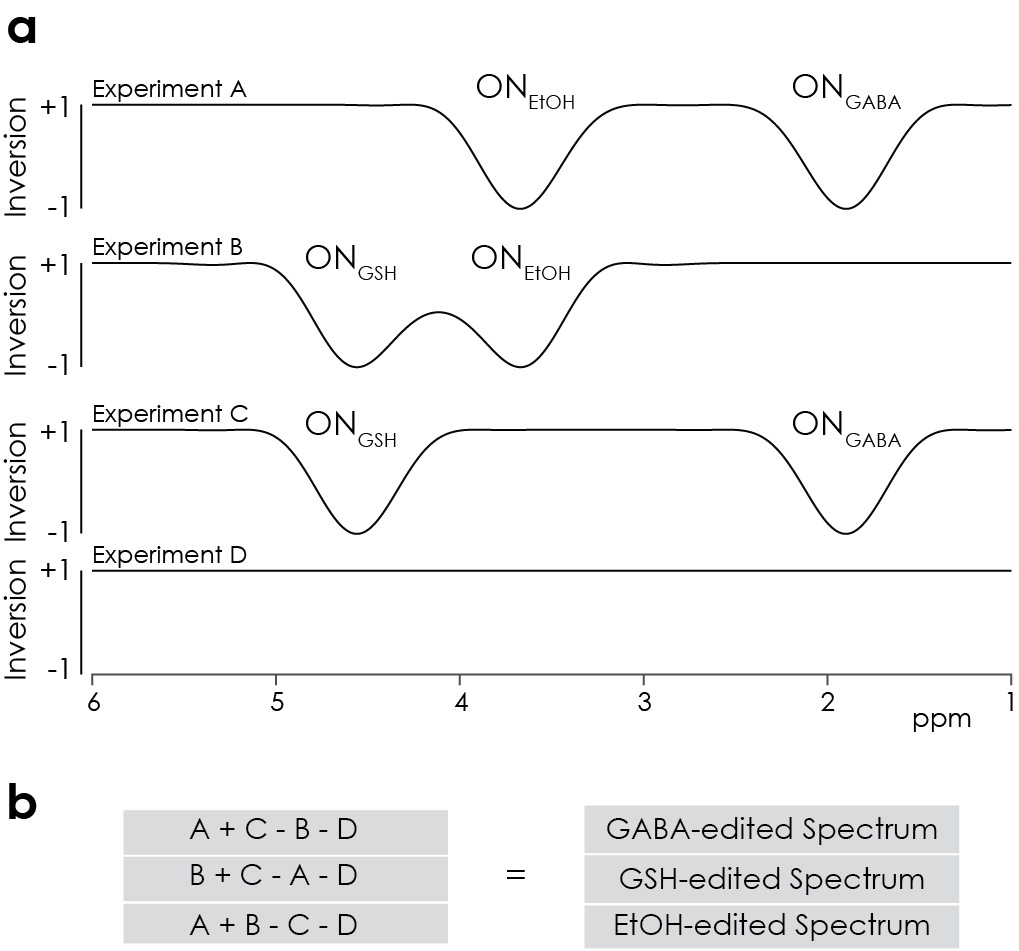
Simulations: The four-step HERMES scheme (A, B, C, D) for simultaneous edited detection of GABA, GSH and EtOH is shown in Figure 1. In Experiment A, a dual-lobe editing pulse is applied to GABA (1.9 ppm) and EtOH (3.67 ppm). In Experiment B, a dual-lobe editing pulse is applied to GSH (4.56 ppm) and EtOH. In Experiment C, a dual-lobe editing pulse is applied to GABA and GSH, and in Experiment D, no editing pulse is applied. Thus, the GABA-edited difference spectrum can be calculated from A+C–B–D, the GSH-edited spectrum from B+C–A–D, and the EtOH-edited spectrum from A+B–C–D. Density-matrix simulations of this scheme (with TE 80 ms and editing pulse duration 20 ms) were performed at the voxel center using FID-A8.
Phantom Experiments: A single phantom containing GABA, GSH and EtOH (20 mM each) was prepared. The scan parameters were: TE/TR 80/2000 ms; 2048 datapoints; 2 kHz spectral width; voxel size 27 ml; and 64 transients.
In Vivo Experiments: A 200-lb male consumed 5 oz of 40% ethanol, diluted in soft drink, and data acquisition was initiated within 10 min of beverage consumption. The MRS voxel was prescribed in the midline parietal cortex with the same acquisition parameters as the phantom experiments, except 1664 transients were acquired. The scan time was about ~1 h.
Data Processing: In vivo data were analyzed using Gannet9. The in vivo data were broken down into successive ~4-min blocks of 128 averages each to evaluate the time course of the EtOH signal.
Results
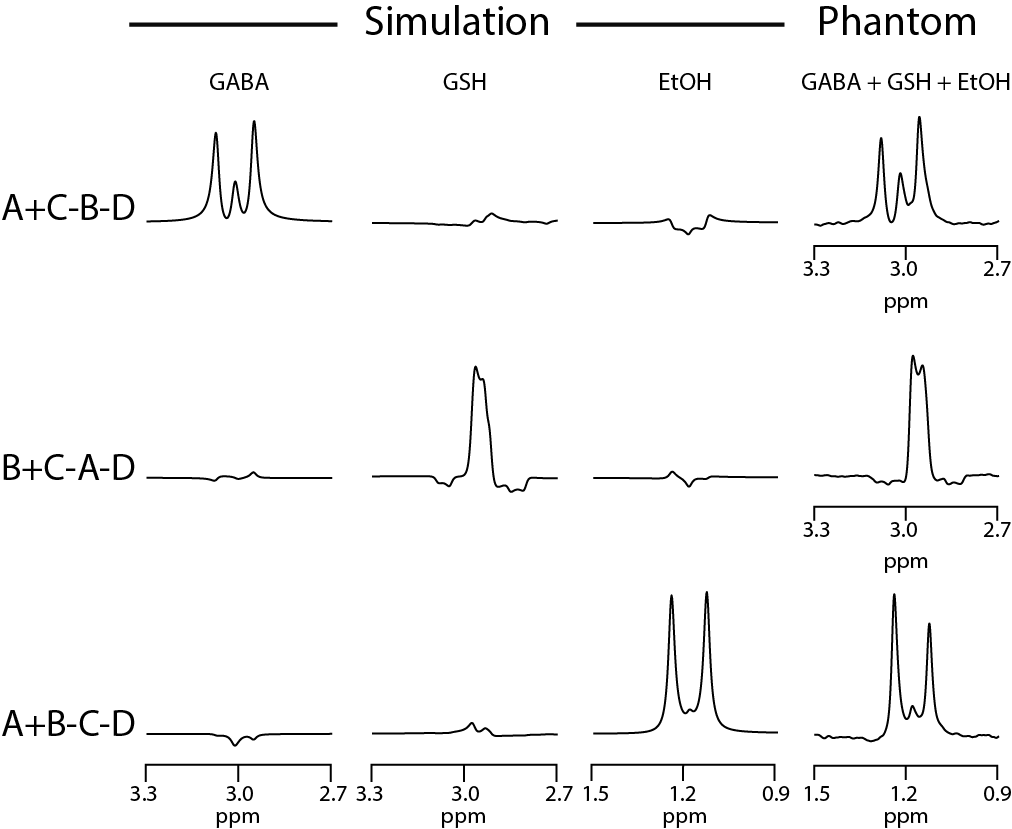
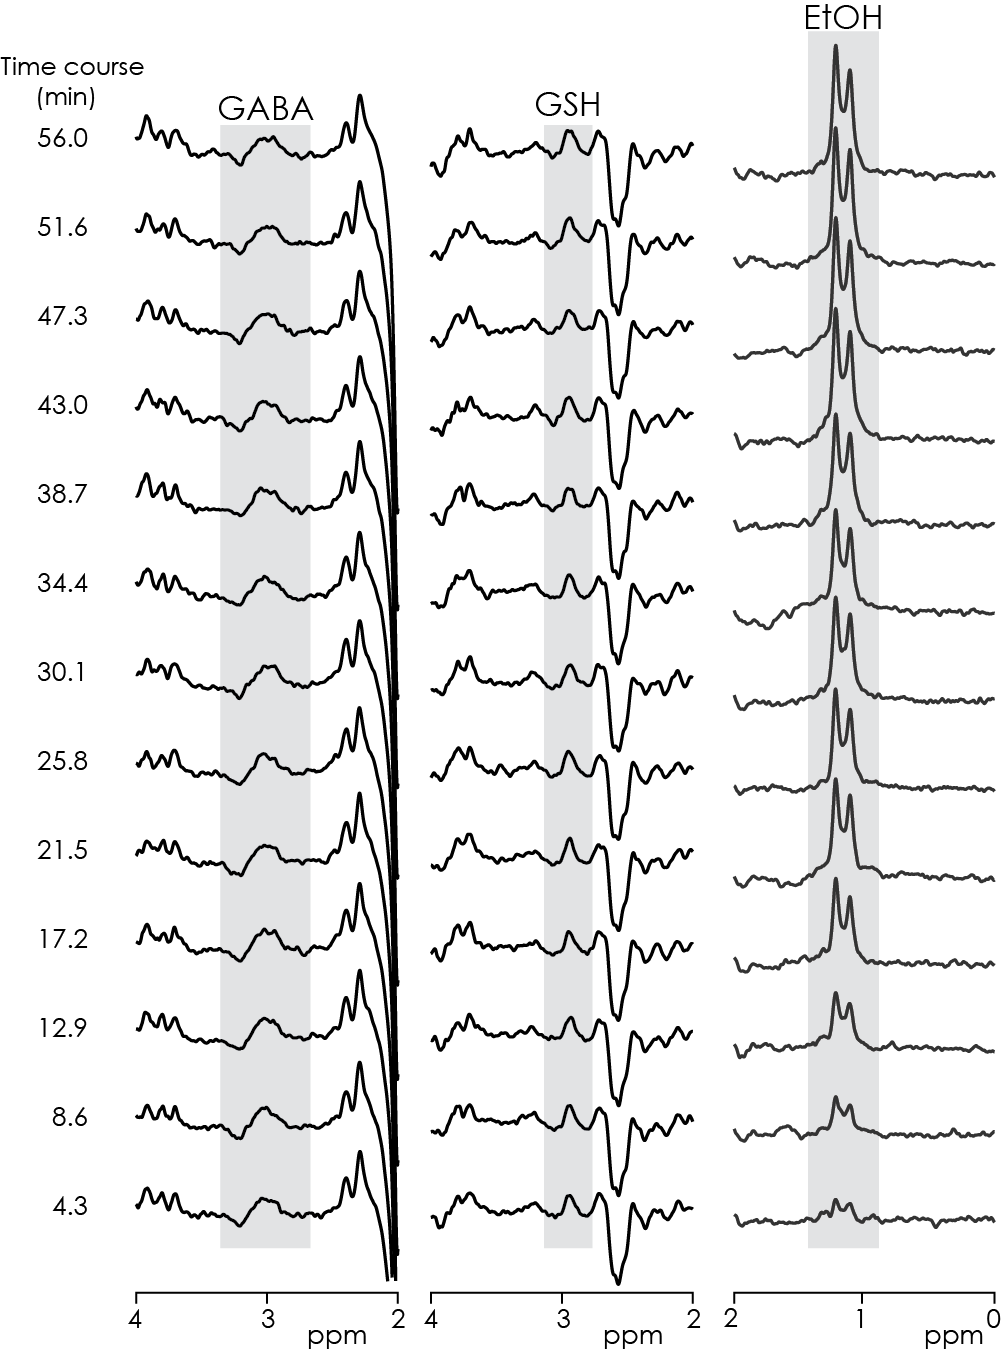
Density-matrix simulations of HERMES indicated successful detection of GABA-, GSH- and EtOH-edited spectra in a single experiment, with negligible levels of crosstalk (Figure 2). Phantom spectra showed strong agreement with simulations in terms of lineshape and demonstrated excellent separation of the signals from the multi-metabolite phantom. In vivo experiments indicated successful edited resolution of all three target metabolites, with clear edited signals at a temporal resolution of ~4 min (Figure 3). The EtOH signal at 1.18 ppm showed a clear increase throughout the ~1-h acquisition.Discussion
Simulation, phantom and in vivo experiments demonstrated successful simultaneous detection and excellent separation of GABA, GSH and EtOH using HERMES editing. In line with previous studies, EtOH levels clearly increased after consumption, while previously reported changes in GABA levels4 are not obviously apparent in this single-subject dataset. This HERMES editing scheme can be readily used for future studies of GABA-related inhibitory changes and GSH-related oxidative stress in the human brain, in the context of acute and chronic alcohol consumption.Conclusion
HERMES allows simultaneous detection of GABA, GSH and EtOH, providing a neurometabolic profile of the effects of alcohol on the human brain.Acknowledgements
This work was supported by NIH grants R01 EB023963, R01 EB016089 and P41015909.References
1. Saleh MG, Oeltzschner G, Chan KL, Puts NA, Mikkelsen M, Schär M, Harris AD, Edden RA. Simultaneous edited MRS of GABA and glutathione. Neuroimage 2016;15:576-582.
2. Chan KL, Saleh MG, Oeltzschner G, Barker PB, Edden RA. Simultaneous measurement of Aspartate, NAA, and NAAG using HERMES spectral editing at 3 Tesla. Neuroimage 2017;155:587-593.
3. Lobo IA, Harris RA. GABAA receptors and alcohol. Pharmacology Biochemistry and Behavior 2008;90:90-94.
4. Gomez R, Behar KL, Watzl J, Weinzimer SA, Gulanski B, Sanacora G, Koretski J, Guidone E, Jiang L, Petrakis IL. Intravenous ethanol infusion decreases human cortical γ-aminobutyric acid and N-acetylaspartate as measured with proton magnetic resonance spectroscopy at 4 tesla. Biol Psychiatry 2012;71:239-246.
5. Silveri MM. GABAergic contributions to alcohol responsivity during adolescence: Insights from preclinical and clinical studies. Pharmacology & therapeutics 2014;143:197-216.
6. Wu D, Cederbaum AI. Alcohol, oxidative stress, and free radical damage. Alcohol Research and Health 2003;27:277-284.
7. Chitty KM, Lagopoulos J, Hickie IB, Hermens DF. The impact of alcohol and tobacco use on in vivo glutathione in youth with bipolar disorder: an exploratory study. Journal of psychiatric research 2014;55:59-67.
8. Simpson R, Devenyi GA, Jezzard P, Hennessy TJ, Near J. Advanced processing and simulation of MRS data using the FID appliance (FID‐A)—An open source, MATLAB‐based toolkit. Magn Reson Med 2017;77:23-33.
9. Edden RA, Puts NA, Harris AD, Barker PB, Evans CJ. Gannet: A batch‐processing tool for the quantitative analysis of gamma‐aminobutyric acid–edited MR spectroscopy spectra. J Magn Reson Imaging 2014;40:1445-1452.
Figures