2225
Analyzing Big GABA: Comparison of Five Software Packages for GABA-Edited MRS1Russell H. Morgan Department of Radiology and Radiological Science, The Johns Hopkins University School of Medicine, Baltimore, MD, United States, 2F. M. Kirby Research Center for Functional Brain Imaging, Kennedy Krieger Institute, Baltimore, MD, United States, 3Imaging Institute, Cleveland Clinic Foundation, Cleveland, OH, United States, 4Radiology, Cleveland Clinic Lerner College of Medicine of Case Western Reserve University, Cleveland, OH, United States, 5Neuroimaging and Neurospectroscopy Laboratory, National Brain Research Centre, Gurgaon, India, 6The Florey Institute of Neuroscience and Mental Health, Melbourne, Australia, 7Centre for Human Brain Health and School of Psychology, University of Birmingham, Birmingham, United Kingdom, 8School of Health Sciences, Purdue University, West Lafayette, IN, United States, 9Department of Radiology and Imaging Sciences, Indiana University School of Medicine, Indianapolis, IN, United States, 10Canon Medical Research USA, Mayfield Village, OH, United States, 11Douglas Mental Health University Institute and Department of Psychiatry, McGill University, Montreal, QC, Canada
Synopsis
Given the number of software analysis packages available to the MRS community, surprisingly little attention has been paid to comparing the performance of each, particularly with regard to multi-site and multi-vendor datasets. Standardization of MRS methods will necessarily require that processing and quantification tools also produce comparable outcomes. This abstract describes a comparison of five widely used software packages analyzing multi-site edited MRS data to quantify in vivo GABA+/Cr levels. The overall agreement between the packages was moderate, with packages showing systematic site-to-site biases. Further analysis on a larger cohort of data will aid in determining the cause of these discrepancies.
Purpose
Several software analysis packages for the processing and quantification of MRS data are available to the community. They differ in their approach to signal fitting (e.g., time vs. frequency domain), use of prior knowledge (e.g., basis sets), degree of automation and whether or not they are open source. It is not clear how well measurement outcomes from these packages agree with each other. Here, this question was explored by analyzing GABA-edited MRS data from the multi-vendor, multi-site “Big GABA” dataset (1) in five popular MRS software packages to assess their level of agreement on quantified GABA measurements.Methods
Forty GABA-edited MEGA-PRESS (2) datasets acquired on two GE and two Philips 3T scanners (Big GABA site IDs: G4, G5, P3, P6) in the medial parietal lobe were used in the analysis. Common acquisition parameters were: TE/TR = 68/2000 ms; 320 averages; ON/OFF = 1.9/7.46 ppm; 3 × 3 × 3 cm3 voxel. Further site-specific acquisition details can be found in (1).
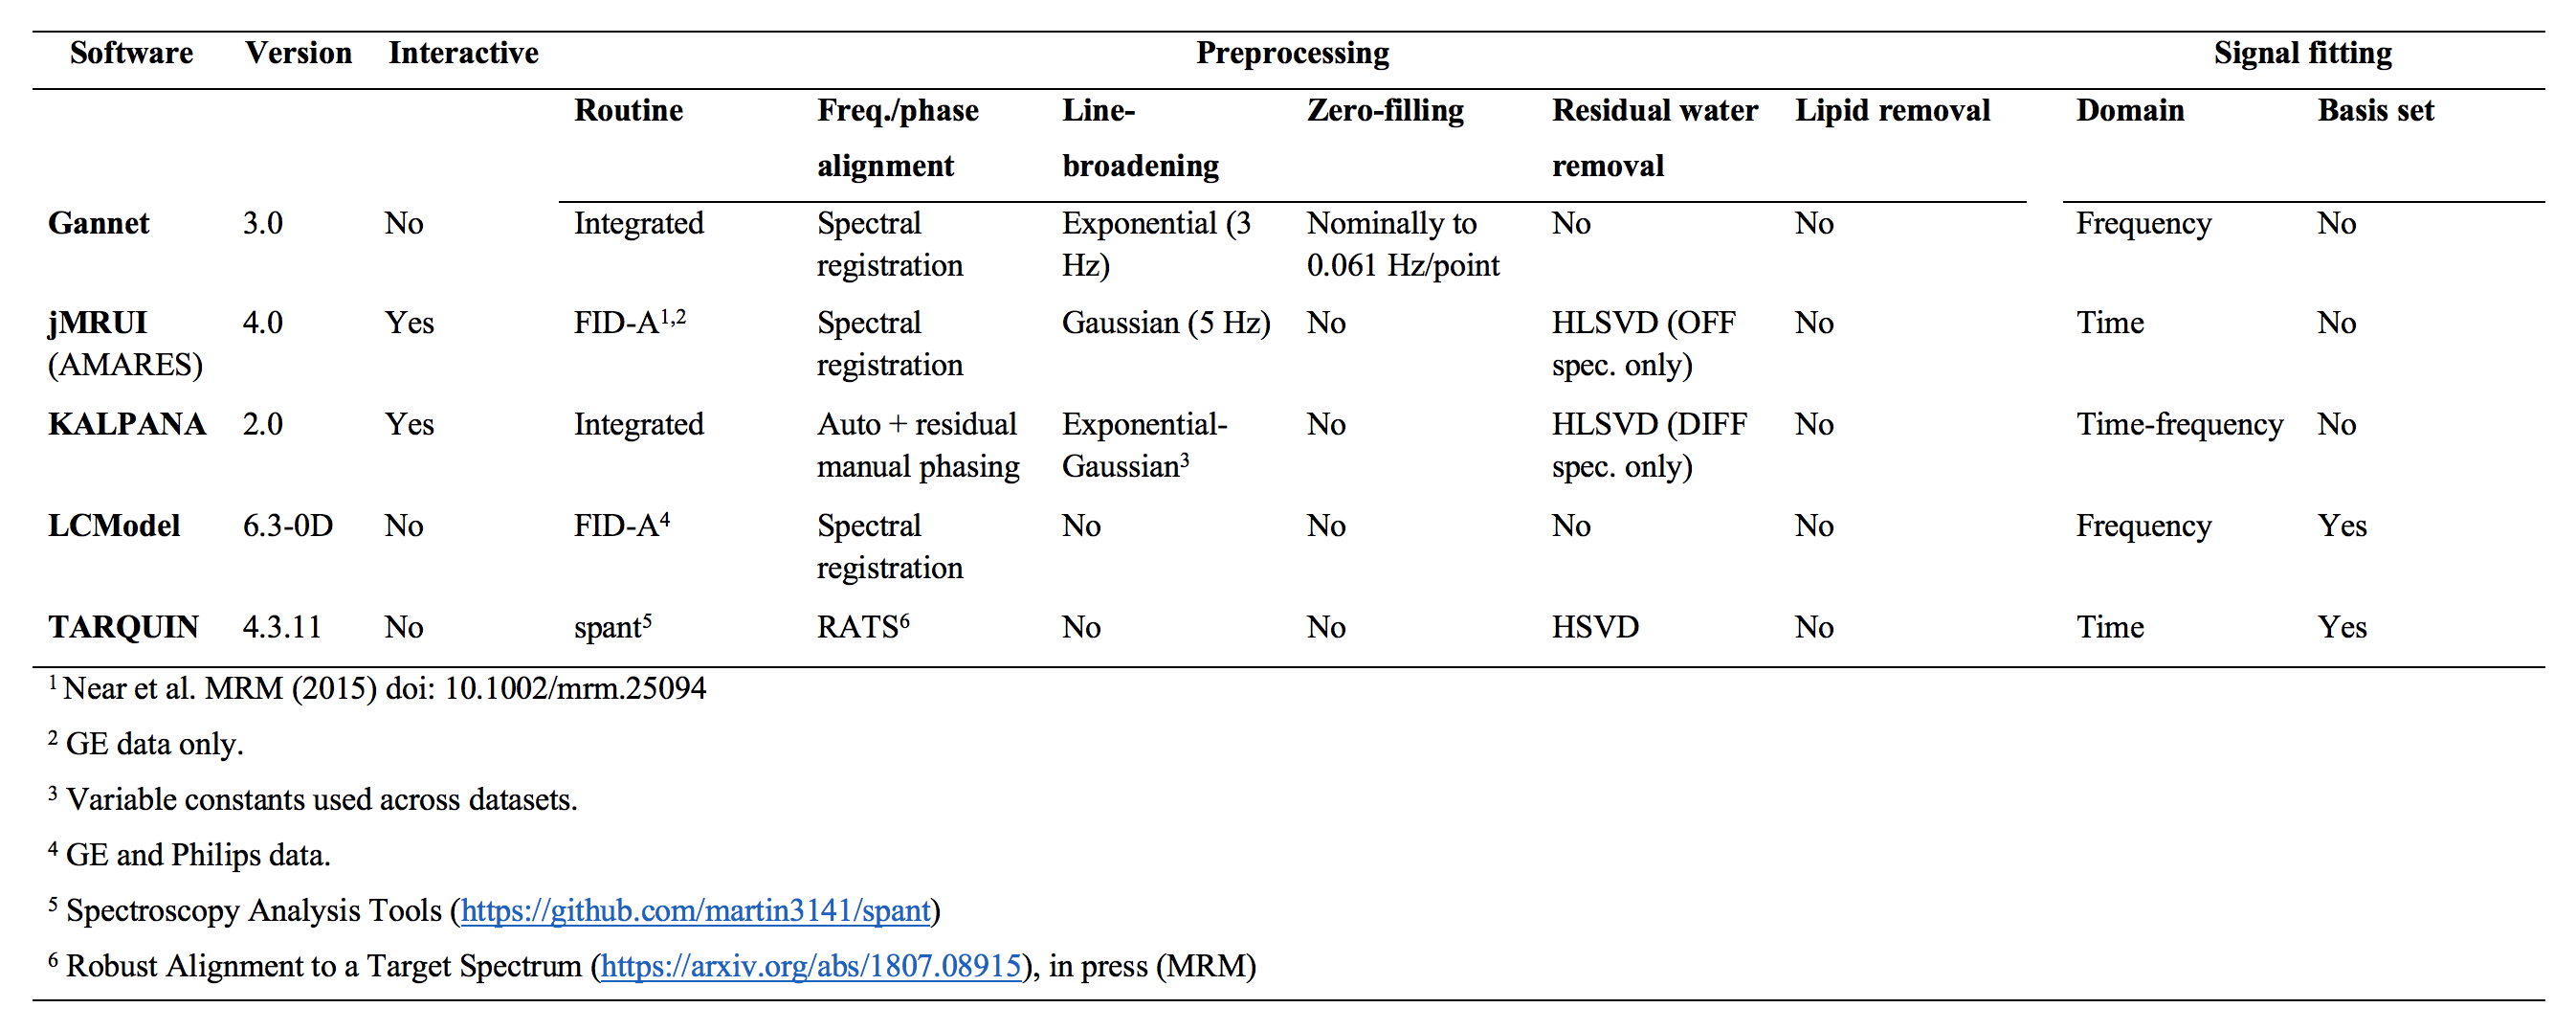
The five selected software packages were: Gannet (3), jMRUI (AMARES) (4,5), KALPANA (6), LCModel (7) and TARQUIN (8). The pipelines followed in each package are summarized in Fig. 1. Since jMRUI and LCModel lack comprehensive integrated preprocessing routines to handle all types of data formats and/or format versions, FID-A (9) was used for data loading, coil combination, spectral registration (10), averaging and subtraction of ON/OFF subspectra and file conversion to a compatible text file for signal fitting in jMRUI and LCModel. The data were analyzed in each package independently by a separate co-author.
GABA was quantified as a metabolite ratio; i.e., the GABA+ signal in the difference spectrum relative to the total Cr signal in the OFF spectrum. In Gannet, jMRUI and KALPANA, only the 3.0 ppm GABA+ and Cr signals were fitted. In LCModel and TARQUIN, basis sets were used, where in LCModel all the GABA (and the 3.0 ppm co-edited MM) signals were fitted but in TARQUIN only the 3.0 ppm GABA+ signal was fitted (with two Gaussians). In both packages, all Cr resonances were fitted in the OFF spectrum. The amplitudes of the 3.0 ppm GABA and MM signals were fixed to a 1:1 ratio in LCModel. Measurements are denoted GABA+/Cr.
Within-site and cohort-wide coefficients of variation (CVs) were calculated for the measurements from each software package. Pairwise Pearson correlation coefficients (r) and an intraclass correlation coefficient (ICC; two-way mixed-effects model of consistency for single measures) were also calculated to respectively test the linear association and overall consistency of the measurements across the packages. p-values were corrected for multiple comparisons using the Holm-Bonferroni method (pholm).
Results
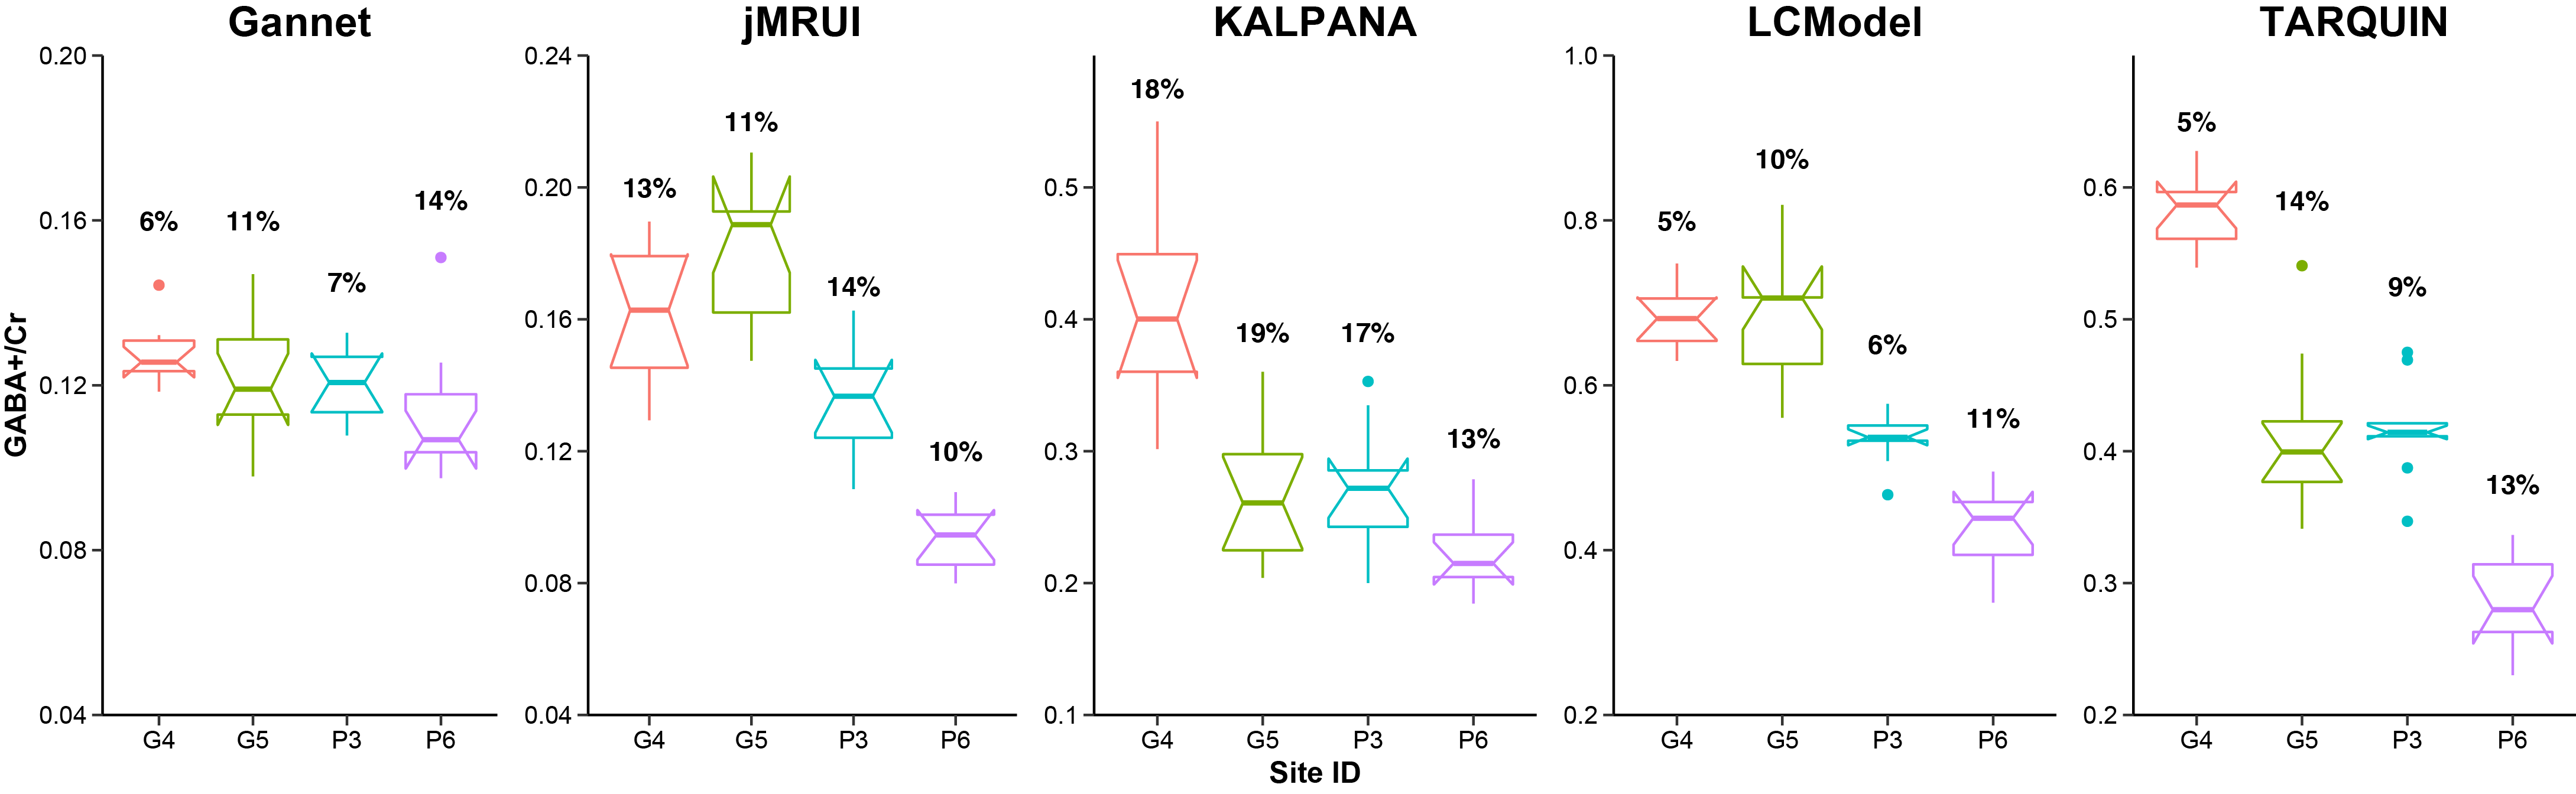
Fig. 2 displays by-software–by-site boxplots of the GABA+/Cr measurements. The cohort-wide CVs were: Gannet, 10.5%; jMRUI, 26.0%; KALPANA, 29.6%; LCModel, 20.2%; TARQUIN, 27.1%. The comparable by-site CVs for Gannet, LCModel and TARQUIN (Fig. 2) suggest that these packages performed similarly within-site.
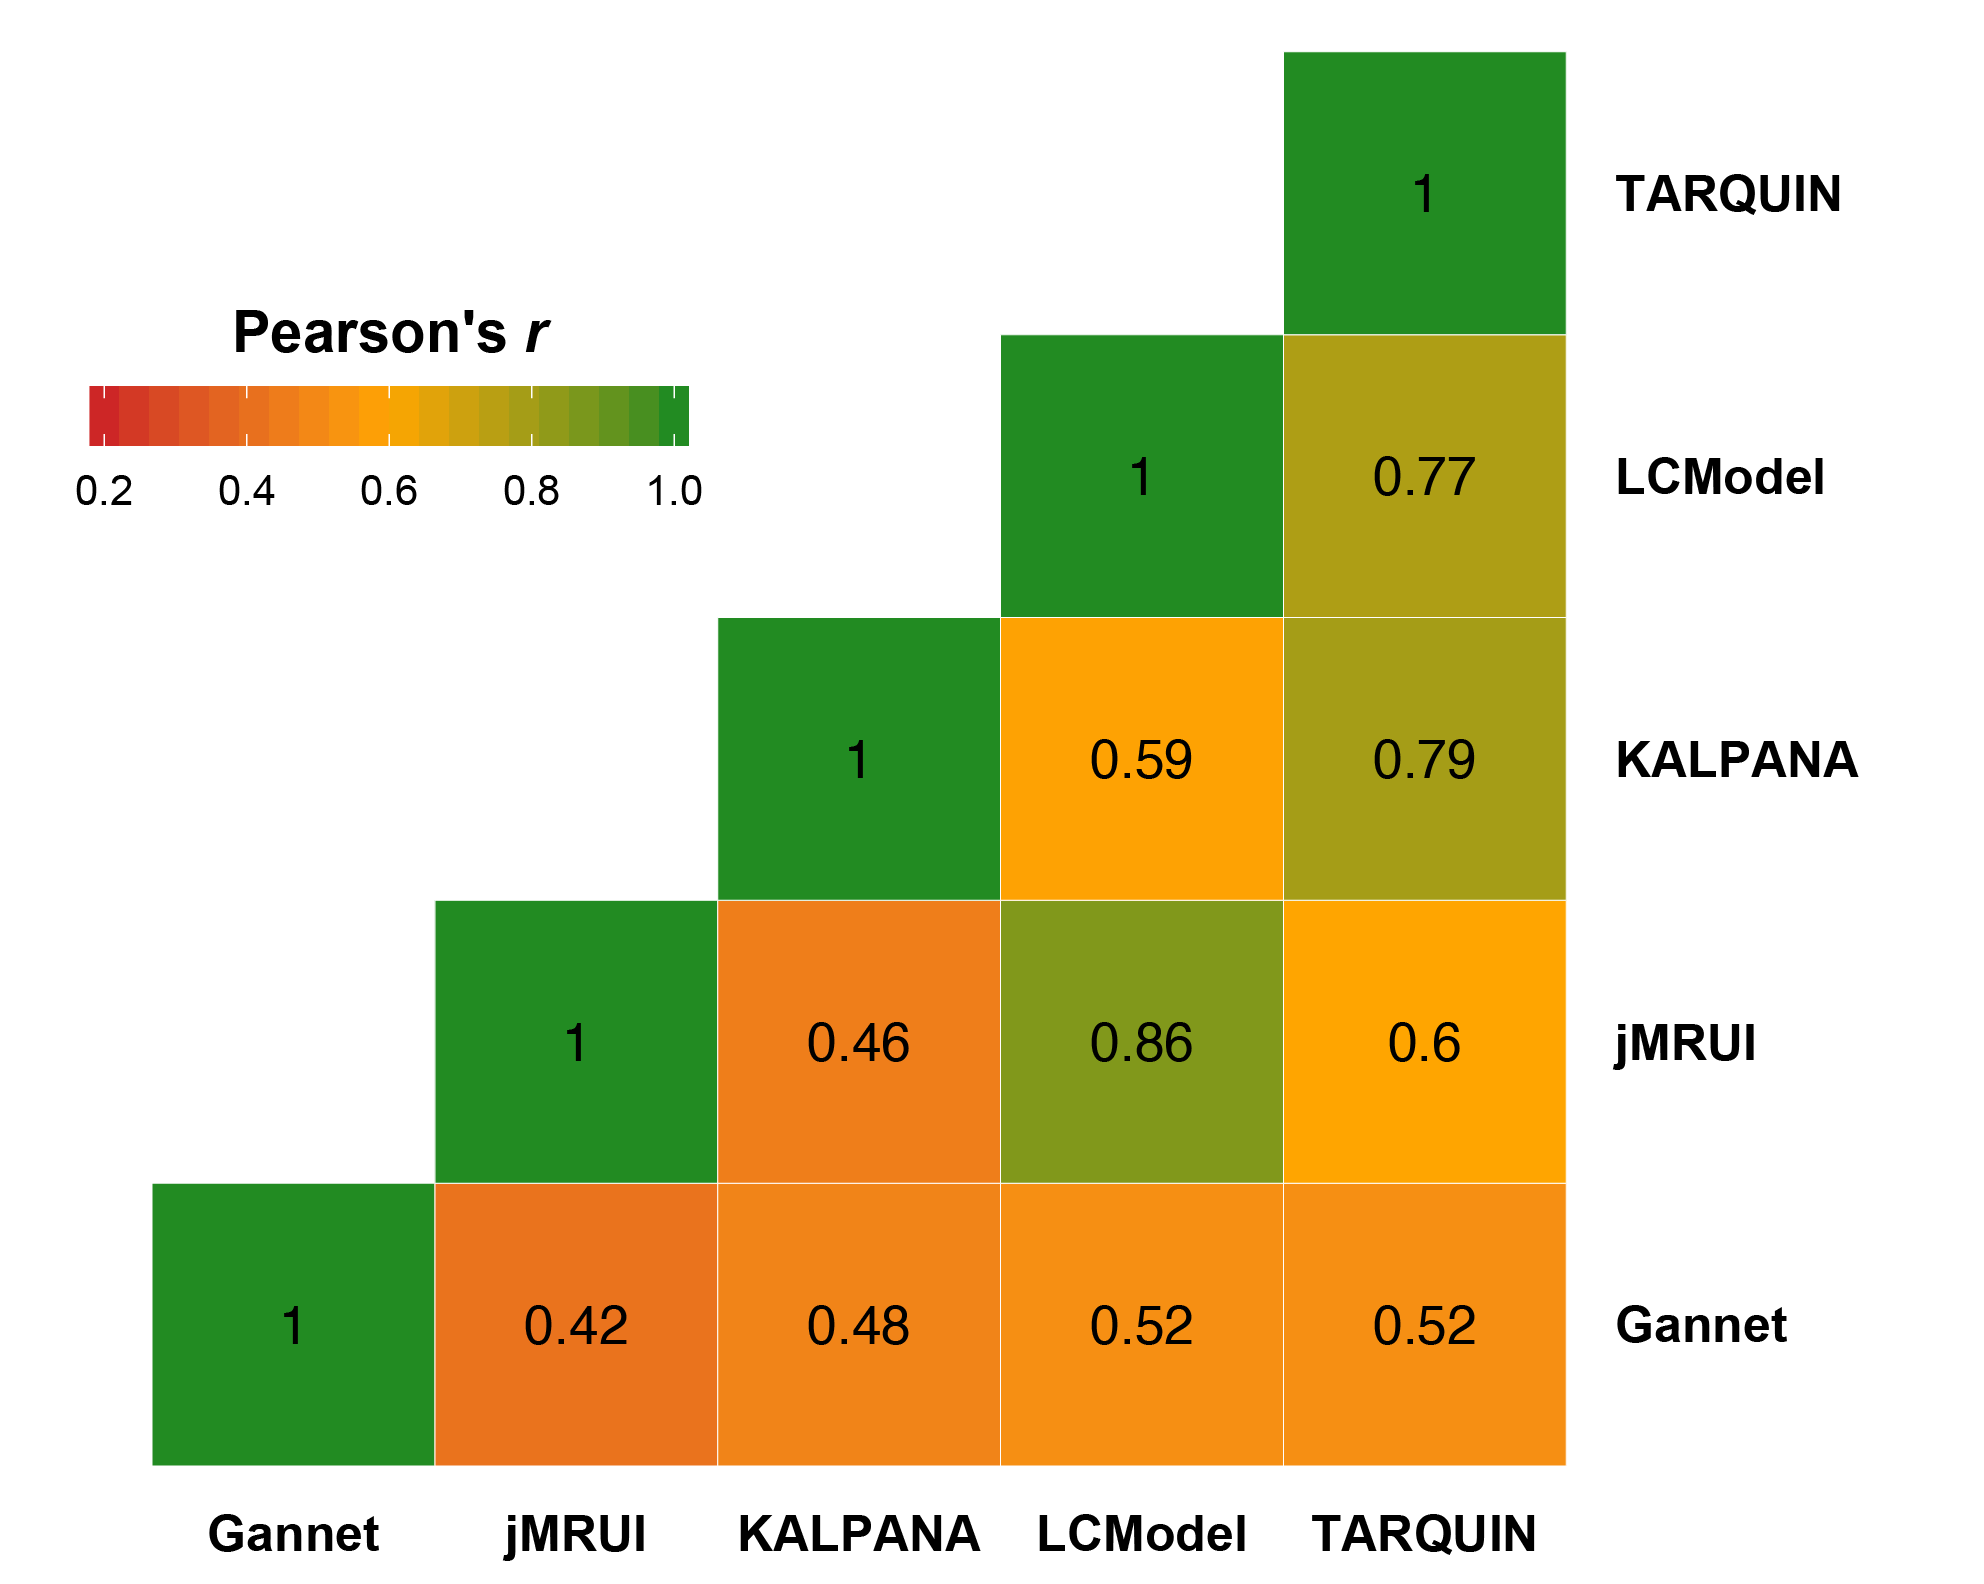
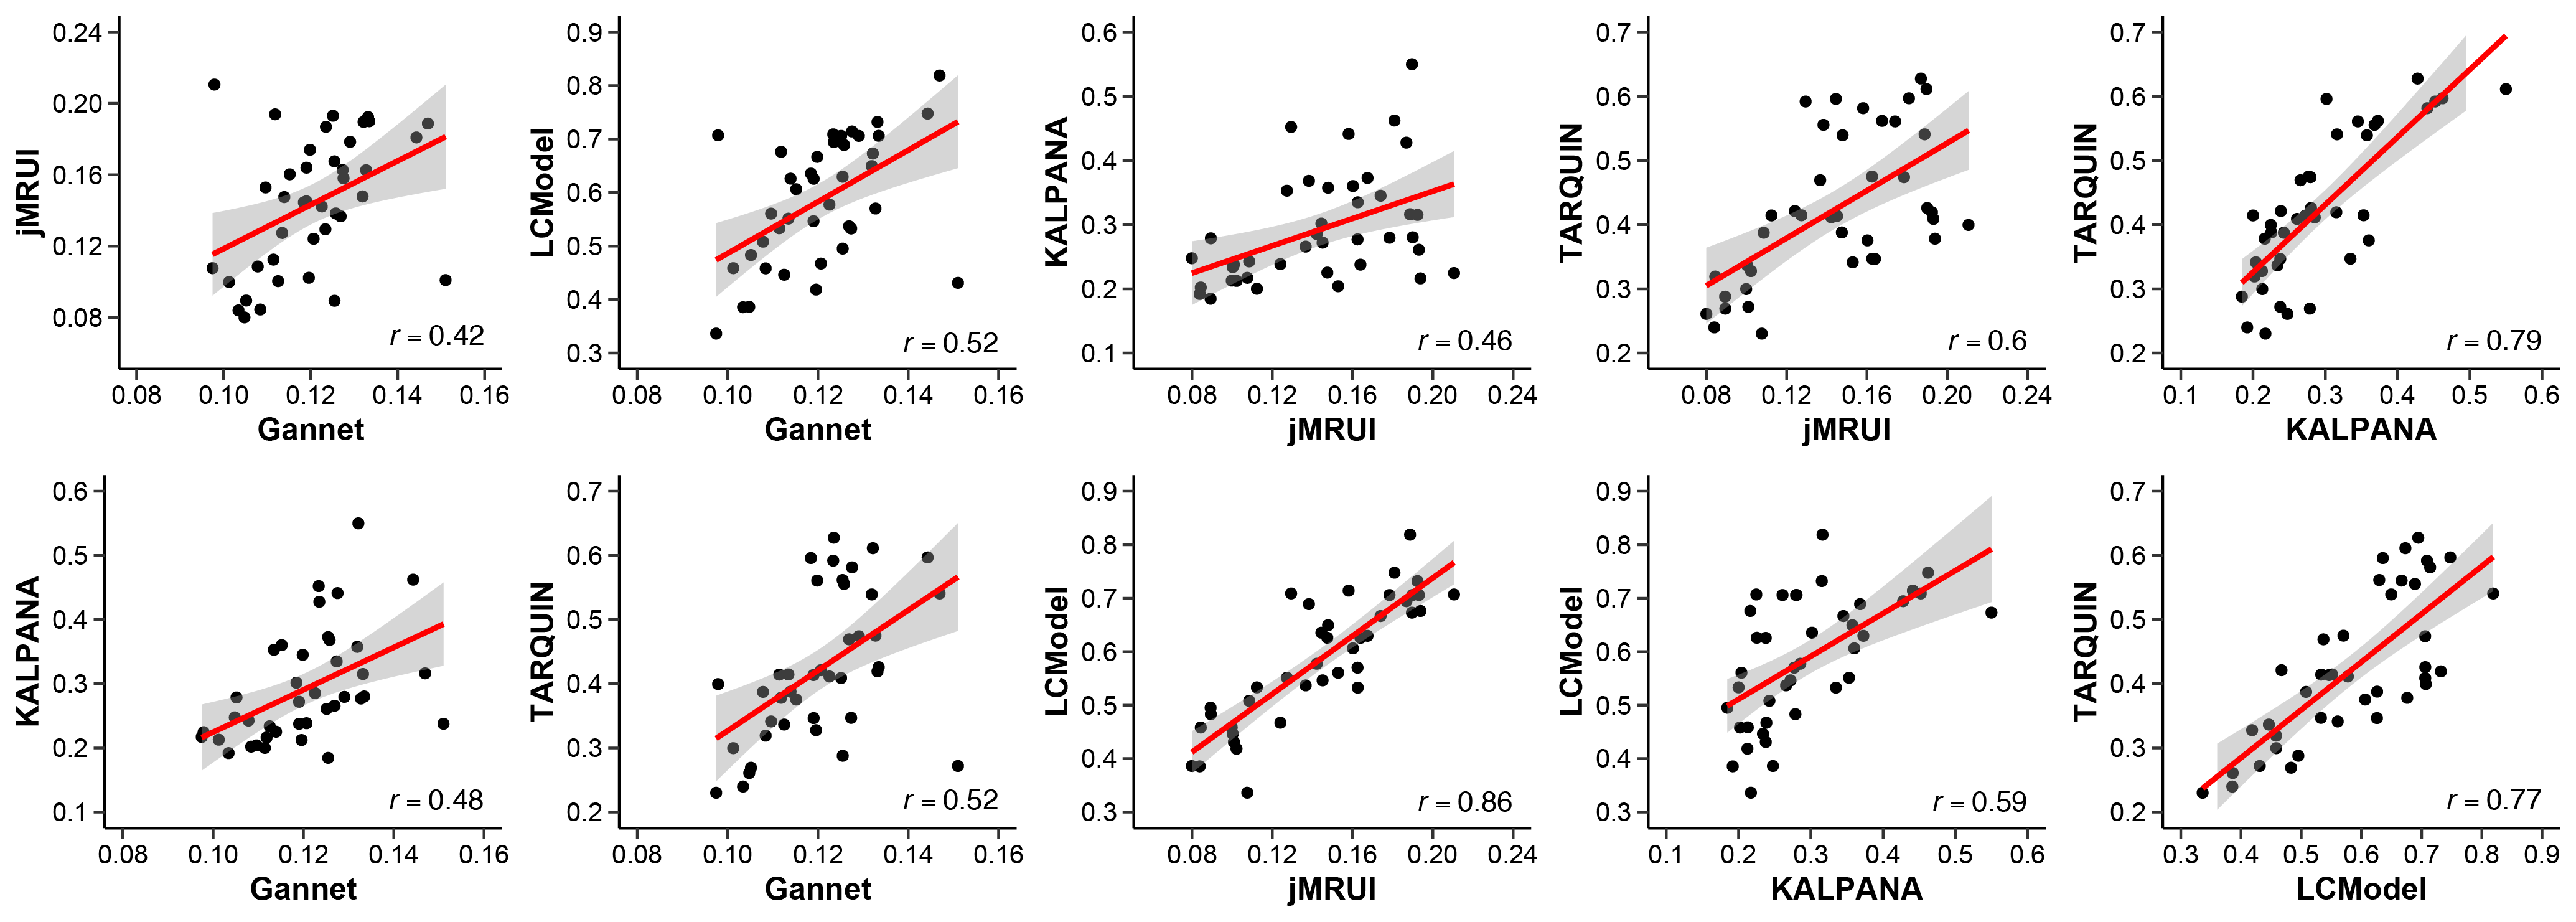
The pairwise correlations are displayed as a correlation matrix in Fig. 3. Overall, there was moderate agreement between the packages, with the highest correlation being between jMRUI and LCModel (r = 0.86, pholm < 0.001) and the lowest being between Gannet and jMRUI (r = 0.42, pholm = 0.01). The ICC was 0.48. The scatterplots in Fig. 4 show the linear relationships of GABA+/Cr measurements between each of the packages.
Discussion
The moderate agreement found between the five packages points to a meaningful source of bias that will have implications on measurement outcomes reported in the wider literature. That said, some packages did show a strong association, which reflects similar approaches (e.g., the same preprocessing steps for jMRUI and LCModel), or a basis-set-driven approach to signal fitting for LCModel and TARQUIN. Gannet appeared to stand out from the rest in that the pairwise correlations were on the whole the lowest (~0.4–0.5), due in part to the absence of substantial by-site bias in this package. It is possible that diversity in pre/postprocessing steps and signal fitting routines contributes significantly to the degree of disagreement in the resultant outcomes. This work represents a critical first step towards both understanding and correcting the discrepancies between the various available approaches to GABA quantification.Conclusion
Five MRS software packages were assessed on their level of agreement on measurement outcomes using multi-site in vivo GABA-edited MRS data. GABA+/Cr levels as quantified by each package correlated variably, with some packages only showing a moderate association. Additional analysis using data from more sites and vendors is needed in order to determine the reasons behind the variable level of agreement.Acknowledgements
This work was supported by NIH grants R01 EB016089, R01 EB023963 and P41 EB015909. PKM thanks the Ministry of Information Technology (DeitY/R&D/TDC/13(5)/2013 dated 20/12/2013) for funding and TATA Innovation Award for financial support. The GABA-edited MEGA-PRESS data is available online on the NITRC portal under the “Big GABA” repository (https://www.nitrc.org/projects/biggaba/).References
1. Mikkelsen M, Barker PB, Bhattacharyya PK, et al. Big GABA: Edited MR spectroscopy at 24 research sites. Neuroimage 2017;159:32–45. doi: 10.1016/j.neuroimage.2017.07.021.
2. Mescher M, Merkle H, Kirsch J, Garwood M, Gruetter R. Simultaneous in vivo spectral editing and water suppression. NMR Biomed. 1998;11:266–272. doi: 10.1002/(SICI)1099-1492(199810)11:6<266::AID-NBM530>3.0.CO;2-J.
3. Edden RAE, Puts NAJ, Harris AD, Barker PB, Evans CJ. Gannet: A batch-processing tool for the quantitative analysis of gamma-aminobutyric acid-edited MR spectroscopy spectra. J. Magn. Reson. Imaging 2014;40:1445–1452. doi: 10.1002/jmri.24478.
4. Stefan D, Cesare F Di, Andrasescu A, et al. Quantitation of magnetic resonance spectroscopy signals: the jMRUI software package. Meas. Sci. Technol. 2009;20:104035. doi: 10.1088/0957-0233/20/10/104035.
5. Vanhamme L, van den Boogaart A, Van Huffel S. Improved Method for Accurate and Efficient Quantification of MRS Data with Use of Prior Knowledge. J. Magn. Reson. 1997;129:35–43. doi: 10.1006/jmre.1997.1244.
6. Mandal PK, Saharan S, Tripathi M, Murari G. Brain Glutathione Levels – A Novel Biomarker for Mild Cognitive Impairment and Alzheimer’s Disease. Biol. Psychiatry 2015;78:702–710. doi: 10.1016/j.biopsych.2015.04.005.
7. Provencher SW. Estimation of metabolite concentrations from localized in vivo proton NMR spectra. Magn. Reson. Med. 1993;30:672–679. doi: 10.1002/mrm.1910300604.
8. Wilson M, Reynolds G, Kauppinen RA, Arvanitis TN, Peet AC. A constrained least-squares approach to the automated quantitation of in vivo 1H magnetic resonance spectroscopy data. Magn. Reson. Med. 2011;65:1–12. doi: 10.1002/mrm.22579.
9. Simpson R, Devenyi GA, Jezzard P, Hennessy TJ, Near J. Advanced processing and simulation of MRS data using the FID appliance (FID-A)-An open source, MATLAB-based toolkit. Magn. Reson. Med. 2017;77:23–33. doi: 10.1002/mrm.26091.
10. Near J, Edden R, Evans CJ, Paquin R, Harris A, Jezzard P. Frequency and phase drift correction of magnetic resonance spectroscopy data by spectral registration in the time domain. Magn. Reson. Med. 2015;73:44–50. doi: 10.1002/mrm.25094.
Figures