2221
Cardiotoxic effects of radiation therapy detected by MRI in genetically modified rats1Medical College of Wisconsin, Milwaukee, WI, United States
Synopsis
In this study, we present preliminary results detecting radiation therapy (RT) effects on cardiac function in pre-clinical models using high-field 9.4T MRI. Salt-sensitive (SS) and Brown-Norway (BN) rats were selectively bred to produce SS.BN3 consomic rats, which are genetically identical to SS rats except for chromosome 3 which is inherited from the BN rat. Adult female SS and SS.BN3 rats (both control and RT animals) were scanned to acquire cine and tagging images, from which different cardiovascular parameters were measured. The results show differences in heart mechanics and ventricular remodeling between the two rat strains in response to RT, despite maintained global cardiac function.
INTRODUCTION
Cardiovascular disease and risk factors are common comorbidities in patients with breast cancer. Compounding the problem, cancer treatment with doxorubicin and radiation therapy (RT) are cardiotoxic. The impact of radiation on the heart in the management of cancer is not well understood and of increasing importance as cancer patients are living longer due to advances in RT delivery and systemic therapy. Despite recent studies showing deleterious effects of chemotherapy treatment on the heart, this subject has not been well studied in RT, especially the influence of genetic differences on RT-induced cardiotoxicity. In this study, we present preliminary results identifying RT effects on cardiac function in rats that have different responses to RT using high-field 9.4T MRI.METHODS
Salt-sensitive (SS) and Brown Norway (BN) rats were selectively bred to produce SS.BN3 consomic rats, which are genetically identical to SS rats except for chromosome 3 which is inherited from the BN rat. The SS.BN3 rats have previously been shown to exhibit different vascular dynamics versus SS. To examine cardiotoxicity, adult female rats (two SS and two SS.BN3) received image-guided localized whole-heart RT to 24 Gy using 3 equally-weighted fields. The four RT rats, plus two controls, were scanned on a 9.4T Bruker Biospec MRI scanner with 30-cm bore diameter and equipped with 4-element surface coil. Both long-axis (LAX) and short-axis (SAX) cine and tagged MRI images were acquired in all animals using a fast low angle shot (FLASH) pulse sequence with both cardiac and respiratory gating.
The cine imaging parameters were as follows: TR = 7ms, TE = 2.1ms, flip angle = 15⁰, matrix = 176x176, FOV = 40x40 mm2, slice thickness = 1mm, acquisition bandwidth = 526 Hz/pixel , #averages = 2, #cardiac phases = 20, and scan time ~2:30 minutes, depending on heart rate and breathing pattern. The tagging imaging parameters were as follows: TR = 7ms, TE = 2.5ms, flip angle = 15⁰, matrix = 256x256, FOV = 40x40 mm2, slice thickness = 1mm, acquisition bandwidth = 375 Hz/pixel , #averages = 3, #cardiac phases = 20, and scan time ~5 minutes, depending on heart rate and breathing pattern.
The cine images were analyzed using Circle cvi42 software to measure ejection fraction (EF), end-diastolic volume (EDV), myocardial mass, and wall motion. Measurements in the RT rats were represented as mean ± standard deviation (SD). The tagged images were analyzed using harmonic-phase (HARP) software to measure longitudinal (Ell) and circumferential (Ecc) myocardial strains in a four-chamber LAX and mid-basal SAX slices, respectively. Strain was measured at different locations in the imaged slice, and measurements were represented as mean±SD.
RESULTS
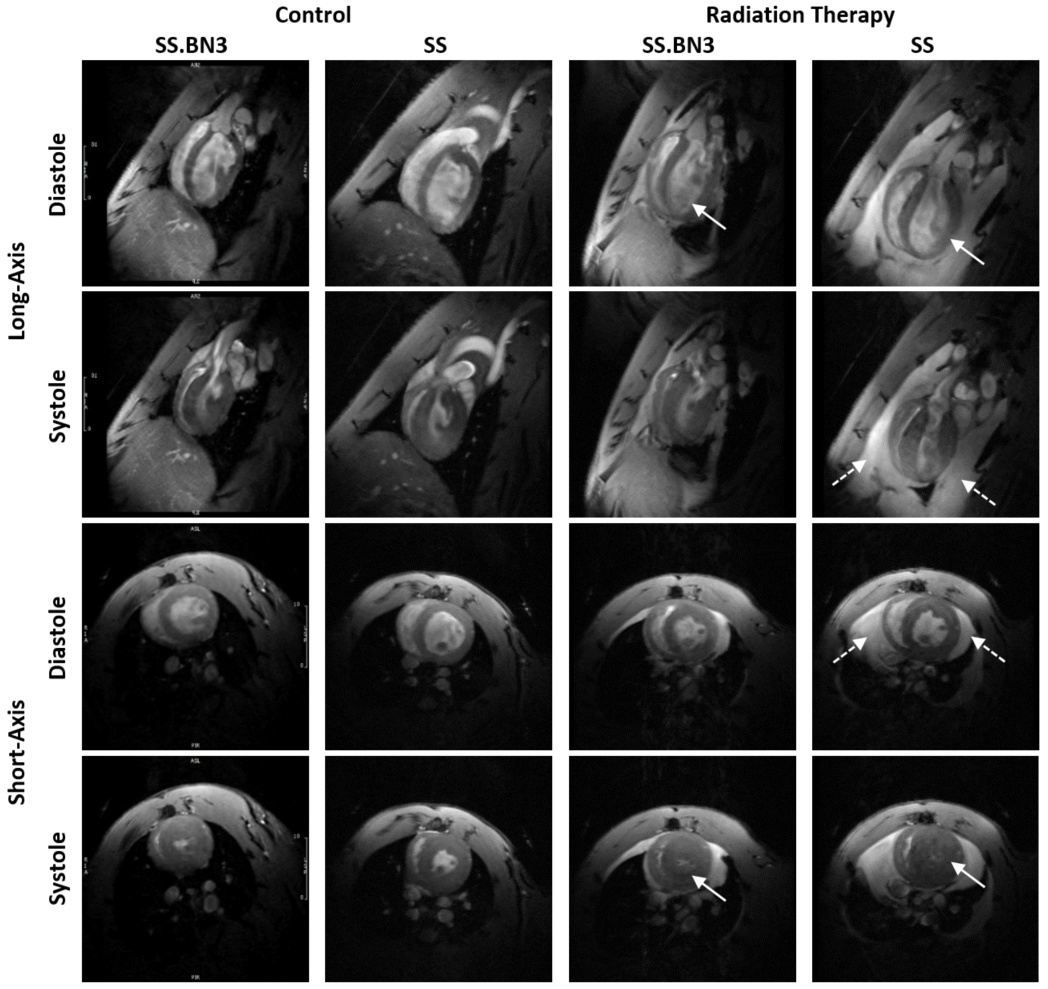
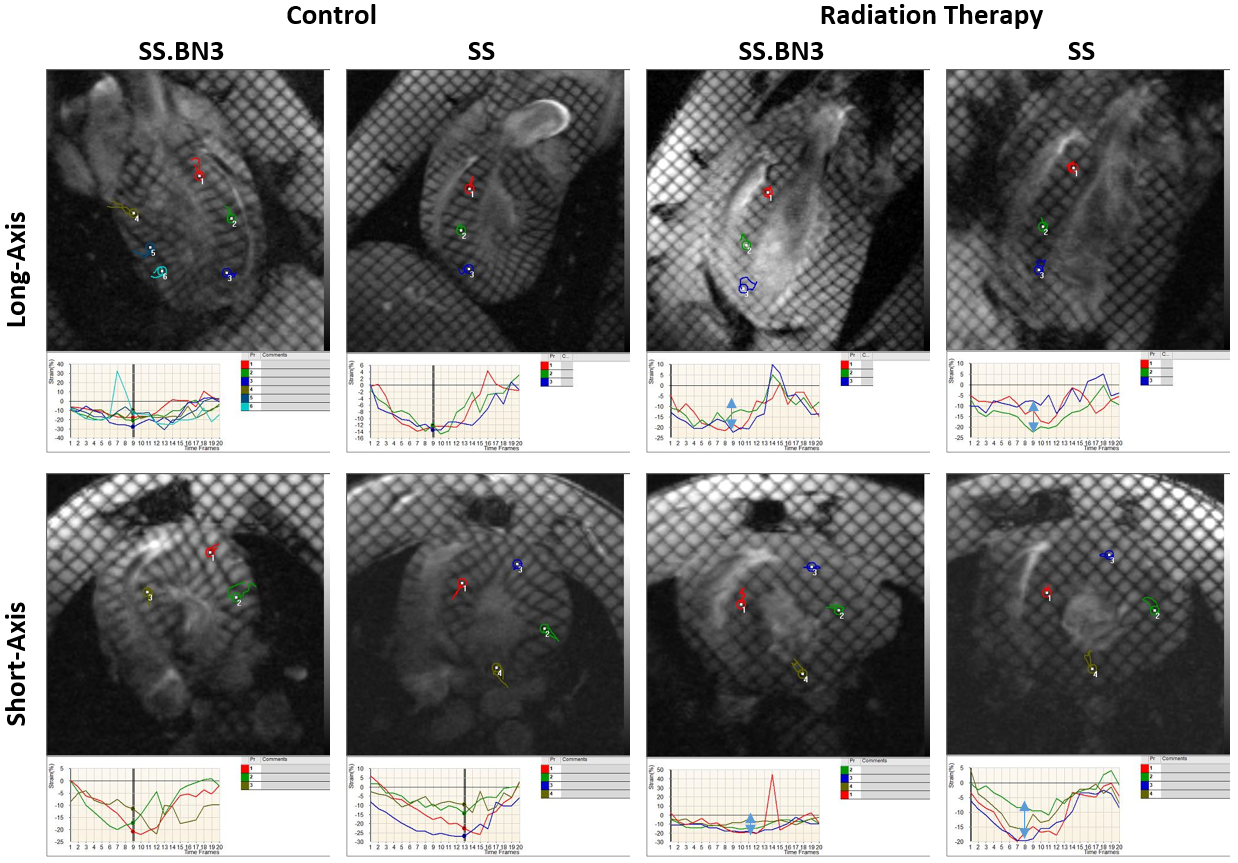
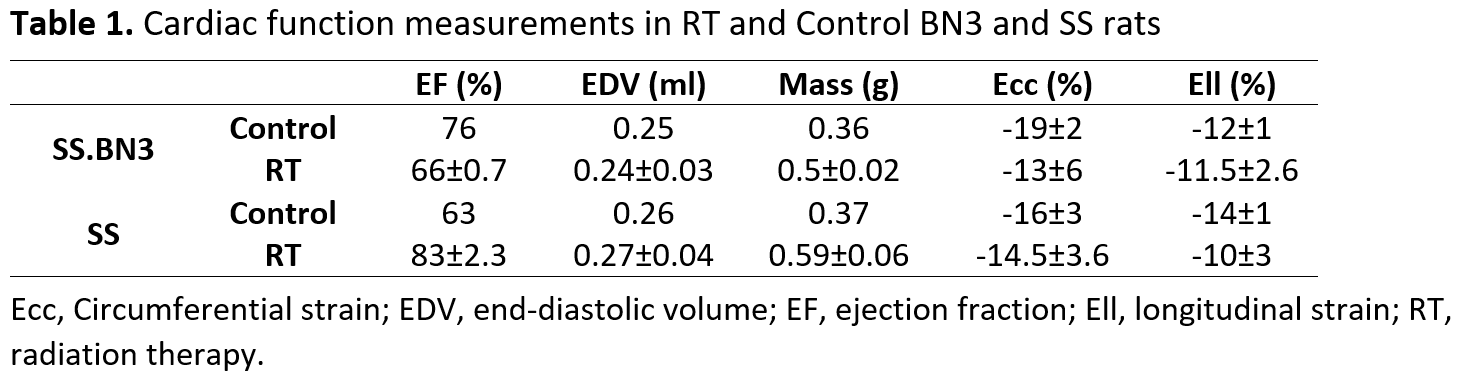
Figure 1 shows both end-diastolic (ED) and end-systolic (ES) cine images of the SS.BN3 and SS (both RT and control) rats. Figure 2 shows tagged images and strain curves in both control and RT rats of both genotypes. Table 1 summarizes cardiovascular measurements in the studied rats. Global cardiac function was normal in all rats, with increased myocardial mass in all RT rats (≥0.5g) compared to controls (0.36-0.37g), and increased EF in SS RT rats (83±2.3%) compared to the SS.BN3 RT rats (66±0.7%). Ell measurements were similar in both RT (-11.5±2.6%) and control (-12±1%) SS.BN3 rats; however, Ell was noticeably depressed in the SS RT rats (-10±3%) compared to the SS controls (-14±1%). Ecc was depressed in both SS.BN3 (-13±6%) and SS (-14.5±3.6%) RT rats compared to the controls (-19±2% and -16±3%, respectively).DISCUSSION and CONCLUSION
These preliminary results suggest that EF may not be sensitive enough to detect RT cardiotoxic effects. This can be explained by the undergoing ventricular remodeling to maintain EF, as illustrated by the differences in ventricular shape geometry and myocardial hypertrophy between the RT and control animals (Figure 1; solid arrows). MRI also detected large epicardial and pleural effusions in SS RT rats (Figure 1; dotted arrows). Strain analysis illustrated differences in heart mechanics between SS.BN3 and SS rats, as shown by reduction in both Ell and Ecc strain components in the SS RT rats, compared to reduction in Ecc only in the SS.BN3 RT rats. Also, there were differences in the degree of Ell and Ecc reduction between the two rat types. These differences could be attributed to the role of heritable factors in determining radiosensitivity.
In conclusion, although thorough statistical analysis was not feasible in this study due to small number of studied animals (n=6), the illustrated differences in cardiac function between SS and SS.BN3 rats in response to RT have the potential to allow for better understanding of RT toxicity profile in cancer.
Acknowledgements
N/AReferences
1. Filster et al, Breats Cancer Research Treat, 165:53-64
2. Osman et al, Magn Reson Med, 42:1048-1060
3. Ibrahim, Heart Mechanics MRI. CRC Press, 2017
4. Said et al, Ann Onc, 25:276-282
Figures