2219
Quantitative High-Resolution Myocardial First-Pass Perfusion Imaging of CO2-Induced Vasodilation in Rat1Institute for Biomedical Engineering, ETH & University of Zurich, Zurich, Switzerland
Synopsis
Respiratory-induced acidosis is an emerging alternative to induce increased coronary blood flow necessary to facilitate the quantification of the stress myocardial blood flow and hence myocardial perfusion reserve. The aim of this study was to quantify the pharmacokinetic effect of the CO2 gas challenge on myocardial perfusion in rats using a high-resolution first pass perfusion CMR.
Introduction
Myocardial blood flow and its change during hyperemia are critical measures of cardiac function1. Current protocols to induce hyperemia are largely based on adenosine infusion2 or one of its analogues. Pharmacologically induced stress, however, has several side-effects including the very short life time of adenosine. Elevating the partial pressure of CO2 has been shown to increase cerebral and myocardial blood flow3, suggesting that it may be a suitable alternative to pharmacological stress or exercise for myocardial perfusion imaging4,5. The advantages of using gas challenge with CO2 as a coronary vasodilator are especially relevant for cardiac perfusion studies in rodent models of heart disease, where multiple injections of stress/contrast agent might be difficult to achieve6.Methods
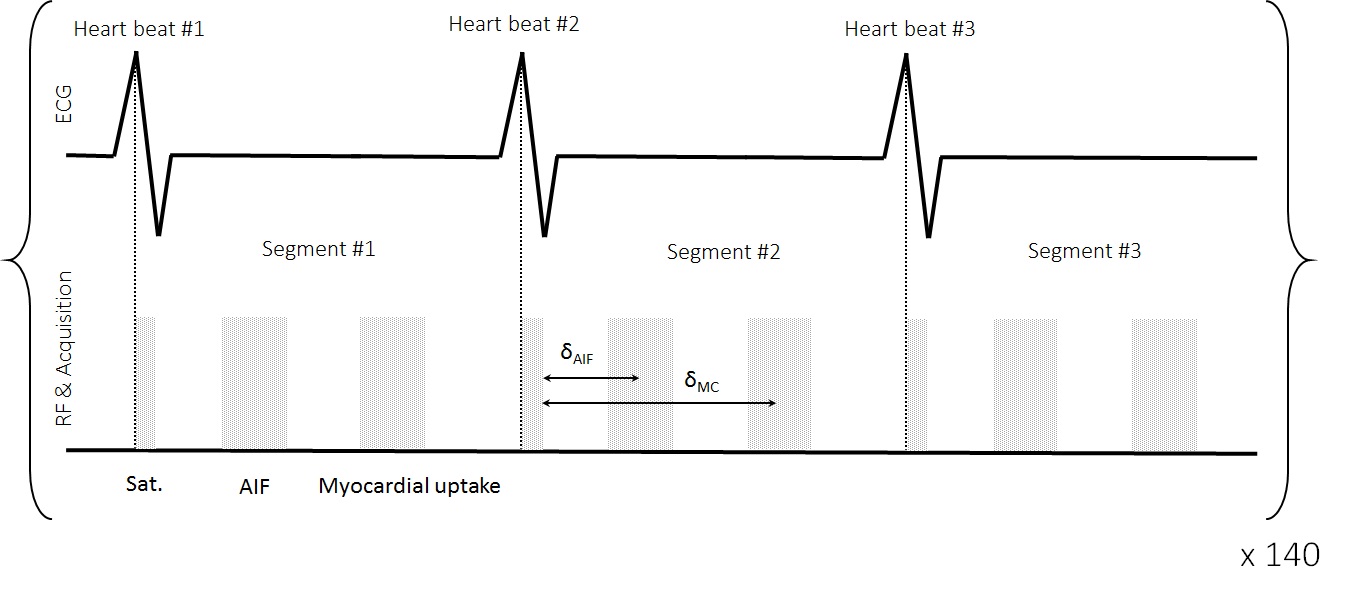
Data acquisition: All MR experiments were recorded with a 9.4 T small animal MRI scanner (Bruker BioSpec, Ettlingen, Germany). A dual-contrast, saturation-recovery gradient-echo sequence with a Cartesian read-out7 accelerated using sheared-grid undersampling with subsequent principal component analysis along time (k-t PCA)8, with a net undersampling factor of R=5.8 was used. Two adjacent short-axis slices were acquired, segmented over three consecutive heart beats. Imaging parameters were as follows: field-of-view (FOV) = 60×40 mm2, in-plane resolution 0.28×0.28 mm2, echo time/repetition time (TE/TR) = 0.98/2.73 ms, partial echo: 80%, acquisition matrix = 36×112, reconstruction matrix = 210×140, slice thickness = 2 mm, number of dynamics = 140.
Animal handling: All animal experiments were performed with adherence to the Swiss Federal Act on Animal Protection and were approved by the Cantonal Veterinary Office Zurich. A total of 11 female Wistar rats (body weight 270-300 g) were studied. Anaesthesia was induced/maintained using 4%/1.75–2.00% Isoflurane in a mixture of 20% O2 + 80% air. A contrast agent bolus (Gadovist Bayer AG, Switzerland), was administered using a syringe pump (Harvard PHD 2000, Harvard Apparatus, Holliston, Massachusetts, US). The injection speed was 4 ml/min and the injection dose was 0.2 mM/kg.
Gas challenge: Hyperemia was induced by increasing the partial CO2 pressure from 40 ± 3 mmHg to 57 ±6 mmHg using a 4 min respiration interval with a mixture of 10% CO2 + 20% O2 + 70% N2 (PanGas, Dagmersellen, Switzerland). A transcutaneous gas monitor (TCM4 Tina, Radiometric Copenhagen, Denmark) mounted on an animal flank was used to monitor partial CO2 pressure.
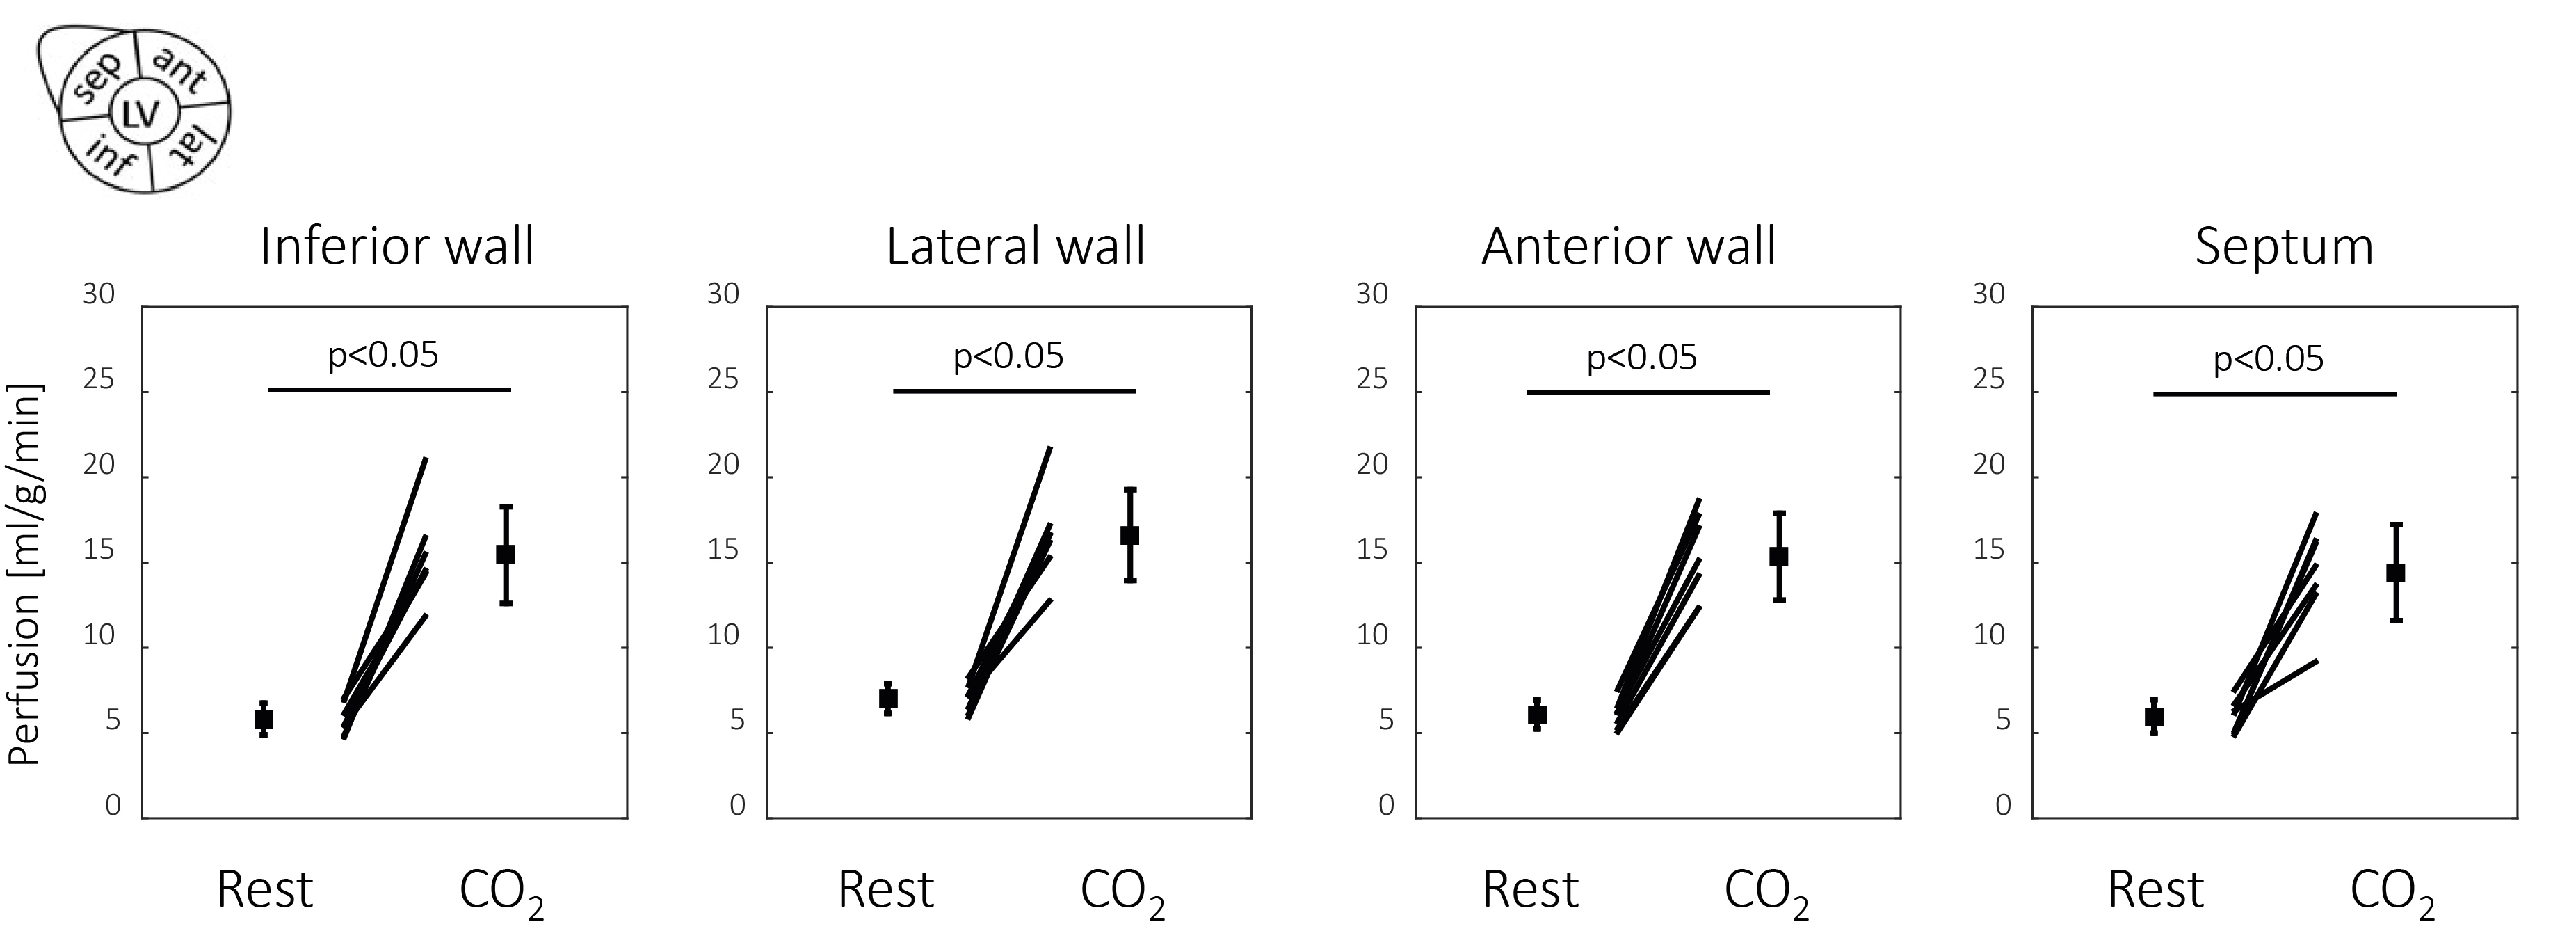
Data analysis: All data reconstruction and analyses were performed in MATLAB (The Mathworks, Natick, MA, USA) using in-house developed software. The acquired undersampled data were reconstructed using k-t PCA9. Analysis with Fermi deconvolution was based as described previously10. Perfusion and myocardial perfusion reserve (defined as the ratio between perfusion at hyperemia and at rest) was quantified in four myocardial segments11.
Results
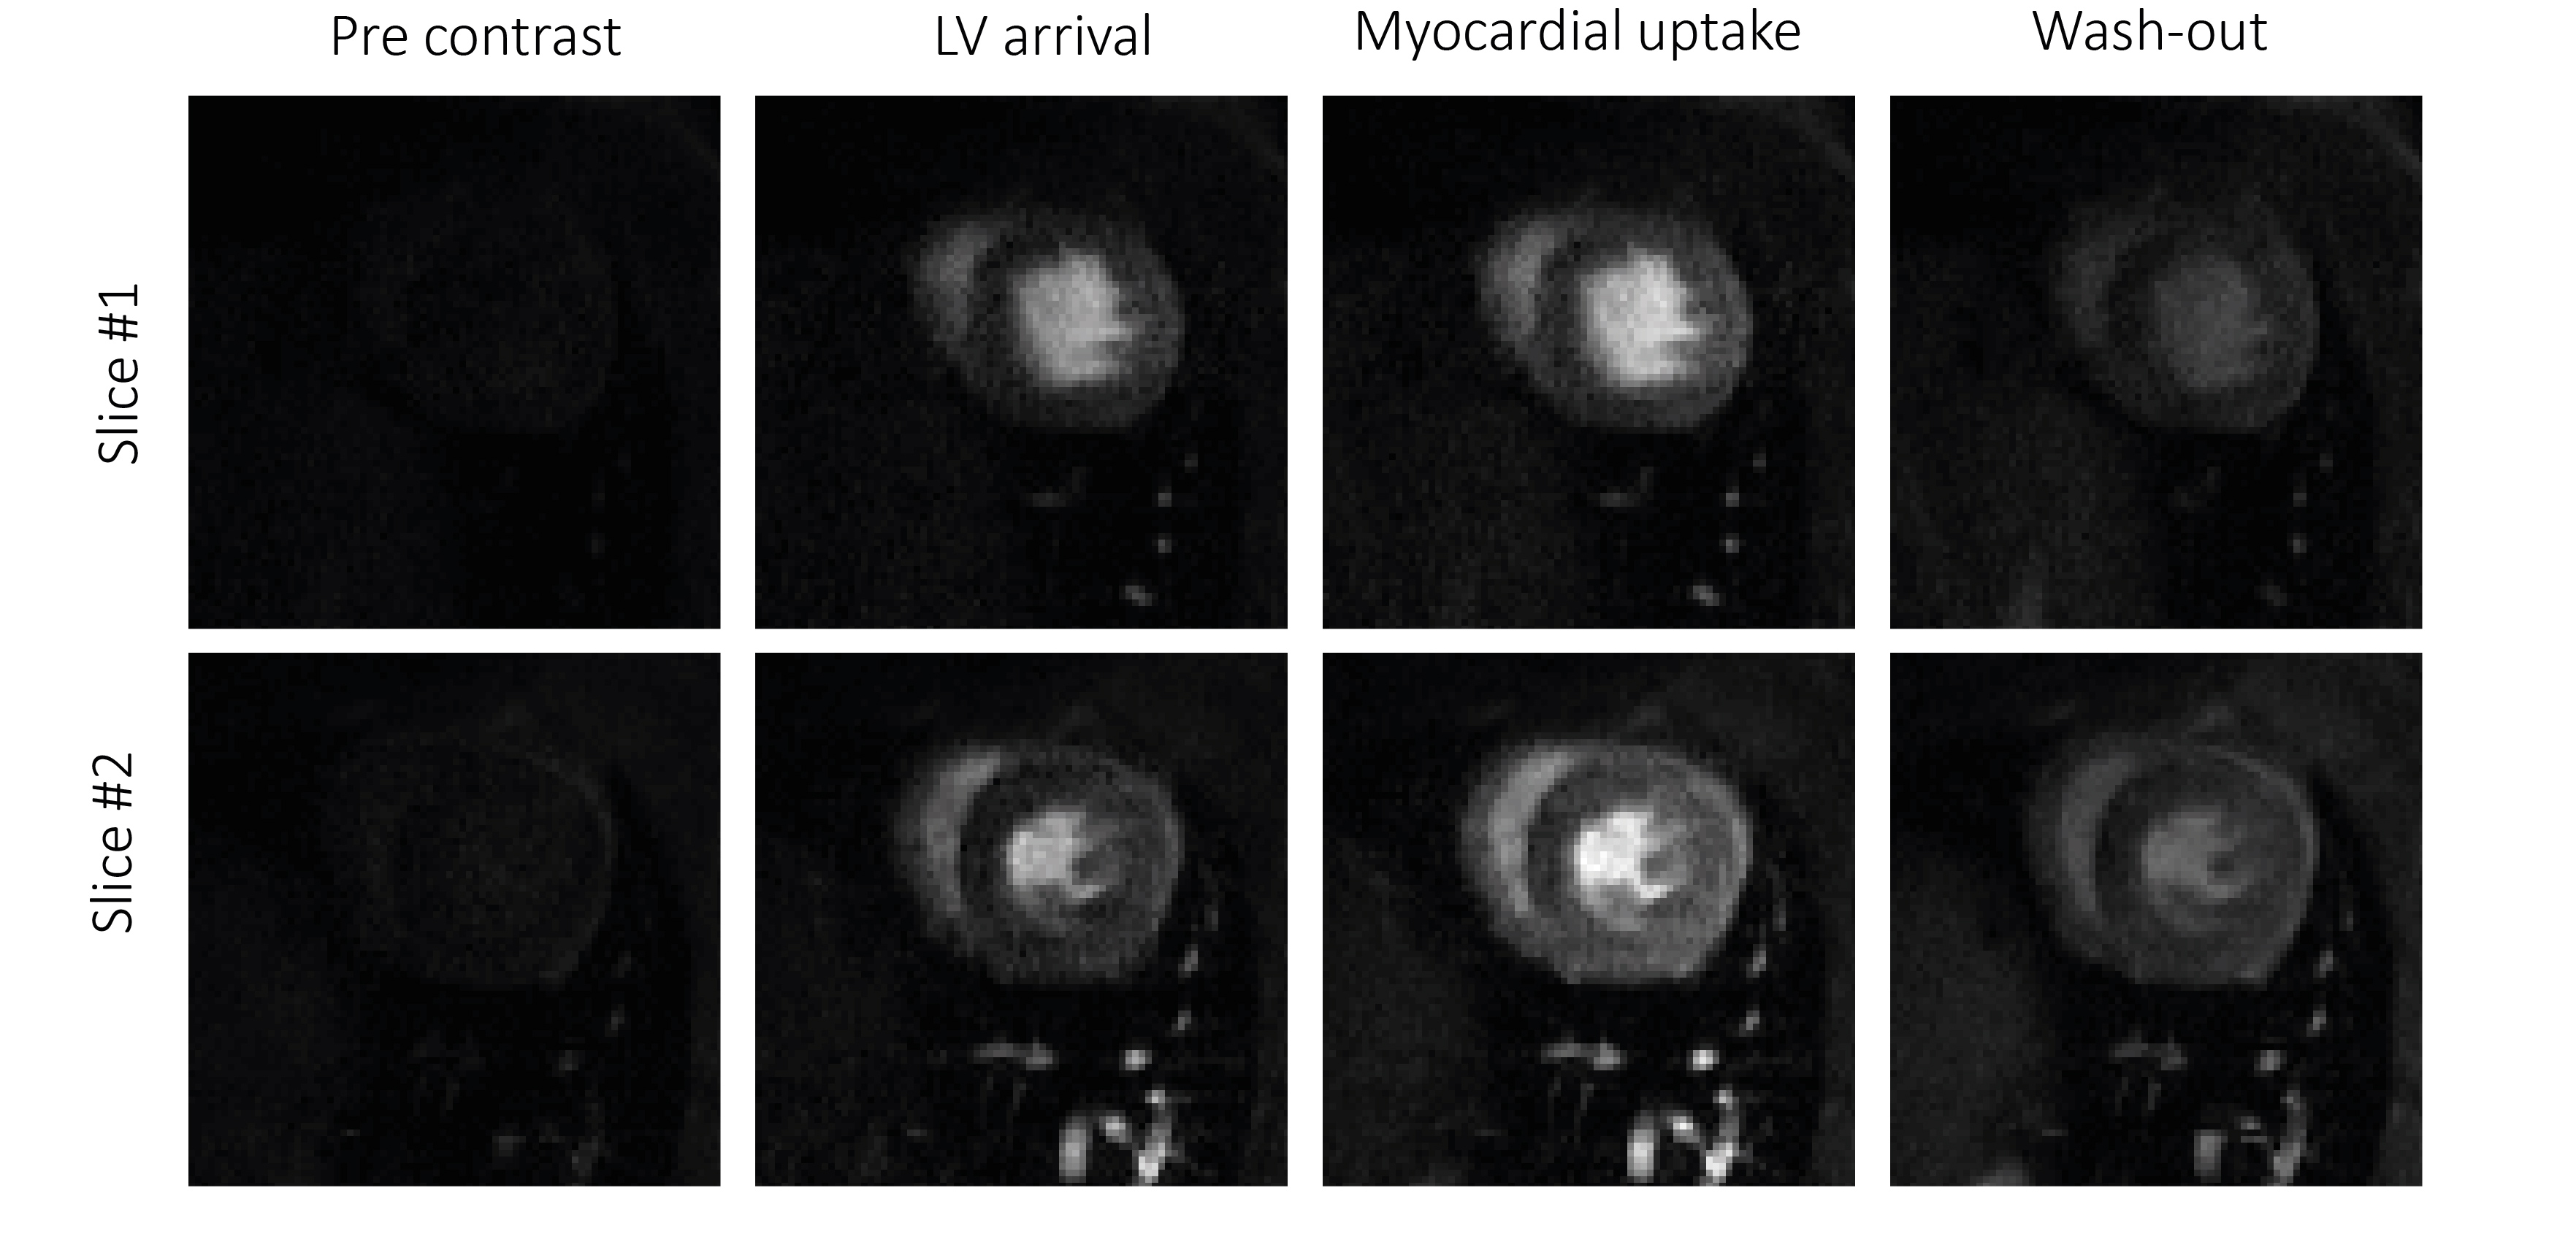
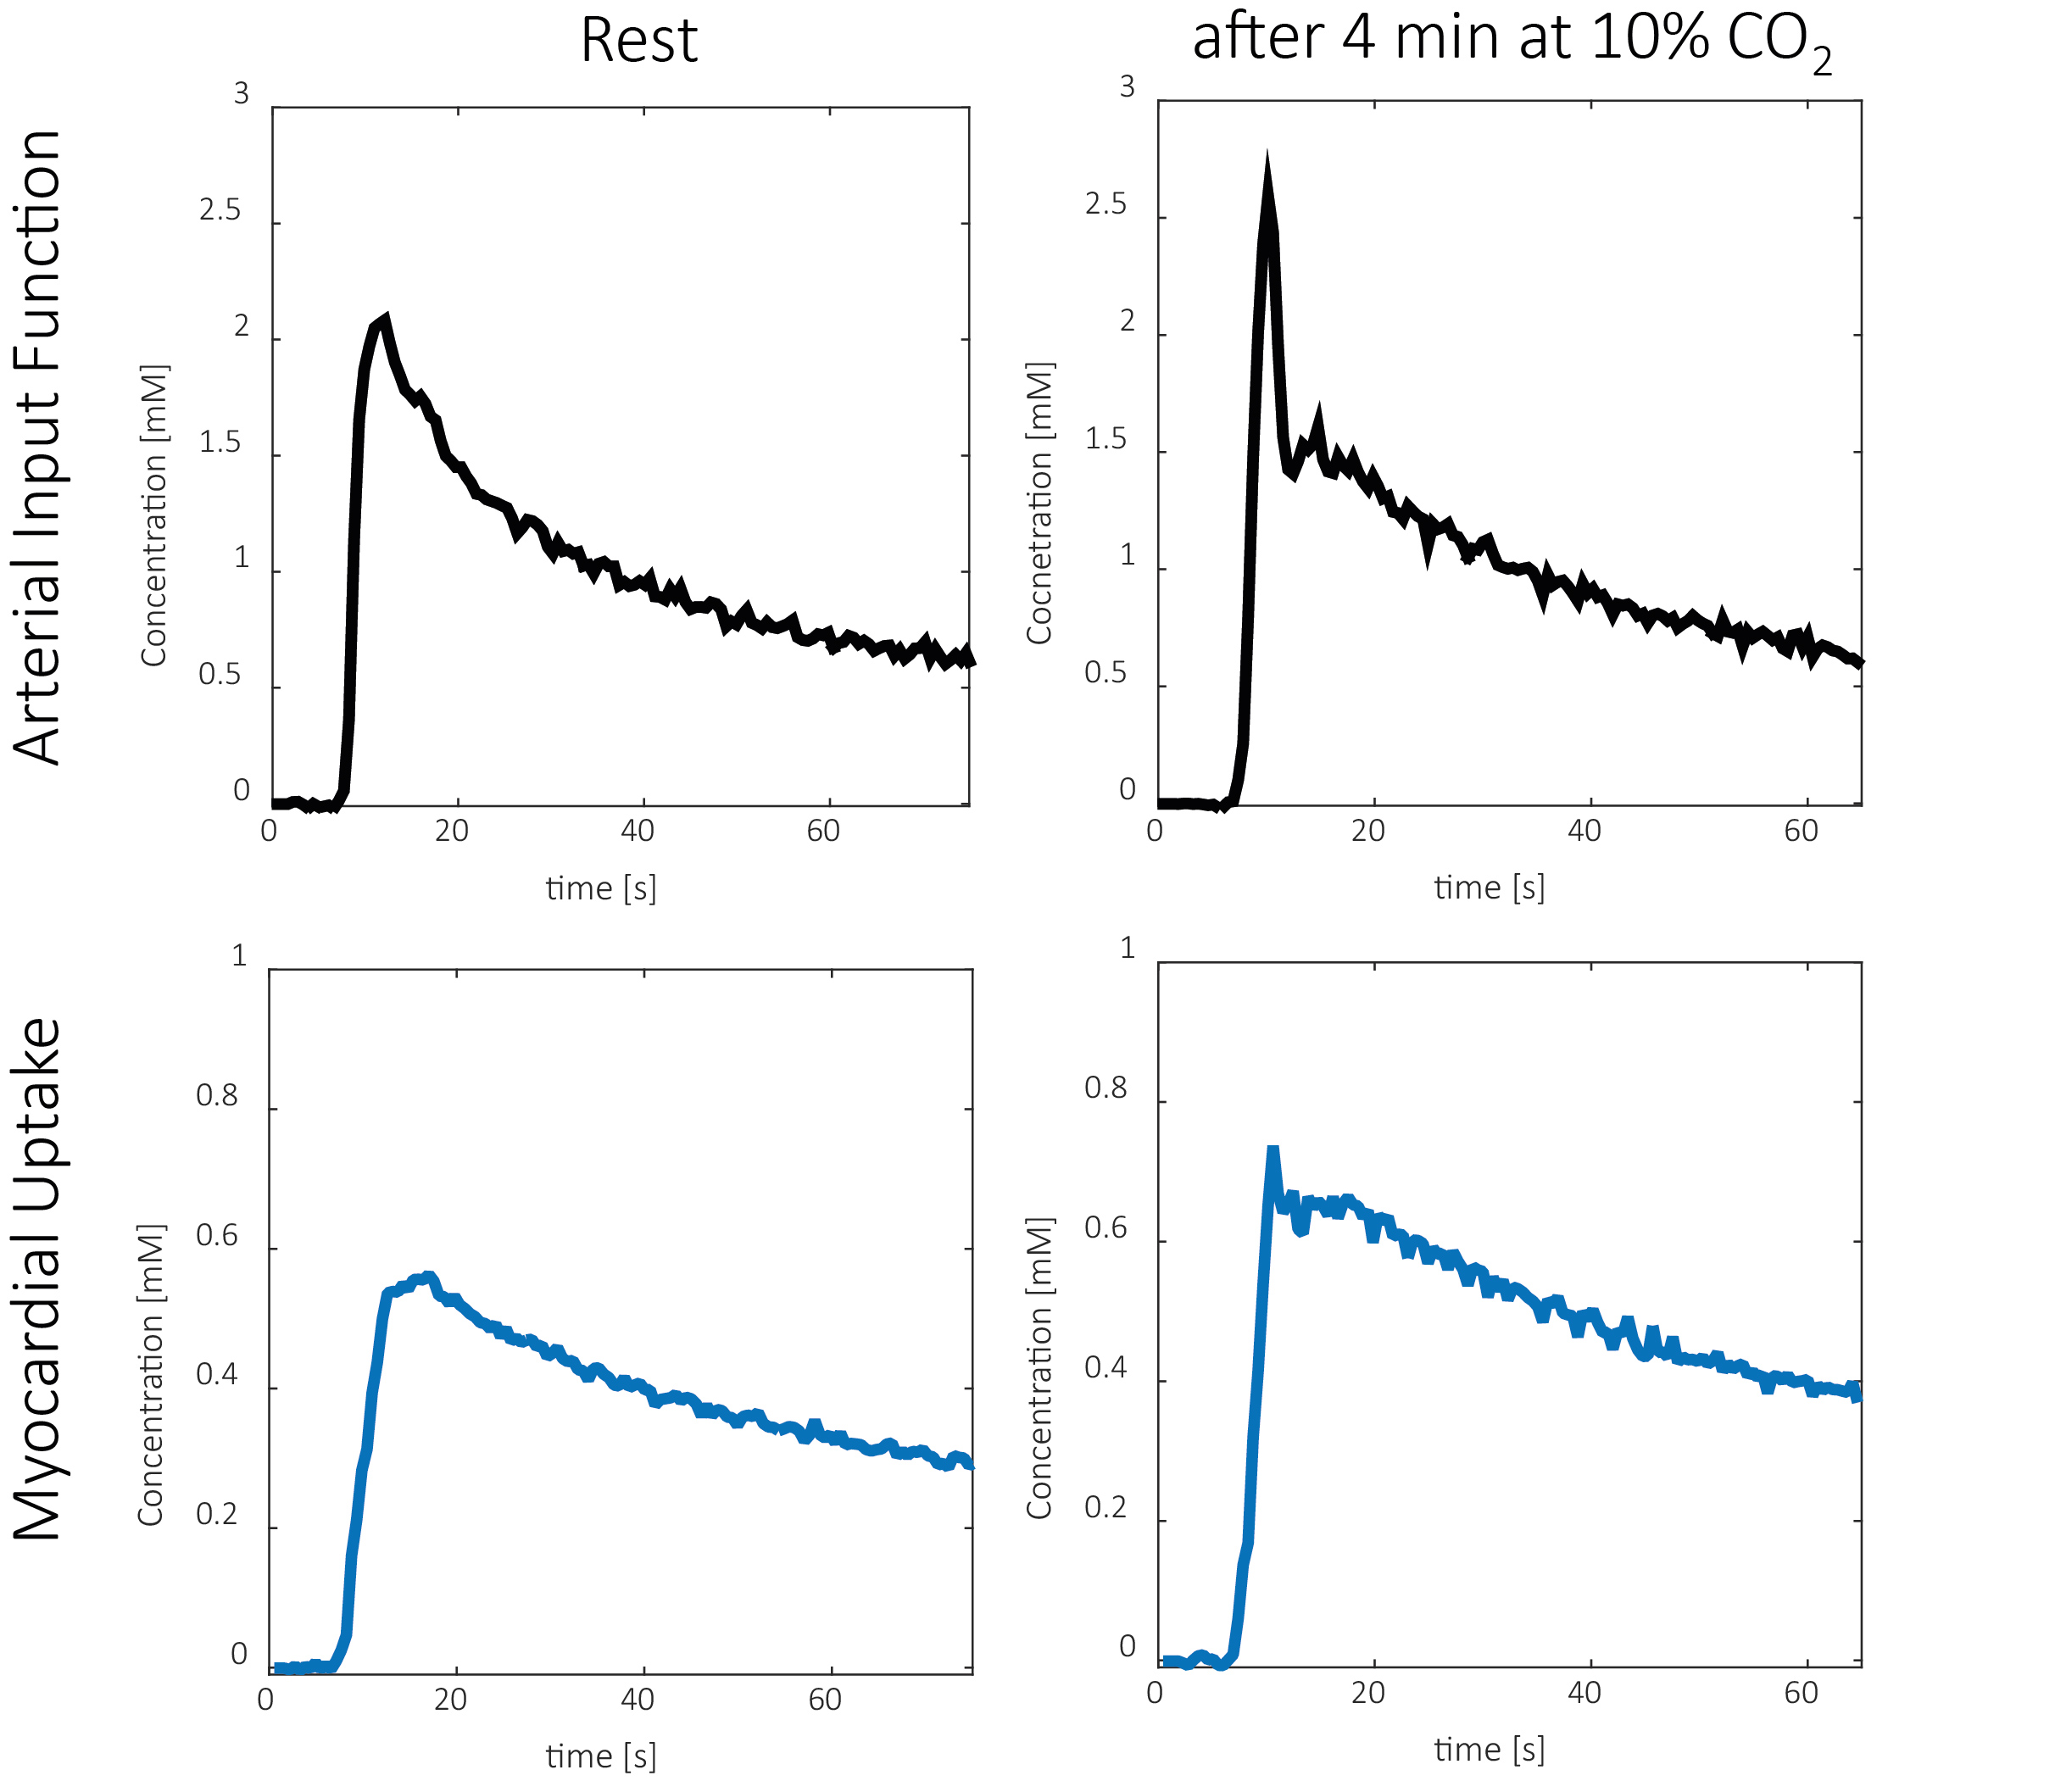
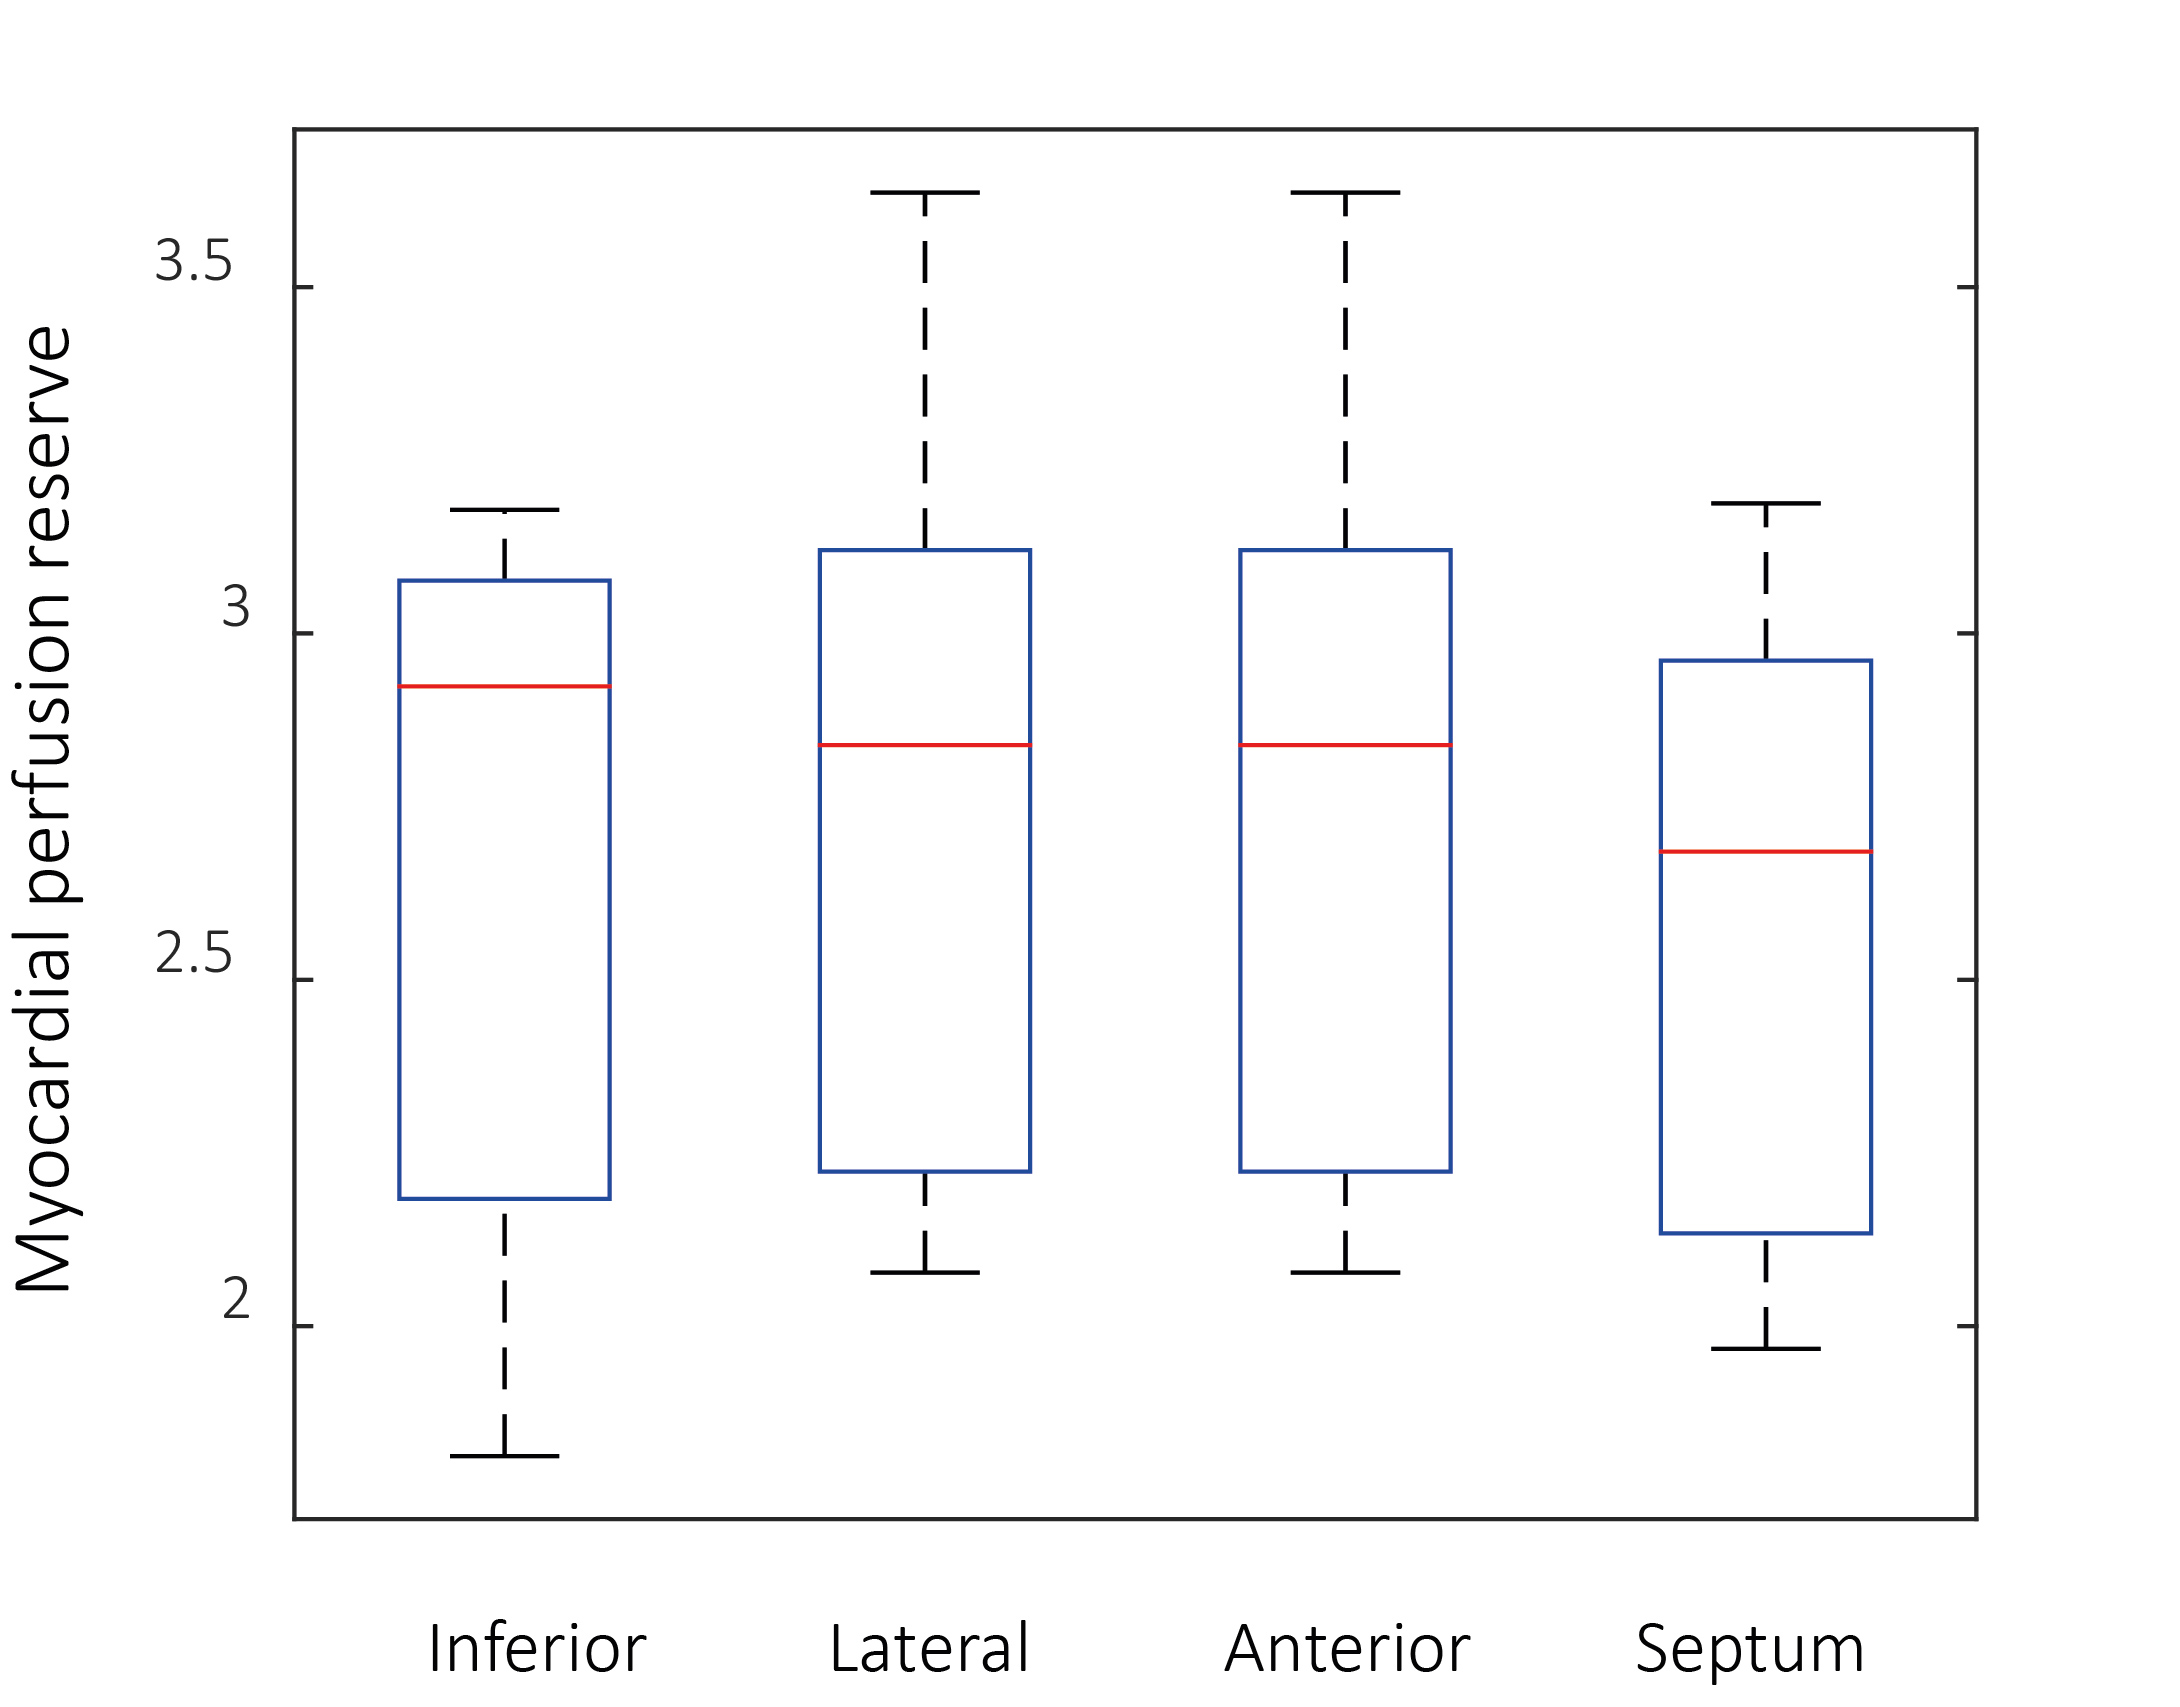
An overview of the sequence is shown in Fig. 1, with examples of contrast agent passage shown in Fig. 2. All 11 animals underwent the gas challenge, 3 animals were excluded from the data analysis due to severe respiratory artefacts. In all animals, the gas challenge resulted in a significantly elevated heart rate (349 ± 20 at rest vs 392 ± 16 at stress, p<0.05) and respiratory rate (60 ± 6 at rest vs 93 ± 7 at stress, p<0.05). No adverse effects of the gas challenge were observed. An example of an arterial input function and myocardial uptake, at rest and during hyperemia, is shown in Fig. 3. The subsequent analysis of mean blood flow in the four myocardial segment showed a significantly elevated blood flow after 4 min of respiration supplemented with 10% CO2 (MBF = 15.1 ± 2.5 ml/g/min), compared to the rest measurements (5.3 ± 0.8 ml/g/min), see Fig. 4. Changes in MBF were significant in all segments (p<0.05) and no significant differences was found between blood flow in different segments, at both rest and stress. The resulting myocardial perfusion reserve in the four myocardial segment is summarized in Fig. 5, with an average MPR value over all segments of 2.84 ±0.47.Discussion
In this study, a high-resolution first-pass perfusion imaging approach was used to assess the feasibility of gas challenge with 10% CO2 to induce significant hyperemia in the rat myocardium. The rest myocardial blood flow recorded in this study agrees well with previous reports12,13. A 4 min gas challenge with 10% CO2 was shown to induce significant hyperemia, resulting in an average myocardial perfusion reserve of 2.84 ±0.47, on the same level as reported for dipyridamole (2.46 ± 0.54)14 or regadenoson infusion (2.3 ± 0.4)7. In conclusion, gas challenge with CO2 can be successfully used to induce significant hyperemia, facilitating quantification of myocardial perfusion reserves in rats.Acknowledgements
No acknowledgement found.References
1. Pack NA, DiBella EVR, Wilson BD, McGann CJ. Quantitative myocardial distribution volume from dynamic contrast-enhanced MRI. Magn Reson Imaging. 2008;26(4):532-542
2. Vasu S, Bandettini WP, Hsu LY, et al. Regadenoson and adenosine are equivalent vasodilators and are superior than dipyridamole- a study of first pass quantitative perfusion cardiovascular magnetic resonance. J Cardiovasc Magn Reson. 2013;15(1):1-9.
3. Bos BYGCVANDEN, Drake AJ, Noble MIM. The effect of carbon dioxide upon myocardial contractile performance, blood flow and oxygen consumption. J Physiol. 1979;287:149-161.
4. Pelletier-Galarneau M, deKemp RA, Hunter CR, et al. Effects of Hypercapnia on Myocardial Blood Flow in Healthy Human Subjects. J Nucl Med. 2017;59(1)
5. Yang H-J, Dey D, Sykes J, et al. Arterial CO 2 as a Potent Coronary Vasodilator: A Preclinical PET/MR Validation Study with Implications for Cardiac Stress Testing. J Nucl Med. 2017;58(6):953-960.
6. Nierop BJ Van, Coolen BF, Dijk WJR, et al. Quantitative First-Pass Perfusion MRI of the Mouse Myocardium. Magn Reson Med. 2013;1744:1735-1744.
7. Naresh NK, Chen X, Roy RJ, Antkowiak PF, Annex BH, Epstein FH. Accelerated Dual-Contrast First-Pass Perfusion MRI of the Mouse Heart : Development and Application to Diet-Induced Obese Mice. Magn Reson Med. 2015;73:1237-1245.
8. Pedersen H, Kozerke S, Ringgaard S, Nehrke K, Won YK. K-t PCA: Temporally constrained k-t BLAST reconstruction using principal component analysis. Magn Reson Med. 2009;62(3):706-716.
9. Vitanis V, Manka R, Giese D, et al. High resolution three-dimensional cardiac perfusion imaging using compartment-based k-t principal component analysis. Magn Reson Med. 2011;65(2):575-587.
10. Jerosch-herold M, Wilke N, Stillman AE, Wilson RF. Magnetic resonance quantification of the myocardial perfusion reserve with a Fermi function model for constrained deconvolution. Med Phys. 1998;25(1):73-84.
11. Wespi P, Steinhauser J, Kwiatkowski G, Kozerke S. High-resolution hyperpolarized metabolic imaging of the rat heart using k–t PCA and k–t SPARSE. NMR Biomed. 2018;31(2).
12. Iltis I, Kober F, Dalmasso C, Lan C, Cozzone PJ, Bernard M. In Vivo Assessment of Myocardial Blood Flow in Rat Heart Using Magnetic Resonance Imaging : Effect of Anesthesia. 2005;247:242-247.
13. Waller C, Engelhorn T, Hiller K, et al. Impaired resting perfusion in viable myocardium distal to chronic coronary stenosis in rats. 2018:2588-2593.
14. Makowski M, Jansen C, Webb I, et al. First-Pass Contrast-Enhanced Myocardial Perfusion MRI in Mice on a 3-T Clinical MR Scanner. Magn Reson Med. 2010;64:1592-1598.
Figures