2210
Optimization of Steady-Pulsed Arterial Spin Labeling for Myocardial Perfusion Imaging1Electrical Engineering, University of Southern California, Los Angeles, CA, United States, 2Biomedical Engineering, University of Southen California, Los Angeles, CA, United States, 3Department of Clinical Collaborations, Canon Medical Systems USA, Tustin, CA, United States, 4Sunny Brook Research Institute, University of Toronto, Toronto, ON, Canada, 5Electrical Engineering, University of California Sandiego, Sandiego, CA, United States
Synopsis
Arterial spin labeling (ASL) is an attractive non-contrast option for myocardial perfusion imaging. Steady pulsed labeling has been shown to provide the highest signal efficiency in-vivo. In this work, we determine the flip-angle and imaging interval that provide maximum signal efficiency and temporal SNR using Bloch simulation and experiments in healthy swine. We demonstrate that an imaging FA of 40-50ºand imaging interval of 1-RR is optimal.
Introduction
ASL is an emerging option for non-contrast myocardial perfusion (MP) imaging. Steady pulsed arterial spin labeling (spASL) has been shown to have higher signal efficiency than all other myocardial ASL methods, including flow alternating inversion recovery (FAIR)1. Labeling and imaging is performed every heartbeat and leads to accumulated ASL signal. We hypothesize that this signal may be reduced in myocardium due to the partial saturation effects of image acquisition. We hypothesize that lower imaging FA may also reduce saturation effects, and reduce sensitivity to heart-rate variation. We test these hypotheses by studying the effect of flip angle (FA) and imaging interval on the ASL signal using Bloch simulations and in-vivo experiments in swine.Methods
Data acquisition:Three anesthetized and ventilated healthy pigs (Yorkshire, 18-20 Kg) were scanned on a GE 3T MRI under a protocol approved by our Institutes’ Animal Care Committees. Imaging was performed at a mid-short axis slice with spASL. Labeling was performed at end-systole of every RR. PICORE2 was used to minimize MT effects. Images were acquired in mid-diastole with transient balanced steady state free precession (bSSFP) at intervals of 1, 2, and 3-RR using established parameters3. Figure 1 illustrates the acquisition timing and graphic prescription.
Experiments: In increments of 10º,prescribed imaging FAs of 10º to 60º, 30º to 70º, and 40º to 70º were used for imaging-intervals of 1, 2, and 3 RR, respectively. Each ASL-CMR scan lasted 3.5 minutes. B1maps were acquired using the preconditioned FLASH method4.
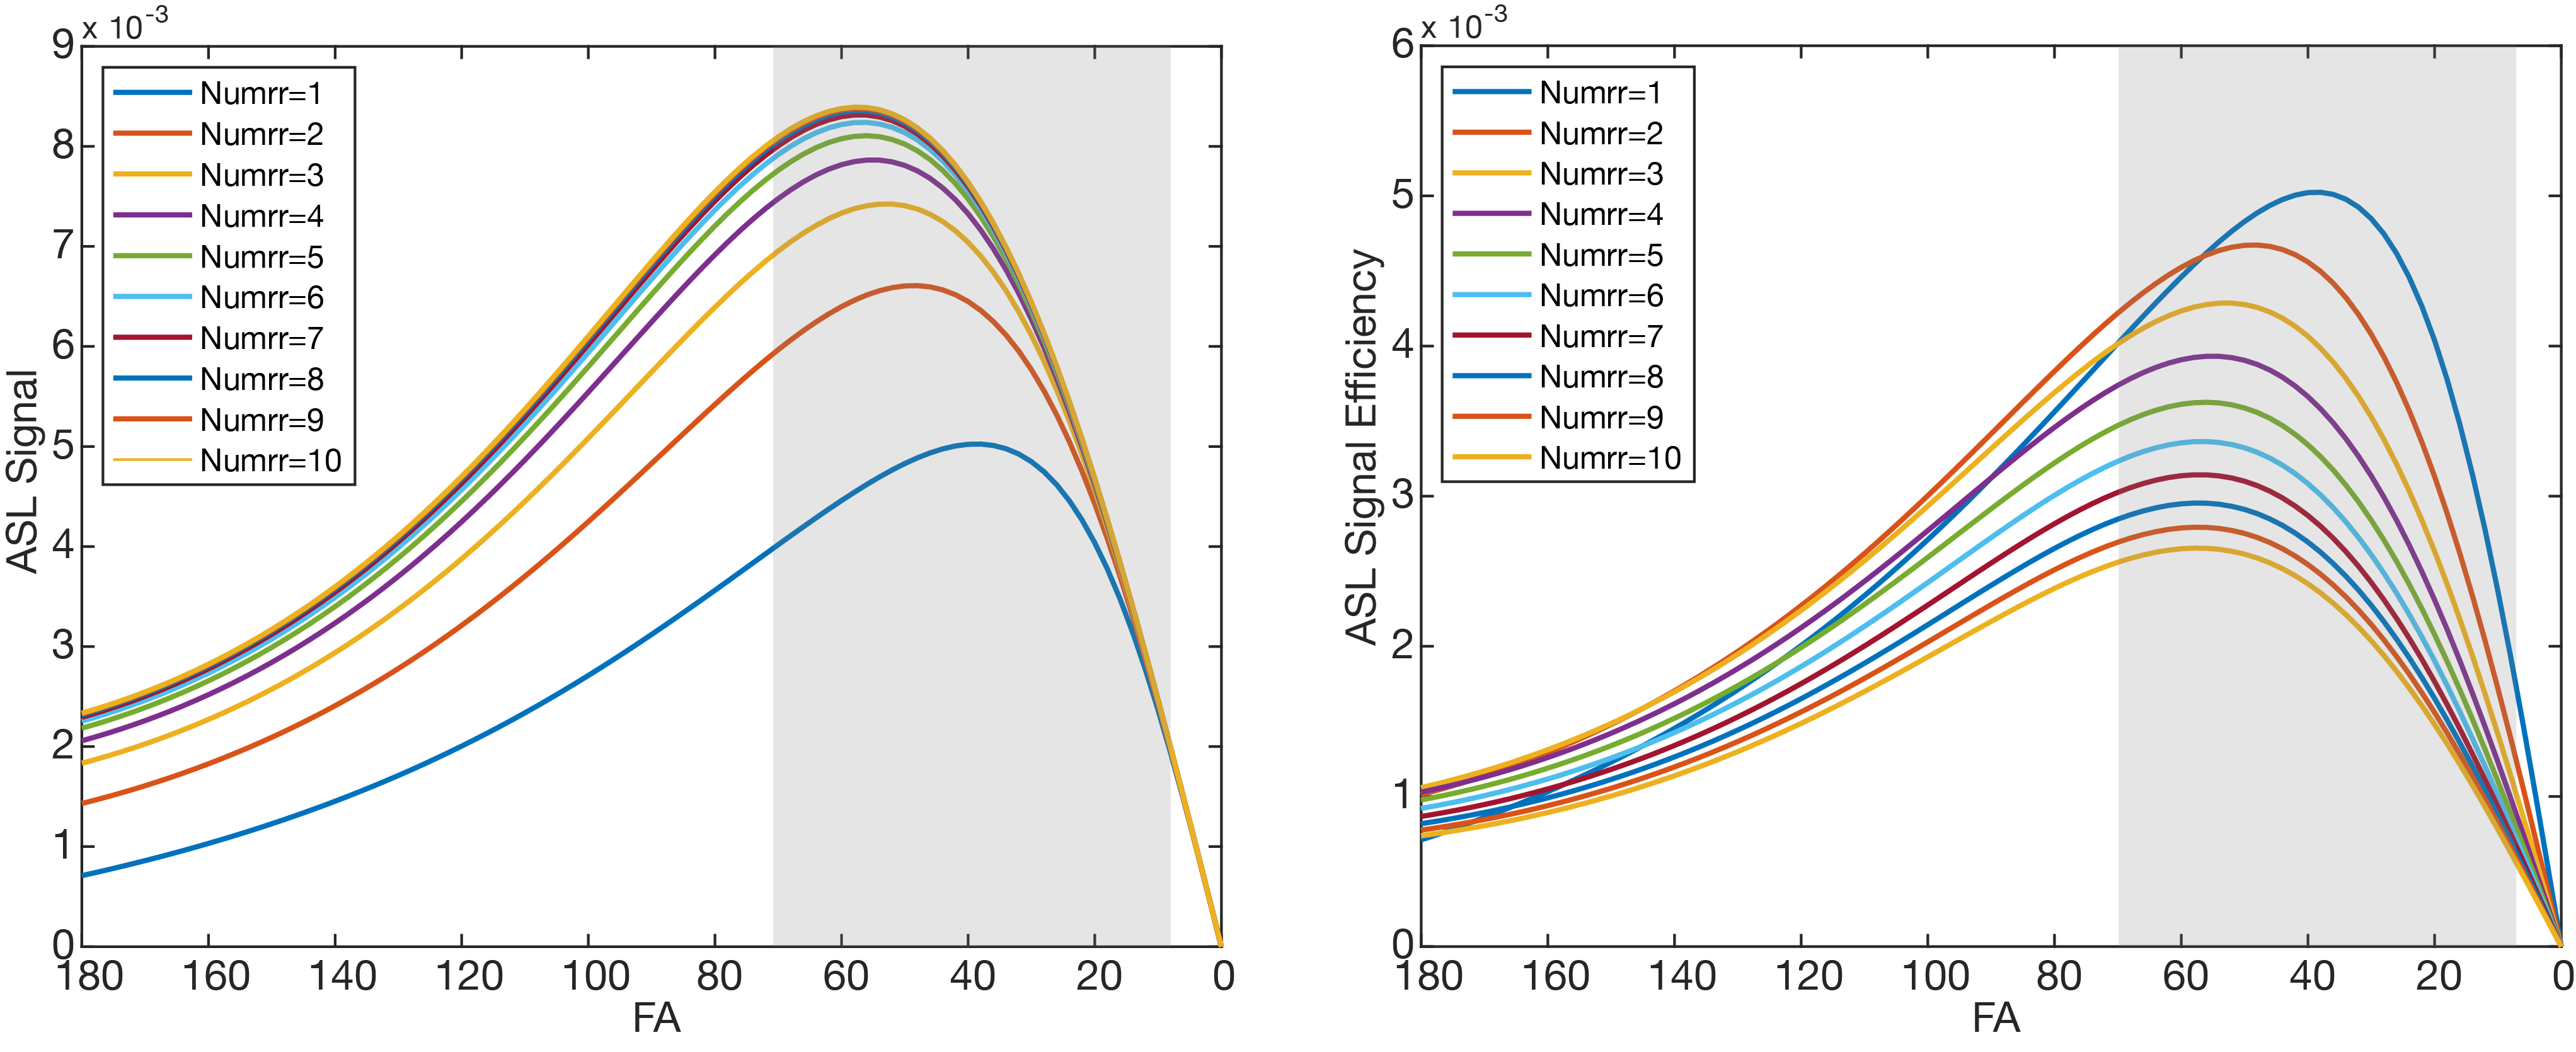
Simulations: Bloch simulations with flow were performed to estimate the maximum ASL signal and ASL signal efficiency for FAs of 0º to 180º and imaging intervals of 1RR to 10RR. Labeling efficiency of 50% was used in simulations due to known spurious labeling of blood in the left-atrium5.
Data processing: ASL data were reconstructed and analyzed using established approaches6,7. The first 6 images of each breath-hold were rejected as they occur during the transient approach to steady-state. ASL signal was calculated on a segment-wise basis as the difference between control and label images normalized by an independent measurement of M0. Prescribed FAs were converted to actual FAs using B1 maps. Only artifact free segments (anterior and anteroseptal) were used for comparison against simulations.
Analysis: Physiological-noise (PN) for spASL was calculated using $$$\sigma = \sqrt{(\sigma_c^2 +\sigma_t^2)/N}$$$, where $$$ \sigma_c $$$ and $$$ \sigma_t $$$ is the per-segment standard deviation of N control and label images. N was 50, 25, and 12 for imaging-intervals of 1, 2, and 3 RR, respectively. tSNR was calculated using $$$ tSNR= S/\sqrt{\sigma} $$$ , where S is the ASL signal. ASL signal efficiency was calculated using $$$ \eta_{signal} = S/\sqrt{\tau} $$$, where is $$$ \tau $$$ is imaging-interval equal-to 1, 2, or 3 RR.
Results
Simulations: Figure 2 shows simulated ASL signal and ASL signal efficiency. spASL signal increased with imaging intervals up to 6 RR and is maximized at FA of 40º, 50º, and 55º for imaging interval of 1, 2, and 3RR, respectively. Overall ASL signal efficiency is maximized for FA of 40º and interval of 1RR.
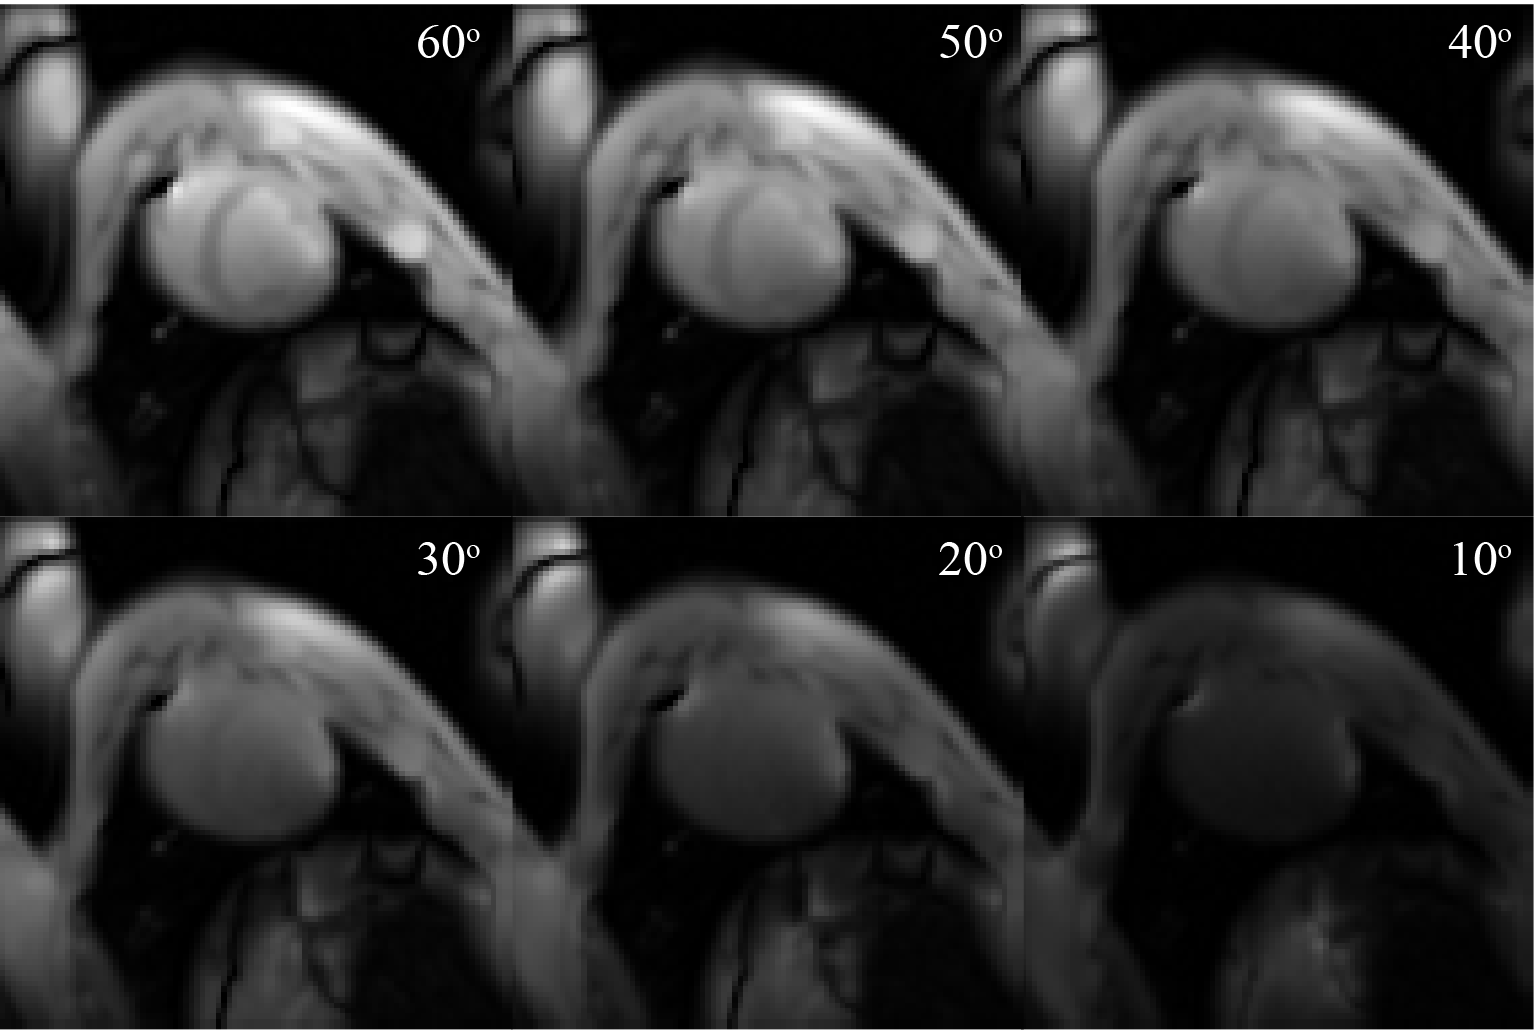
Experiments: One pig was excluded because it became physiologically unstable and the scan was terminated early. Figure 3 shows that in-vivo ASL signal efficiency and tSNR was maximized for actual FA of 48º and imaging interval of 1RR. Surprisingly, for a given FA, ASL signal did not increase with increasing imaging interval, and higher ASL signal was observed in-vivo. Figure 4 shows representative baseline images to demonstrate image quality as a function of FA.
Discussion
We suspect that the mismatch between simulations and experiments is due to an underestimation of labeling efficiency in simulation. The current simulations of labeling efficiency do not consider the effect of imaging on the LV blood pool signal8. If real, this effect will increase labeling efficiency and increase the ASL signal preferentially for shorter imaging intervals such as 1RR.Conclusion
ASL signal efficiency and tSNR in spASL is maximized using FA of 40º-50º and imaging interval of 1RR in healthy swine based on simulations and experimental data.Acknowledgements
Grant Support: NIH R01-HL130494References
1. Capron T, Troalen T, Robert B, Jacquier A, Bernard M, Kober F. Myocardial perfusion assessment in humans using steady-pulsed arterial spin labeling: Human MBF Using Steady-Pulsed Arterial Spin Labeling. Magnetic Resonance in Medicine 2015;74:990–998.
2. Wong EC, Buxton RB, Frank LR. Implementation of quantitative perfusion imaging techniques for functional brain mapping using pulsed arterial spin labeling. NMR in Biomedicine 1997;10:237–249.
3. Jao TR, Do HP, Nayak KS. Myocardial ASL-CMR perfusion imaging with improved sensitivity using GRAPPA. Journal of Cardiovascular Magnetic Resonance 2016;18:P10.
4. Chung S, Kim D, Breton E, Axel L. Rapid B1+ mapping using a preconditioning RF pulse with TurboFLASH readout. Magnetic Resonance in Medicine 2010.
5. Javed A, Jao T, Ghugre N, Wright G, Wong EC, Nayak KS. “Saturation”-based Steady Pulsed Myocardial ASL Perfusion Imaging. In: Journal of Cardiovascular Magnetic Resonance. Seattle; 2019.
6. Jao T, Zun Z, Varadarajan, Padmi, Pai, Ramdas, Nayak K. Myocardial ASL Data Filtering for Improved Detection of CAD. In: International Society of Magnetic Resonance in Medicine. Vol. 20. ; 2012. p. 3892.7.
7. Javed A, Jao TR, Nayak KS. Motion correction facilitates the automation of cardiac ASL perfusion imaging. Journal of Cardiovascular Magnetic Resonance 2015;17.
8. Campbell-Washburn AE, Zhang H, Siow BM, et al. Multislice cardiac arterial spin labeling using improved myocardial perfusion quantification with simultaneously measured blood pool input function: Perfusion Quantification for Multislice Cardiac ASL. Magnetic Resonance in Medicine 2013;70:1125–1136.
Figures