2209
Detecting Hemorrhagic Myocardial Infarction with Dark Blood T2*: Experimental Findings1Cedars-Sinai Medical Center, Los Angeles, CA, United States, 2University of California, Los Angeles, Los Angeles, CA, United States, 3Lawson Health Research Institute, London, ON, Canada
Synopsis
Dark-blood prepared T2* MRI has become the preferred method for examining global myocardial iron overloading. However, whether dark-blood prepared T2* MRI is superior to bright-blood T2* MRI for the detection of hemorrhagic myocardial infarctions is not known. Here we show that, compared to bright-blood T2* MRI, dark-blood prepared T2* MRI yields significantly lower image contrast for detecting hemorrhagic myocardial infarction at 1.5T and 3.0T. We conclude that unless this loss in image contrast is mitigated, dark-blood T2* MRI may not provide adequate sensitivity for detecting hemorrhagic myocardial infarctions.
Introduction
T2* MRI is indispensable in the management of global myocardial iron overloading conditions such as thalassemia. Since standard (bright-blood) T2* MRI can be impacted by flow artifacts, dark-blood prepared T2* MRI1, which can minimize these artifacts, has become the preferred approach in the examination of global myocardial iron overloading. Multiple clinical studies have shown that hemorrhage within myocardial infarctions (MI) is associated with major adverse cardiovascular events in patients surviving the index event. T2* MRI is the preferred method for accurate assessment of reperfusion hemorrhage and the ensuing iron deposition2. However, whether dark-blood T2* MRI improves the capacity to delineate reperfusion hemorrhage has not been investigated. We studied this in a clinically relevant animal model of MI with reperfusion hemorrhage at the commonly employed clinical field strengths, 1.5T and 3.0T at the acute and chronic phases of MI.
Methods
Dogs (n=11) underwent ischemia (~2 hours) followed by reperfusion were studied at the acute and chronic phases following infarction. Cardiac MR images (bright-blood T2*-weighted, dark-blood T2*-weighted and late gadolinium enhanced (LGE)) were acquired using whole-body 1.5T and 3.0T MRI systems. Echo times (TE) of T2*-weighted images ranged from 2.47 ms to 19.34 ms at 1.5T (Aera, Siemens Healthcare, Germany); and 2.85 ms to 13.56 ms at 3.0T (Verio, Siemens Healthcare, Germany). Hemorrhage was identified on bright-blood T2*-weighted images based on mean-2SD criteria in CVI42 (Circle Imaging, Canada) that were confirmed for infarction based on LGE MRI. Image contrast metrics were computed at the respective TEs as:
(a) Contrast-to-noise ratio:
$$CNR = \frac{S_r - S_h}{σ}$$
(b) Relative contrast:
$$C = 100\% \times \frac{S_r - S_h}{S_r}$$
where Sr is mean intensity of remote myocardium, Sh is mean intensity of hemorrhagic region and σ is standard deviation of remote signal intensity.
Differences in image contrast metrics between bright-blood and dark-blood methods at each TEs were computed as:
$$ΔCNR = 100\% \times \frac{CNR_{BB} - CNR_{DB}}{CNR_{BB}}$$
where CNRBB and CNRDB are CNR derived using bright-blood and dark-blood T2* images, respectively.
$$ΔC = 100\% \times \frac{C_{BB} - C_{DB}}{C_{BB}}$$
where CBB and CDB are C derived using bright-blood and dark-blood T2* images, respectively.
Signal to noise ratio was computed at each TEs as:
$$SNR = \frac{S_r}{σ}$$
and the difference in signal to noise ratio between bright-blood and dark-blood were computed at each TEs as:
$$ΔSNR = 100\% \times \frac{SNR_{BB} - SNR_{DB}}{SNR_{BB}}$$.
T-tests were used to determine whether ΔCNR, ΔC and ΔSNR are over 0.
Results
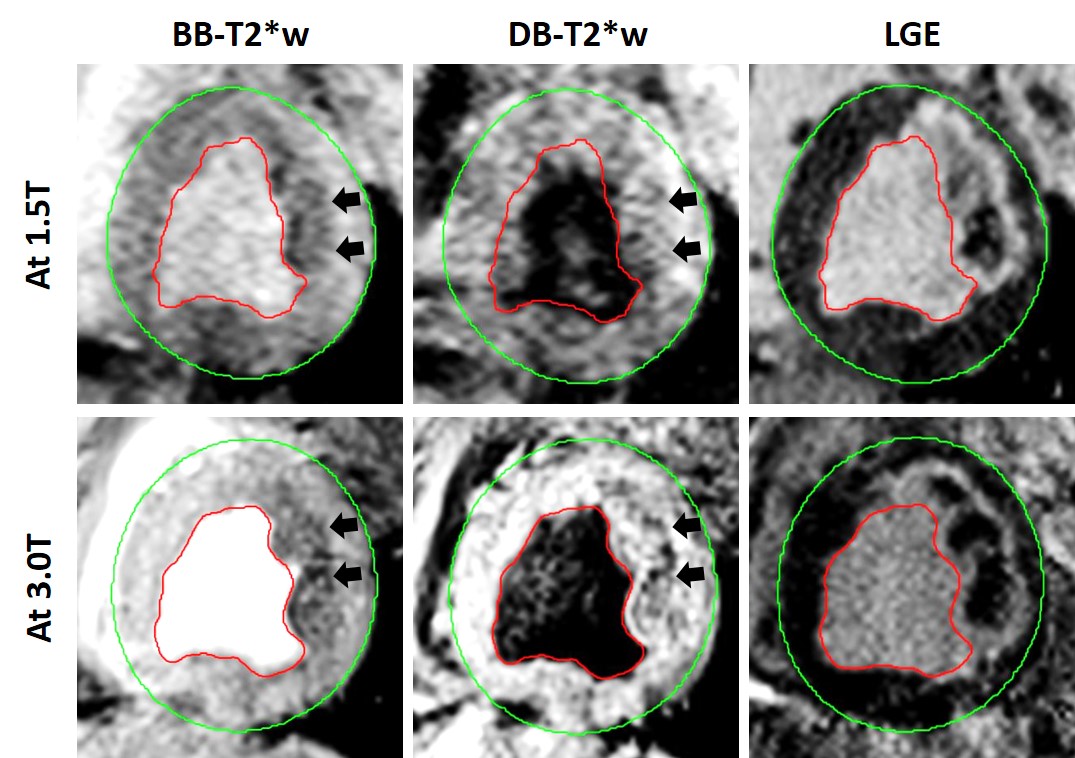
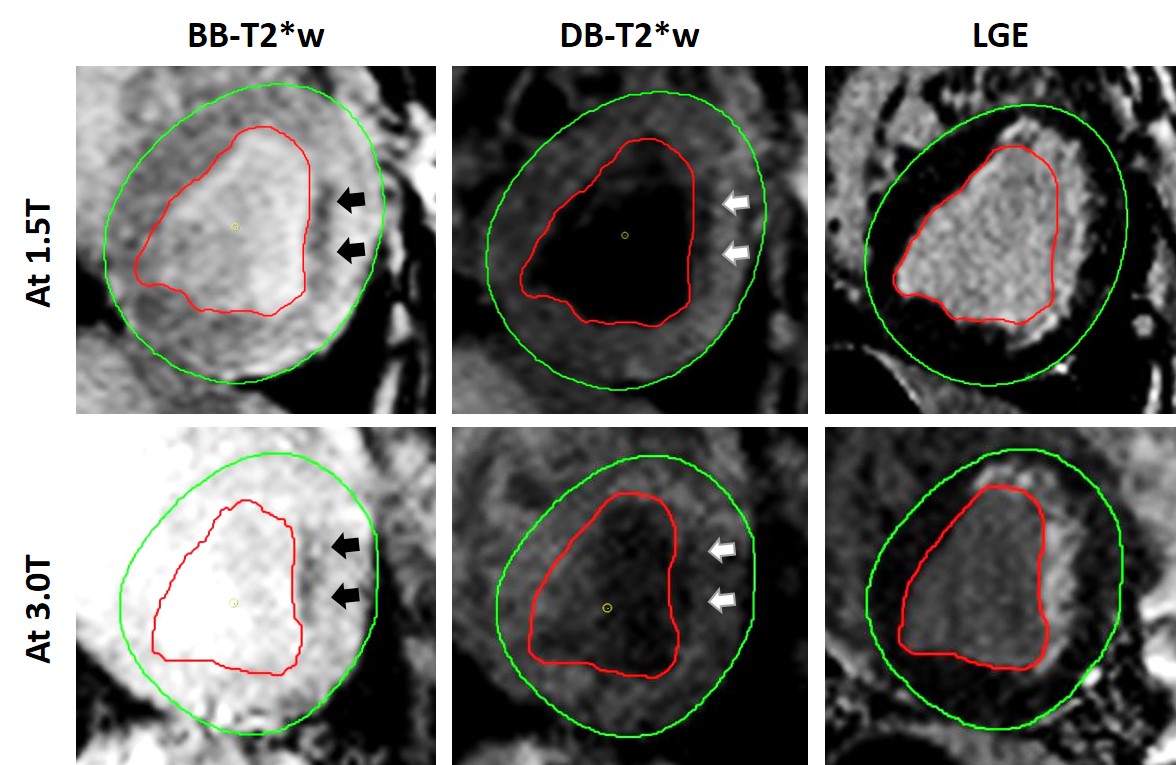
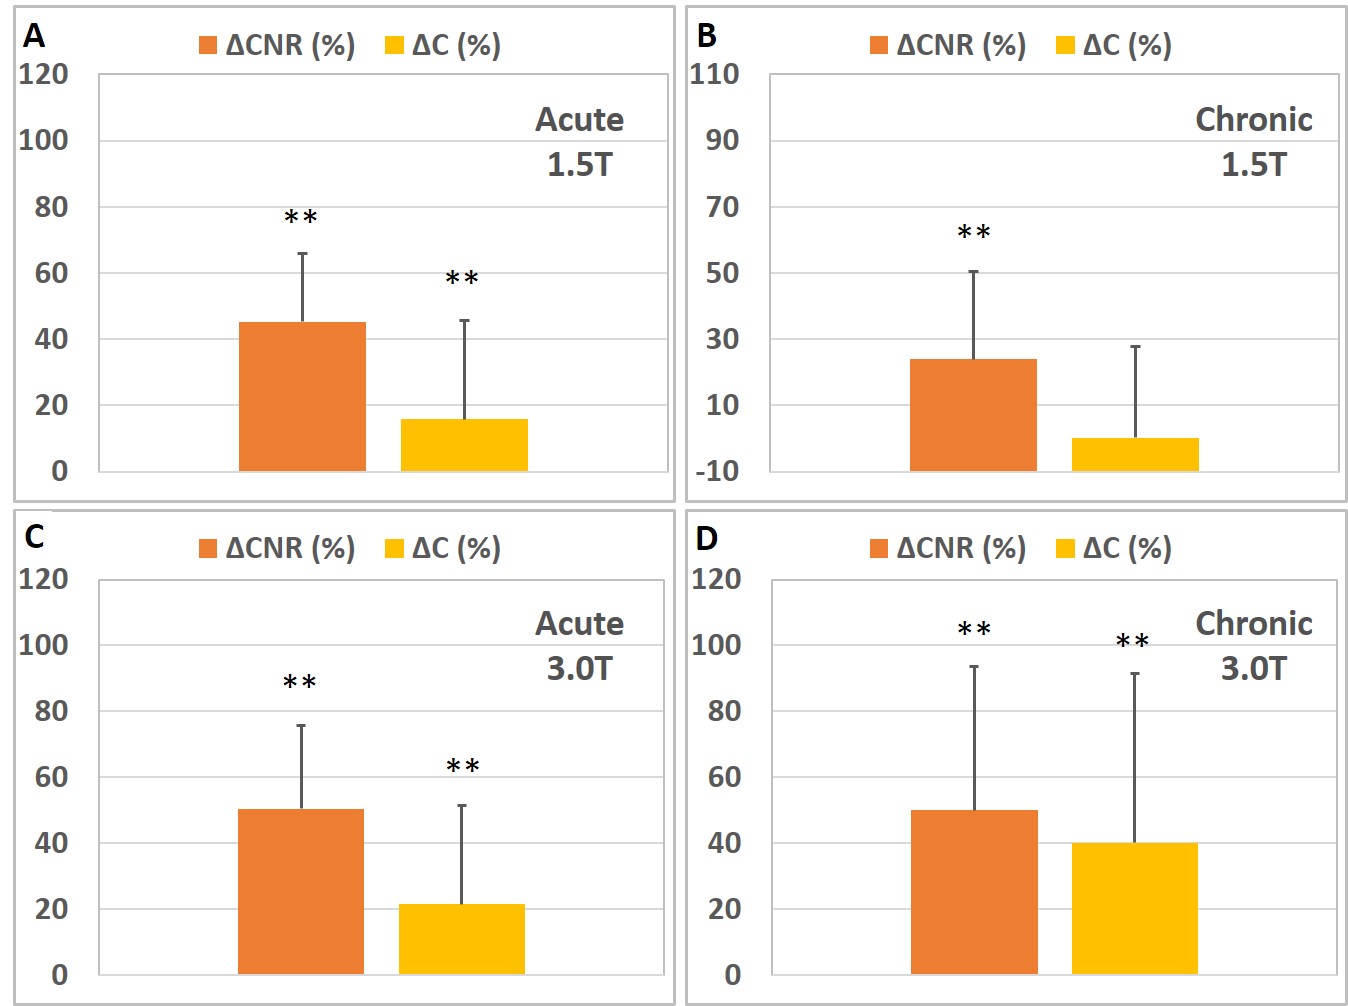
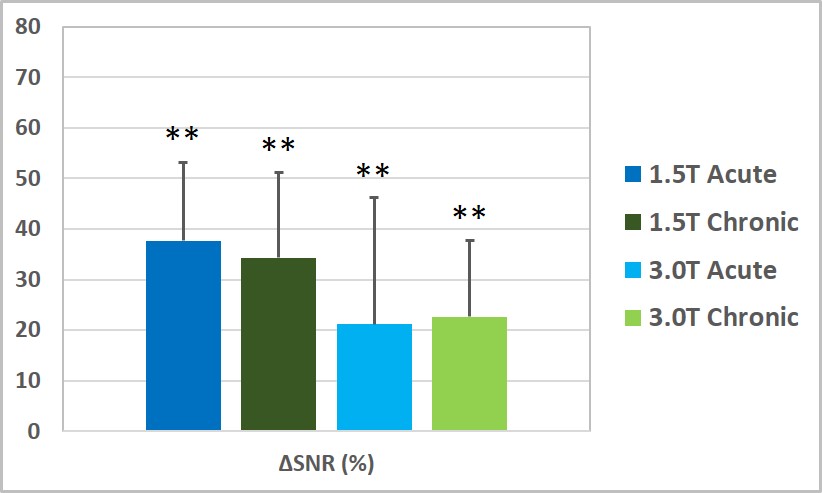
Figure 1 and Figure 2 show representative bright-blood and dark-blood prepared T2* weighted images at 1.5T and 3.0T, along with corresponding LGE from animals in the acute and chronic phases following reperfused hemorrhagic MIs at the lowest TEs when iron deposits are visible. Figure 3 shows loss in image contrast metrics (CNR and C) at 1.5T and 3.0T independent of acute or chronic phase of MI across all animals. Figure 4 shows the decrease in SNR due to dark-blood preparations at 1.5T and 3.0T.Conclusion
Dark-blood preparation can lead to a significant reduction of image contrast in T2*-weighted MRI for detecting hemorrhagic infarctions in the acute and chronic phases of MI at 1.5T and 3.0T, which can significantly reduce the conspicuity for detecting hemorrhagic infarct territories. While additional studies are needed to investigate the mechanisms contributing to the loss in image contrast with dark blood preparation, we anticipate that SNR differences, B1 inhomogeneity and though-plane motion may contribute to the diminishing image contrast. We conclude that unless this loss in image contrast is mitigated, dark-blood T2* MRI may not provide adequate sensitivity for accurately detecting hemorrhagic myocardial infarctions.Acknowledgements
References
1. Smith, G. C., Carpenter, J. P., He, T., Alam, M. H., Firmin, D. N., & Pennell, D. J. (2011). Value of black blood T2* cardiovascular magnetic resonance. Journal of Cardiovascular Magnetic Resonance, 2011, 13(1), 21.
2. Kali, A., Tang, R. L., Kumar, A., Min, J. K., & Dharmakumar, R. Detection of acute reperfusion myocardial hemorrhage with cardiac MR imaging: T2 versus T2. Radiology, 2013, 269(2), 387-395.
Figures