2205
Correction of the effects of heart rate changes on MOLLI1Department of Medical Radiological Technology, Faculty of Health Sciences, Kyorin University, Mitaka, Japan
Synopsis
In fast cardiac T1 mapping implementing ECG-gating, the recovery time of the longitudinal magnetization will change with heart rate variation, which will affect T1 measurement accuracy. Several studies have investigated the influence of heart rate variability on modified look-locker inversion recovery; however, no analytical approach for correcting the T1 value after scanning has been reported to date. Here, we investigated the effect of heart rate change on measurement of T1 values and report a correction method. This proposed method can reduce the effect of arrhythmia in fast cardiac T1 mapping.
INTRODUCTION
T1 mapping allows quantitative evaluation of myocardial characteristics. The fast T1 mapping method 1-4 can obtain images in a single breath-hold. However, when implementing electrocardiography (ECG)-gating in this method, the recovery time of the longitudinal magnetization changes with heart rate variation, which may affect T1 measurement accuracy. Although the effect of heart rate variability on modified look-locker inversion recovery (MOLLI) has been studied, 1,5-7 no analytical approach for correcting T1 values after scanning has been reported. We investigated the effect of heart rate changes on T1 value measurements and propose a correction method.METHODS
To simulate arrhythmias, a PC-based, arbitrarily changeable wave-form and heart rate generator was used. As reference, we set RR = 1000 ms (HR60; N), and varied it between 500 ms (HR120) and 1200 ms (HR50). We also used (1) 20% shortened (S) RR, (2) 20% extended (L) RR, and (3) a mixture of 20% shortening and extension, in 10 patterns: 1. N-N-N-N (N =1000 ms), 2. S-S-S-S (S = 800 ms), 3. S-S-S-S (S = 500 ms), 4. L-L-L-L (L = 1200 ms), 5. N-N-N-S (N = 1000 ms, S = 800 ms), 6. N-N-N-L (N = 1000 ms, L = 1200 ms), 7. N-N-L-L (N = 1000 ms, L = 1200 ms), 8. N-N-S-L (N = 1000 ms, S = 800 ms, L = 1200 ms), 9. N-N-S-S (N = 1000 ms, S = 800 ms), 10. N-N-S-L (N = 1000 ms, S = 500 ms, L = 1200 ms). An ECG-gated 2D segmented fast-field echo single-slice image was acquired using a 3-T MRI scanner (Vantage™ Titan 3T, Canon Medical Systems, Japan) with a 16-channel head coil. A 3-T MRI T1 standard value phantom was used. The scanning conditions of the MOLLI method were TR/TE = 3.9/1.4 ms, FA = 13°, and matrix 128 × 240. We used 2 types of MOLLI: pre5(3)3 and post4(1)3(1)2, with initial settings of inversion times = 140, 280, 420 ms. To measure the RR variation patterns, scan sounds were recorded and analyzed using MATLAB, because the MRI scanner and heart rate generator were not synchronized. We determined the reference T1 value using a standard inversion recovery based T1 measurement method. To correct changes in T1 value measurements according to heart rate variability, we proposed a method that could compensate for longitudinal magnetization alterations caused by RR variations, by successively calculating the amount of variation in longitudinal magnetization and examined the compensation effect. We propose the following expression: S = A - B βn exp (-TI / T1*), where TI represents the inversion time, and T1* is the apparent T1, and βn = 1- γ βn-1, γ = exp (-TI / T1*). The measured values were used to fit the 3-parameter model for estimating A, B, and T1*, and T1 values were calculated from A, B, and T1*: T1 = T1*(B / A - 1).RESULTS
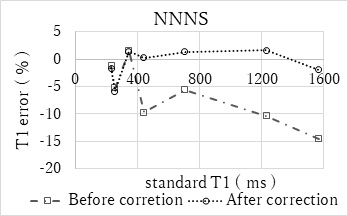
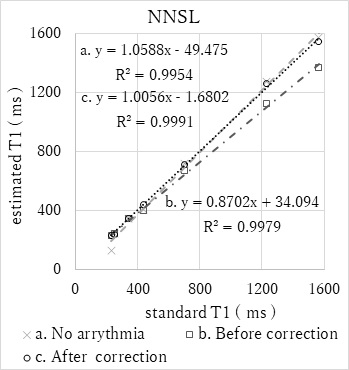
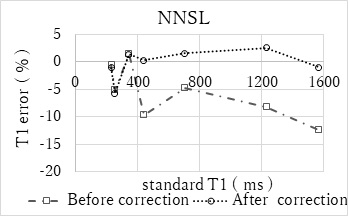
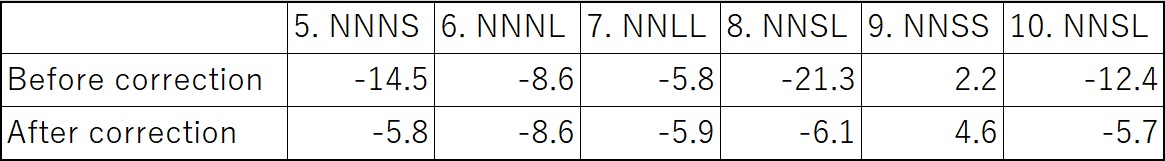
The measured T1 values changed with heart rate variation, and the correlation coefficients for the standard T1 values and measured T1 values decreased. The MOLLI method was not significantly affected by patterns 6, 7, and 9, but was markedly affected by patterns 5, 8, and 10. If the heart rate patterns included shortened RRs, the MRI scanner would automatically skip one heartbeat. Thus, the actual patterns were 3. SS-SS (SS = 1000 ms), 5. N-N-NS (N = 1000 ms, NS = 1800 ms), 8. N-N-SL (N = 1000 ms, SL = 2000 ms), 9. N-N-SS (N = 1000 ms, SS = 1600 ms), 10. N-N-SL (N = 1000 ms, SL = 1700 ms). The maximum error of T1 measurement due to heart rate changes was 21%. With our correction, we could reduce errors due to heart rate variation. This reveals the particular effect of heart rate variability (Figs. 1–4). In case of 5. N-N-NS, the correlation coefficient was improved from 0.84 to 0.99 after correction. In case of 10. N-N-SL, the correlation coefficient was improved from 0.87 to 1.01. Thus, using our proposed approach, the error in the measured T1 value was corrected to a level (up to 8.6%) similar to that in the absence of arrhythmia (Table 1).DISCUSSION AND CONCLUSION
Heart rate variation causes an error of up to 21.3% in T1 measurements by MOLLI with ECG-gating. Our correction method could improve the correlation coefficients of the measured T1 values and the reference T1 values, by sequentially calculating and correcting the amount of longitudinal magnetization changes according to each RR, improving the measurement accuracy of T1 values. This method could reduce the effects of heart rate variability to 8.6%, thereby minimizing the effect of arrhythmia in fast cardiac T1 mapping.Acknowledgements
NoneReferences
1. Peter Kellman, et al. T1-mapping in the heart: accuracy and precision. J Cardiovasc Magn Reson. 2014;16:2
2. Daniel R Messroghli, et al. Modified look-locker inversion recovery (MOLLI) for high- resolution T1 mapping of the heart. Magn Reson Med. 2004;52:141-146
3. Kelvin Chow, et al. Saturation recovery single-short acquisition (SASHA) for myocardial T1 mapping. Magn Reson Med. 2014;71:2082-2095
4. Shigehide Kuhara, et al. Polarity-corrected TI prep tool for delayed-enhancement MR imaging and T1 mapping. ISMRM. 2014;2447
5. Michelle Fitts, et. al. Arrhythmia insensitive rapid cardiac T1 mapping pulse sequence. Magn Reson Med. 2013;70:1274–1282
6. Thomas Kampf, et al. An analytical model which determines the apparent T1 for Modified Look-Locker Inversion Recovery—Analysis of the longitudinal relaxation under the influence of discontinuous balanced (classical MOLLI) and spoiled gradient echo readouts. Z Med Phys. 2018;28:150–157
7. Lei Zhao, et al. Systolic MOLLI T1 mapping with heart-rate-dependent pulse sequence sampling scheme is feasible in patients with atrial fibrillation. J Cardiovasc Magn Reson. 2016;18:13
Figures
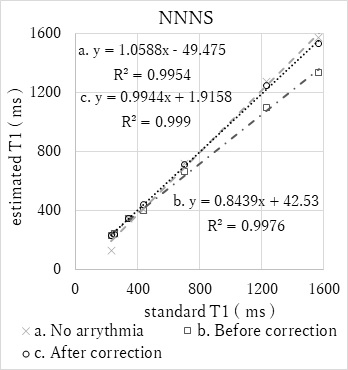
Figure 1 Comparison of the standard T1 value before and after the correction ( Arrythmia Pattern : NNNS )