2203
Comparison of room temperature, refrigerator and cryogenic storage for preservation of blood clot R2* and quantitative susceptibility values in vitro at 3T1Imaging Research Laboratories, Robarts Research Institute, Western University, London, ON, Canada, 2Dept. of Medical Biophysics, Schulich School of Medicine & Dentistry, Western University, London, ON, Canada, 3Dept. of Biochemistry, Schulich School of Medicine & Dentistry, Western University, London, ON, Canada
Synopsis
Mechanical thrombectomy therapy allows valuable stroke thrombus MR imaging studies to be completed without patient burden, but the effects of delay between retrieval and imaging on MR characteristics need to be considered. We tested the ability of room temperature, refrigerator and cryogenic storage to preserve blood clot R2* and quantitative susceptibility (QS) values up to 48 hours in vitro. Room temperature storage provided adequate preservation up to 24 hours while refrigerator storage significantly decreased R2* and QS; cryogenic storage led to non-significant decreases in R2* and QS and shows promise for complete, long-term preservation if cell lysis can be mitigated.
Introduction
MR imaging has the potential to provide valuable information towards the treatment of acute stroke including predicating thrombus composition,1 etiology2 and treatment response,3 however technique validation is challenging to perform in vivo. Mechanical thrombectomy therapy provides an opportunity to perform imaging studies of retrieved stroke thrombi without patient burden. However, delays between thrombus retrieval and scanning may lead to altered MR characteristics. To assess the scope of these effects, we investigated whether in vitro clot R2* and quantitative susceptibility (QS) values, previously shown indicators of clot composition and age,4 change over periods of up to 48 hours using simple storage strategies, and whether cryogenic freezing is a viable alternative for preserving thrombus imaging characteristics.Methods
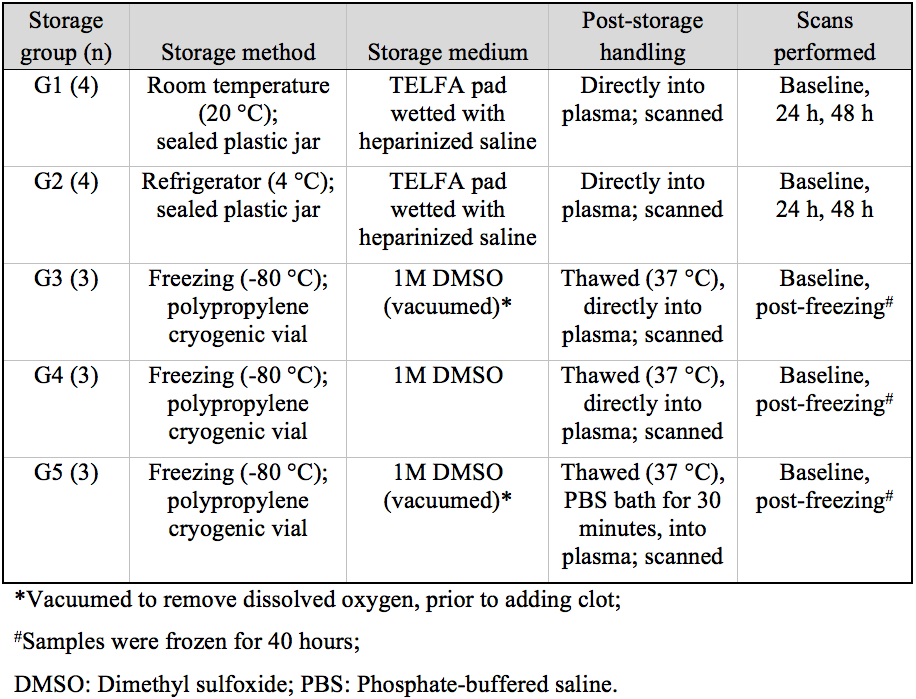
Phantom- Clots mimicking human thrombi were prepared using porcine whole blood using the Chandler loop method.5, 6 Samples were spun within 3 mm polyvinyl chloride tubing at 30 rpm for 90 minutes at room temperature, and the resultant clots were transferred into polystyrene tubes filled with porcine plasma. In order to mimic thrombus deoxygenation observed in vivo,7 tubes were placed under vacuum for 2 hours to deoxygenate red blood cells (RBCs). Tubes were sealed and inserted into an agar-filled container for a baseline scan before clots were divided into five storage groups (G1-5). Thrombus samples were stored in humid air at room temperature, refrigerated, or frozen as summarized in Table 1.
Imaging- Scans were performed at 3T with a 32-channel head-coil using a custom dual echo-train 3D GRE sequence (TE1/∆TE/TE5 = 3.20/1.46/9.04 ms, TE6/∆TE′/TE10 = 16.75/7.15/45.35 ms, TR: 47.6 ms, resolution: 0.94x0.94x1 mm3, matrix: 192x192x50, BW: 142.86 kHz, flip angle: 10°, scan time = 7 min 41 sec), which acquires in- and out-of-phase images for water-fat separation (not discussed here) and late echoes for QS and R2* mapping.8 To enable clot segmentation free of GRE blooming artifact, images were also acquired using an SSFP sequence with identical resolution and bandwidth (TE = 3 ms, TR: 6.1 ms, flip angle: 40°, phase cycles = 4).
Image post-processing- Channel-combined complex data were processed using the B0-NICE9 and MEDI QS algorithms10 to calculate R2* and QS maps, respectively.
Data analysis- Clots were segmented from the SSFP images and the ROIs were used to calculate mean R2* and QS values. Statistical analysis was performed in SPSS; one-way ANOVA was used to test associations between G1&2 clot values and storage time while paired t-tests were used to assess differences in G3-5 values pre- and post-freezing.
Results
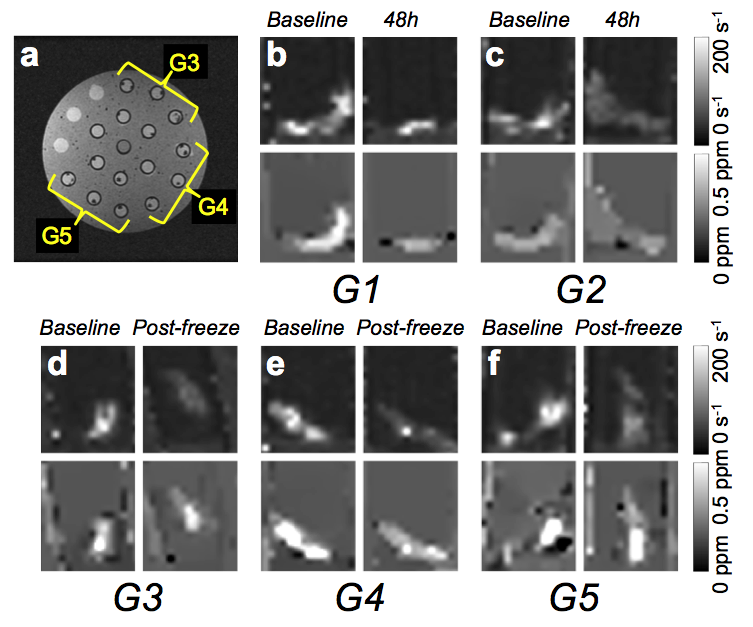
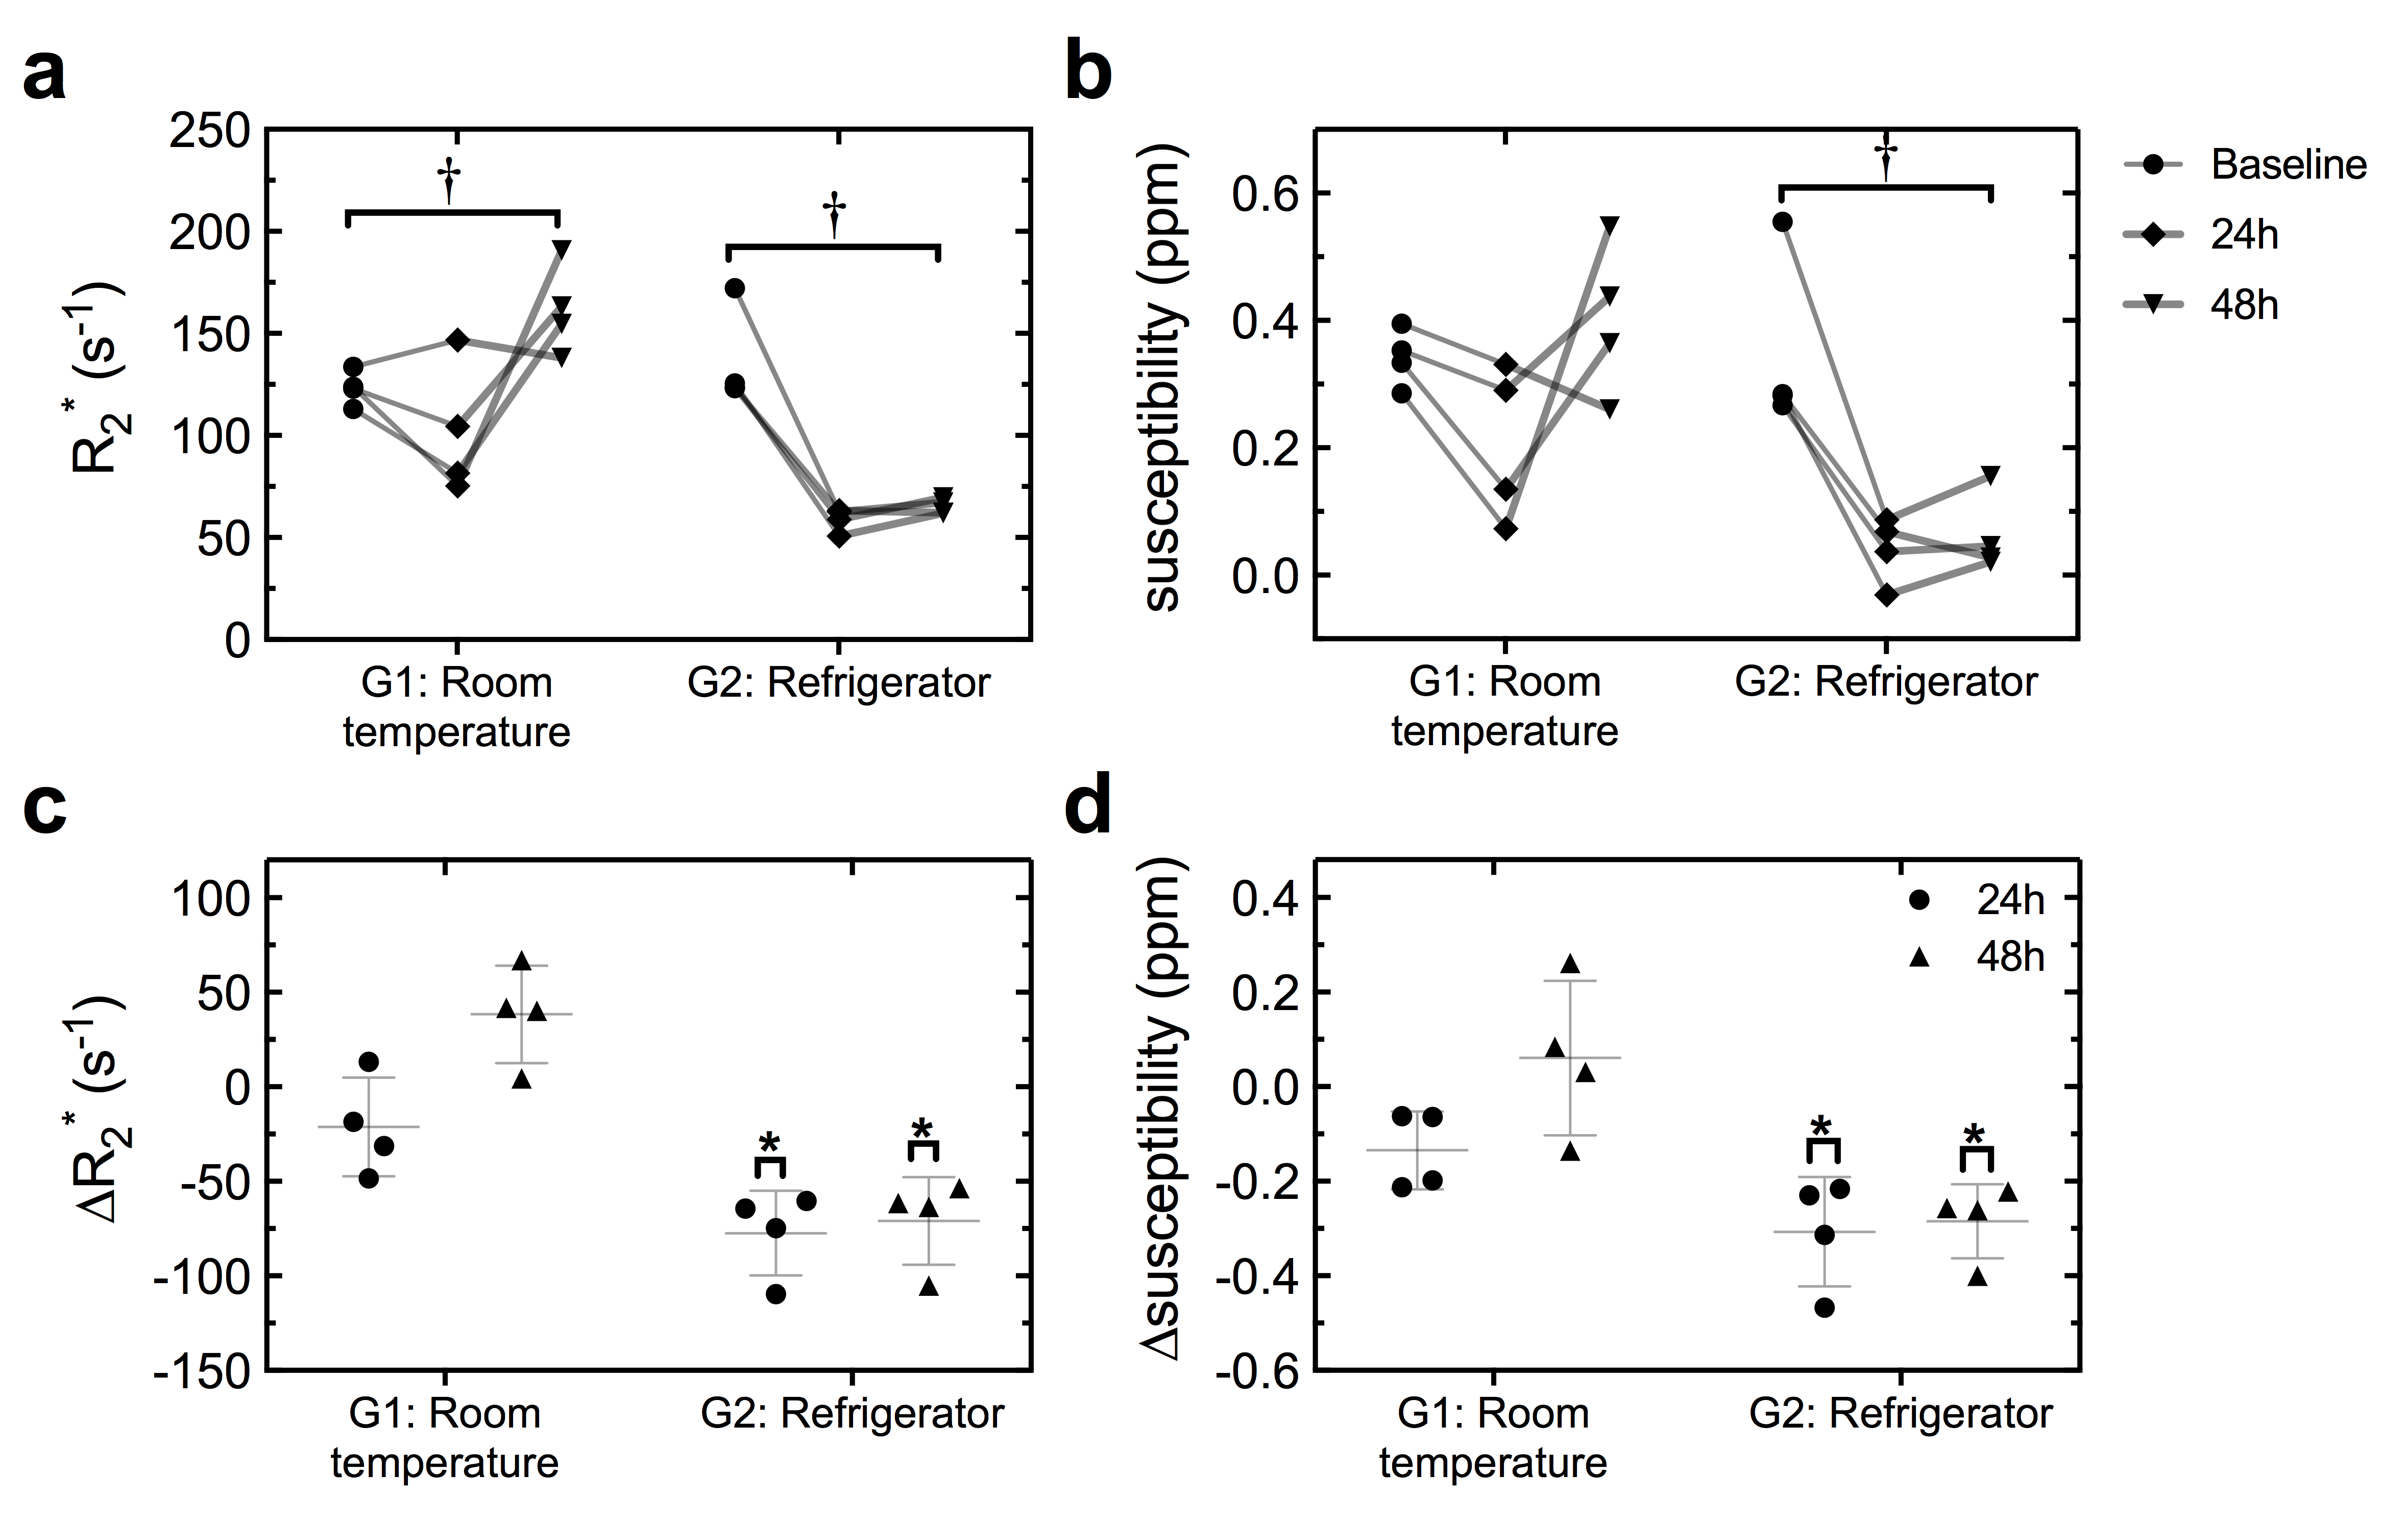
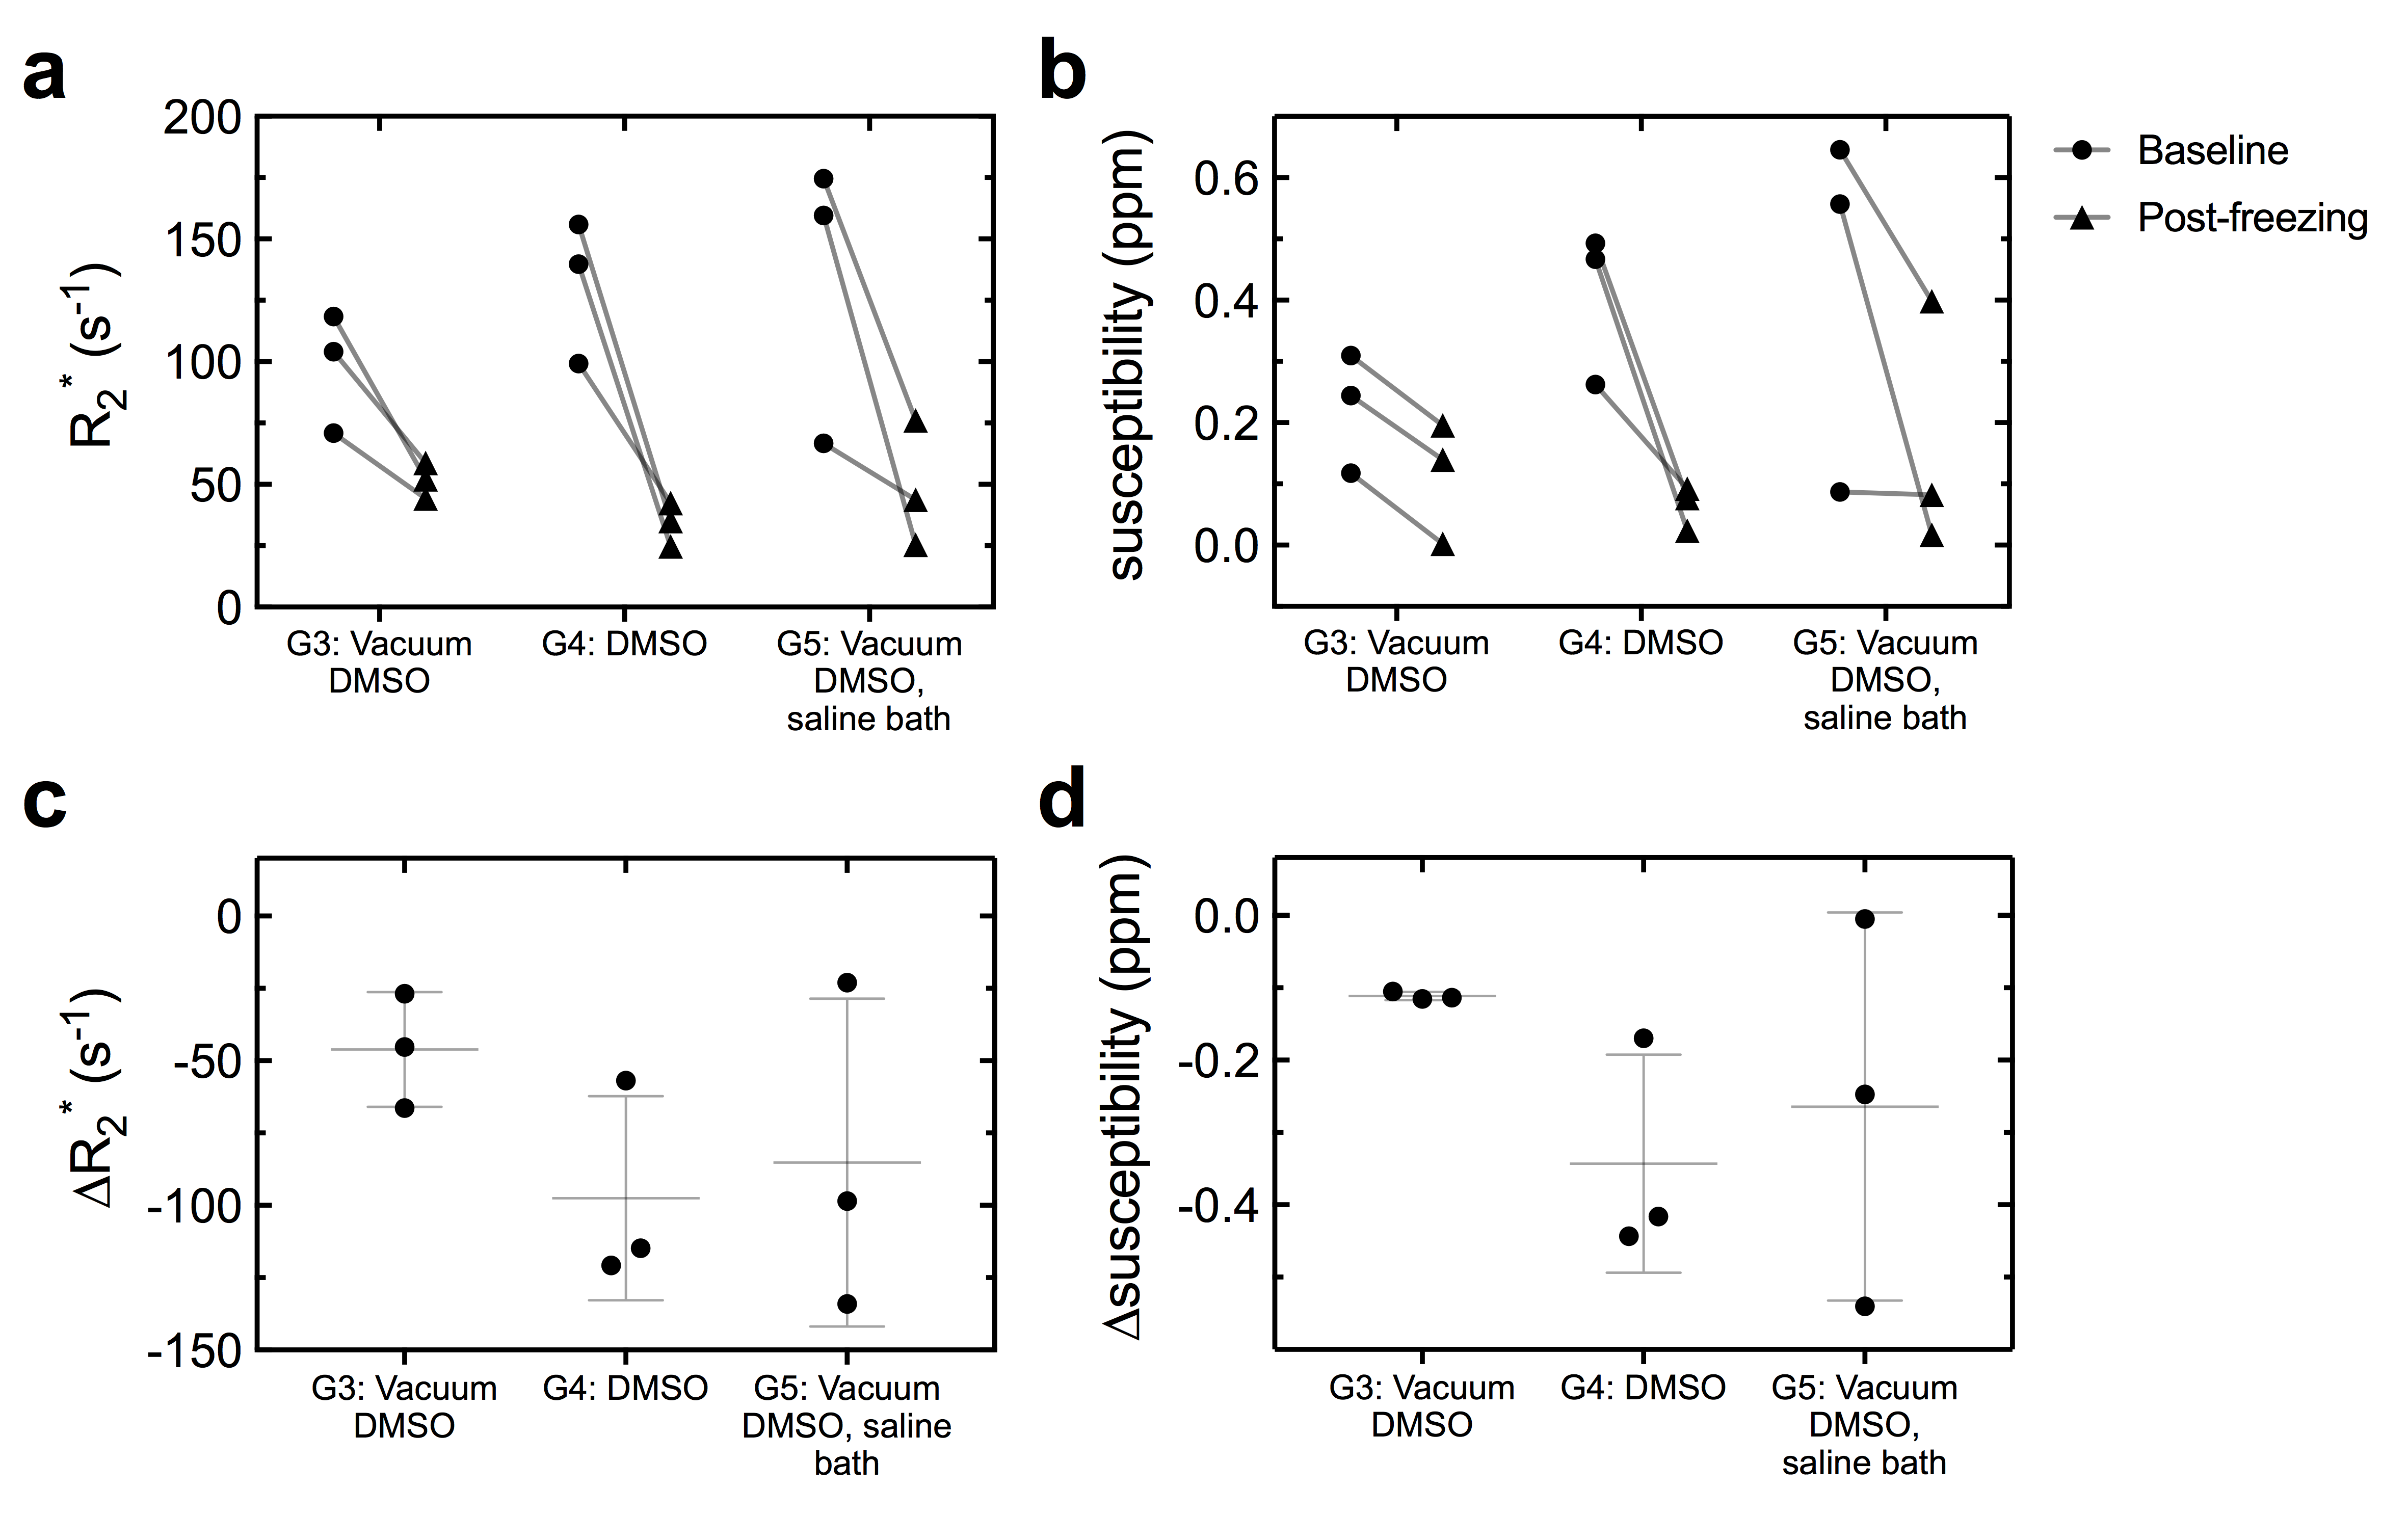
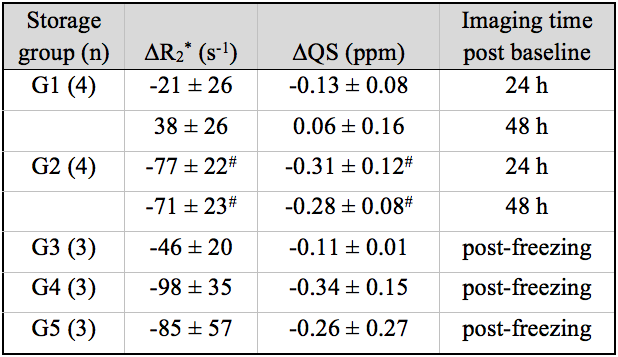
A central coronal magnitude slice of the phantom, along with corresponding R2* and QS maps of representative clots from each group at baseline and post-storage are shown in Figure 1. Individual clot R2* and QS values throughout storage, as well as their relative change from baseline are shown for G1-2 and G3-5 in Figures 2 and 3, respectively; mean group changes are listed in Table 2. Room-temperature clots (G1) experienced a small decrease in R2* and QS after 24h before an increase in both at 48h. Refrigerated clots (G2) experienced a significant decrease in both R2* and QS within 24h, which persisted to 48h. The effect of storage time on R2* was significant for both storage groups, but the effect on QS was only significant for the refrigerated clots (G2). Clots in groups 3-5 experienced non-significant decreases in R2* and QS values post freezing, the smallest occurring in G3, which was still larger than the changes observed in G1 after 24h (Table 2).Discussion
Clot R2* and QS changes occur primarily due to alterations in the RBC hemoglobin molecule. Re-oxygenation of hemoglobin upon exposure to air decreases R2* and QS values.11 Lower temperatures increase hemoglobin’s oxygen affinity,12 which likely strengthened re-oxygenation in refrigerated clots (G2). Hemoglobin also oxidizes to methemoglobin when removed from circulation, which increases R2* and QS values.7 These competing effects may explain why in clots stored at room temperature (G1) R2* values dropped before increasing at 48h. In frozen clots, re-oxygenation may occur from dissolved oxygen within the cryoprotectant and/or washout solution; G3 had the smallest decrease in R2* and QS values, suggesting that cryoprotectant vacuuming and forgoing DMSO washout limits re-oxygenation. However, R2* and QS values still decreased in this group compared to baseline; RBC lysis may be responsible.13Conclusion
Storing deoxygenated clots in a refrigerator leads to significant changes in R2* and QS within 24 hours, while room temperature storage provides moderate preservation up to 24 hours. Tested cryogenic storage strategies were less successful than room temperature storage, but may prove superior if RBC lysis is mitigated (further investigation is ongoing).Acknowledgements
The authors would like to thank Trevor Wade for implementation of the pulse sequence and Ralph Bos Meats and Mount Brydges Abattoir for providing the porcine blood. Partial funding is provided by a grant from the Canadian Institute of Health Research.References
1. Kim, S., et al., Histologic analysis of retrieved clots in acute ischemic stroke: correlation with stroke etiology and gradient-echo MRI. American Journal of Neuroradiology, 2015. 36(9): p. 1756-1762.
2. Yamamoto, N., et al., Two-Layered Susceptibility Vessel Sign on 3-Tesla T2*-Weighted Imaging Is a Predictive Biomarker of Stroke Subtype. Stroke, 2015. 46(1): p. 269-271.
3. Bourcier, R., et al., MRI quantitative T2* mapping on thrombus to predict recanalization after endovascular treatment for acute anterior ischemic stroke. Journal of Neuroradiology, 2017. 44(4): p. 241-246.
4. Christiansen, S.D., et al. Differentiation of blood clot hematocrit and age in vitro using R2* and quantitative susceptibility mapping at 3T. in Proceedings of ISMRM 2018 #3009. 2018.
5. Poole, J.C.F., A Study of Artificial Thrombi Produced by a Modification of Chandler's Method. Quarterly Journal of Experimental Physiology and Cognate Medical Sciences, 1959. 44(4): p. 377-384.
6. Robbie, L., et al., Thrombi formed in a Chandler loop mimic human arterial thrombi in structure and RAI-1 content and distribution. Thrombosis and haemostasis, 1997. 77(3): p. 510-515.
7. Bradley, W.G. and P.G. Schmidt, Effect of methemoglobin formation on the MR appearance of subarachnoid hemorrhage. Radiology, 1985. 156(1): p. 99-103.
8. Liu, J., S.D. Christiansen, and M. Drangova, Single multi-echo GRE acquisition with short and long echo spacing for simultaneous quantitative mapping of fat fraction, B0 inhomogeneity, and susceptibility. Neuroimage, 2018. 172: p. 703-717.
9. Liu, J. and M. Drangova, Method for B0 off-resonance mapping by non-iterative correction of phase-errors (B0-NICE). Magnetic Resonance in Medicine, 2015. 74(4): p. 1177-1188.
10. Liu, J., et al., Morphology enabled dipole inversion for quantitative susceptibility mapping using structural consistency between the magnitude image and the susceptibility map. NeuroImage, 2012. 59(3): p. 2560-2568.
11. Jain, V., et al., Investigating the magnetic susceptibility properties of fresh human blood for noninvasive oxygen saturation quantification. Magnetic Resonance in Medicine, 2012. 68(3): p. 863-867.
12. Knowles, T.P., et al., Effects of Syringe Material, Sample Storage Time, and Temperature on Blood Gases and Oxygen Saturation in Arterialized Human Blood Samples. Respiratory Care, 2006. 51(7): p. 732-736.
13. Colgan, T.J., et al. Sensitivity of relaxometry and quantitative susceptibility mapping to microscopic iron distribution. in Proceedings of ISMRM 2018 #0196. 2018.
Figures