2200
Impact of temporal resolution on the quantification of myocardial perfusion in dynamic-contrast enhanced MRIXenios Milidonis1, Muhummad Sohaib Nazir1, Russell Franks1, and Amedeo Chiribiri1
1School of Biomedical Engineering and Imaging Sciences, King's College London, London, United Kingdom
Synopsis
Quantification of myocardial perfusion using dynamic contrast enhanced imaging provides an objective and sensitive assessment of coronary artery disease in the clinic. While many factors were found to affect the accuracy of perfusion estimates, there has been little evidence on the impact of temporal resolution. This study sheds light on this using simulated, phantom and clinical data. Simulations and phantom experiments demonstrate large deviations between measurements when the same data are sampled with different temporal resolutions, while interpolation of clinical data to uniform temporal resolution leads to significantly different perfusion rates.
Introduction
Dynamic contrast-enhanced (DCE) MRI is performed with the use of pulse sequences that synchronize the acquisition of each dynamic image with the patient’s heart rate. Nevertheless, different patients and different types of experiments (rest versus vasodilatory stress imaging) exhibit variable heart rates that directly influence the sparsity of data. Typically, the unprocessed data are used directly for the measurement of myocardial perfusion, but few studies reported the use of interpolation methods to resample the data in fixed but not standardized time intervals. The temporal resolution of the scan has a direct effect on data discretization in deconvolution analysis and the subsequent estimation of the myocardial impulse response function, from which the perfusion rate is obtained. Consequently, this may skew perfusion measurements and affect clinical diagnosis. This is the first study to examine this hypothesis using numerical simulations, experiments with a dynamic phantom mimicking myocardial first-pass perfusion and patient imaging to determine the impact of temporal resolution on estimated perfusion rates.Methods
Dynamic perfusion data with physiological transit times were simulated as described before.1,2 Specifically, an arterial input function (AIF) was generated by convolving a delta function with exponential decay functions and myocardial signal intensity (SI) curves were produced using the Fermi function to provide ground truth perfusion rates 1, 2, 3, 4 and 5 mL/g/min for a heart rate (HR) of 60 bpm (1 dynamic/sec). The same continuous functions were resampled at different time points to simulate data for 4 other HR: 30, 90, 120 and 150 bpm. Random Rician noise was added to simulate realistic contrast-to-noise ratios of 30 and 10 for the AIF and myocardial signals respectively, producing 1000 curves for each combination of perfusion rate and HR. Dual-bolus DCE-MRI experiments were performed with a calibrated cardiac phantom.3,4 The phantom was scanned on a 3T Siemens Biograph mMR scanner using an ECG-triggered saturation recovery TurboFLASH sequence (TR 2.1 ms, TE 1.1 ms, TI 100 ms, 10° flip angle, 1 average, 192×144 matrix, 1.46×1.46 mm2 resolution, 8 mm slice thickness). Imaging was repeated 3 times for a fixed cardiac output (3 L/min) and myocardial perfusion rate (3 mL/g/min) for 3 different simulated HR: 60, 90, 120 bpm. Additionally, dual-bolus rest scans from 5 patients with established coronary artery disease were used. Patients gave written consent for their data to be analyzed in this study (ethics approval 15/NS/0030). Perfusion rate was quantified in all data without prior treatment for temporal resolution using optimized Fermi model-based deconvolution.5,6 Data were re-analyzed following piecewise cubic Hermite interpolation7, to a fixed HR of 60 bpm. Perfusion rate was also measured on simulated and phantom data by scaling the values obtained from non-interpolated data with the ratio of true and reference heart rate of 60 bpm. A paired two-sample t-test was used to compare the mean perfusion rate (in all 3 slices) in non-interpolated and interpolated patient data. Statistical significance was set at p < 0.05.Results
Simulations show that perfusion rate is overestimated for lower HR (lower temporal resolution) and underestimated for higher temporal resolution when data are quantified without prior interpolation to the reference rate (Figure 1). For example, percentage errors range between -32.9% (5 mL/g/min) and -34.5% (1 mL/g/min) for a realistic 90 bpm. These are reduced to -11.2% and -6.2% respectively following data interpolation, or 0.7% to -1.7% respectively following scaling of estimated perfusion rates. A similar pattern was seen on phantom measurements (Figure 2). However, scaling of perfusion rates proved to be an equivalent correction method to data interpolation (for 90 bpm, the mean error of -44.7% was reduced to -17.8% and -17.1% for interpolation and scaling respectively). The mean and standard deviation of perfusion rate in clinical non-interpolated and interpolated data was 0.56 ± 0.16 mL/g/min and 0.67 ± 0.20 mL/g/min respectively, estimates that were significantly different (p = 0.036). Figure 3 shows the effect of data interpolation on an example case.Conclusion
The temporal resolution of DCE-MRI has a significant impact on estimated perfusion rates. Scaling of perfusion estimates based on HR alone does not provide perfect correction as the effect is non-linear. It is believed that all common quantification models requiring data discretization assuming fixed time intervals would be similarly affected. However, further studies are needed to prove this assumption and determine the optimal temporal resolution ensuring accurate quantification for each model. Future work will focus on the evaluation of other data interpolation methods, as well as examining the impact on stress imaging, during which HR is typically higher and thus larger perfusion differences are expected.Acknowledgements
This work was supported by the EMPIR project 15HLT05 PerfusImaging. The EMPIR initiative is co-funded by the European Union's Horizon 2020 research and innovation programme and the EMPIR Participating States. The authors acknowledge financial support from the Department of Health through the National Institute for Health Research (NIHR) comprehensive Biomedical Research Centre award to Guy’s & St Thomas’ NHS Foundation Trust in partnership with King’s College London and King’s College NHS Foundation Trust and by the NIHR Healthcare Technology Co-operative for Cardiovascular Disease at Guy’s and St Thomas’ NHS Foundation Trust. This work was supported by the Wellcome/EPSRC Centre for Medical Engineering [WT 203148/Z/16/Z]. MSN was funded by the UK Medical Research Council under grant number MR/P01979X/1. The views expressed are those of the authors and not necessarily those of the NHS, the NIHR, the DoH, EPSRC, MRC or the Wellcome Trust.References
- Keeling SL, Kogler T, Stollberger R. Deconvolution for DCE-MRI using an exponential approximation basis. Med Image Anal. 2009;13(1):80-90.
- Zarinabad N, Chiribiri A, Hautvast GL, et al. Voxel-wise quantification of myocardial perfusion by cardiac magnetic resonance. Feasibility and methods comparison. Magn Reson Med. 2012;68(6):1994-2004.
- Chiribiri A, Schuster A, Ishida M, et al. Perfusion phantom: An efficient and reproducible method to simulate myocardial first-pass perfusion measurements with cardiovascular magnetic resonance. Magn Reson Med. 2013;69(3):698-707.
- Milidonis X, Nazir MS, Capstick M, et al. Dynamic contrast-enhanced and phase contrast MRI of a novel 3D printed cardiac phantom mimicking transmural myocardial perfusion gradients. Proceedings of the Joint Annual Meeting of the ISMRM-ESMRMB. Paris, 2018.
- Jerosch-Herold M, Wilke N, Stillman AE. Magnetic resonance quantification of the myocardial perfusion reserve with a Fermi function model for constrained deconvolution. Med Phys. 1998;25(1):73-84.
- Zarinabad N, Hautvast GL, Sammut E, et al. Effects of tracer arrival time on the accuracy of high-resolution (voxel-wise) myocardial perfusion maps from contrast-enhanced first-pass perfusion magnetic resonance. IEEE Trans Biomed Eng. 2014;61(9):2499-506.
- Biglands JD, Magee DR, Sourbron SP, et al. Comparison of the Diagnostic Performance of Four Quantitative Myocardial Perfusion Estimation Methods Used in Cardiac MR Imaging: CE-MARC Substudy. Radiology. 2015;275(2):393-402.
Figures
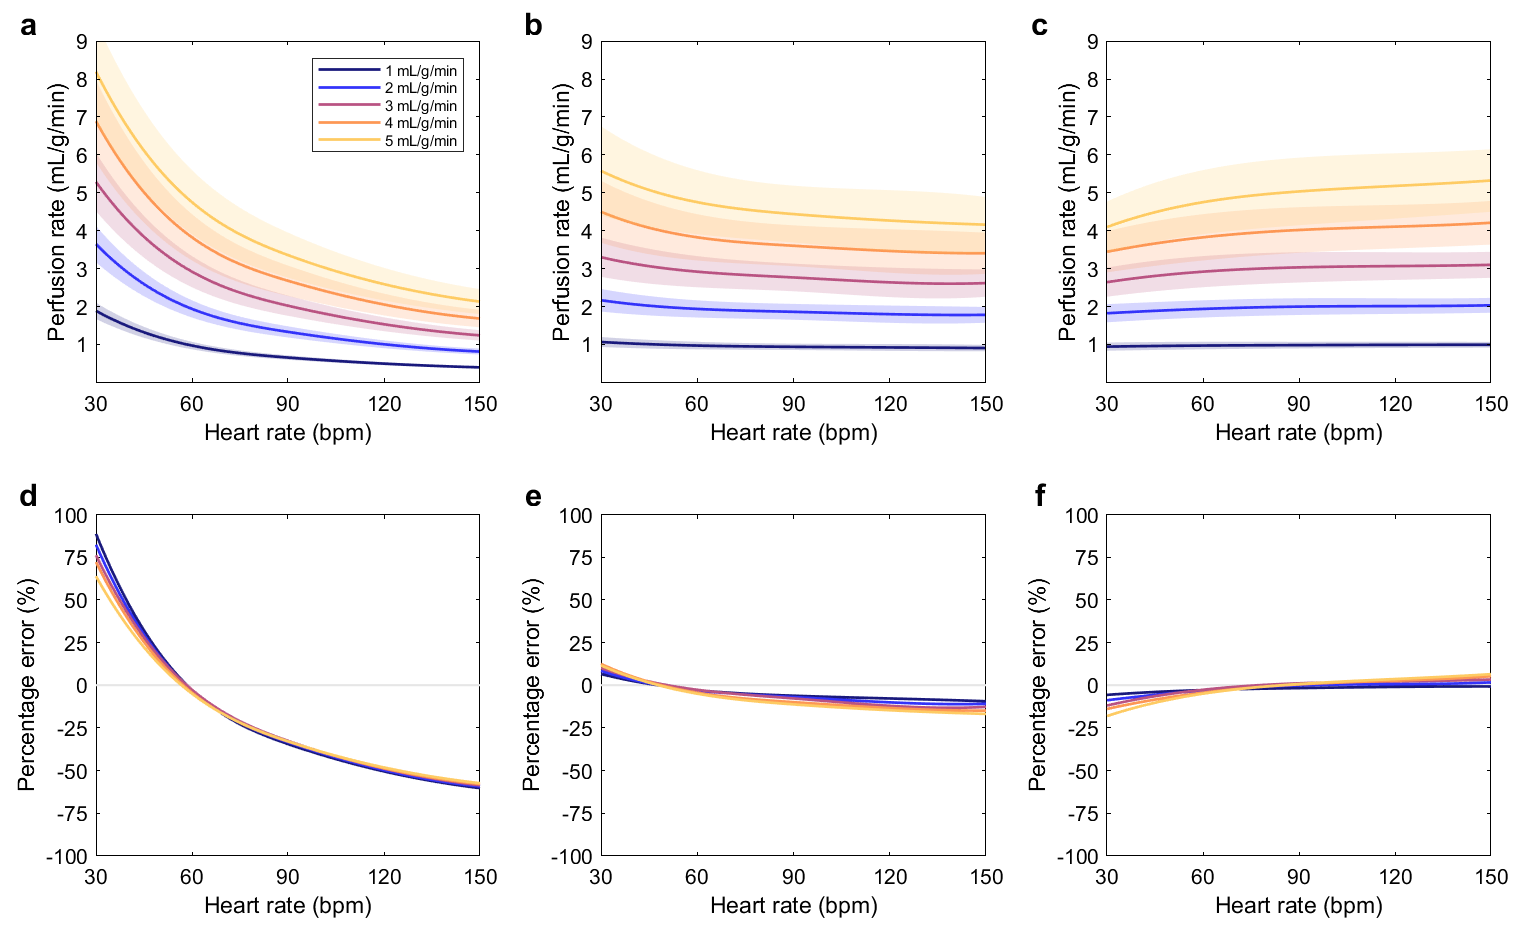
Figure 1. Perfusion
rates estimated using simulated data for different heart rates (HR) and true
perfusion rates. The lines indicate the mean estimate and the shaded areas the
standard deviation (SD). Cubic spline fitting was used to generate continuous
curves for each perfusion rate. Plot (a) shows the results for no data
interpolation before quantification, (b) the results after interpolation, and
(c) the results for scaling (of values in (a)) using the ratio of true and
reference HR of 60 bpm. The corresponding percentage error of estimates is
shown in (d, e, f) without its SD for clarity.
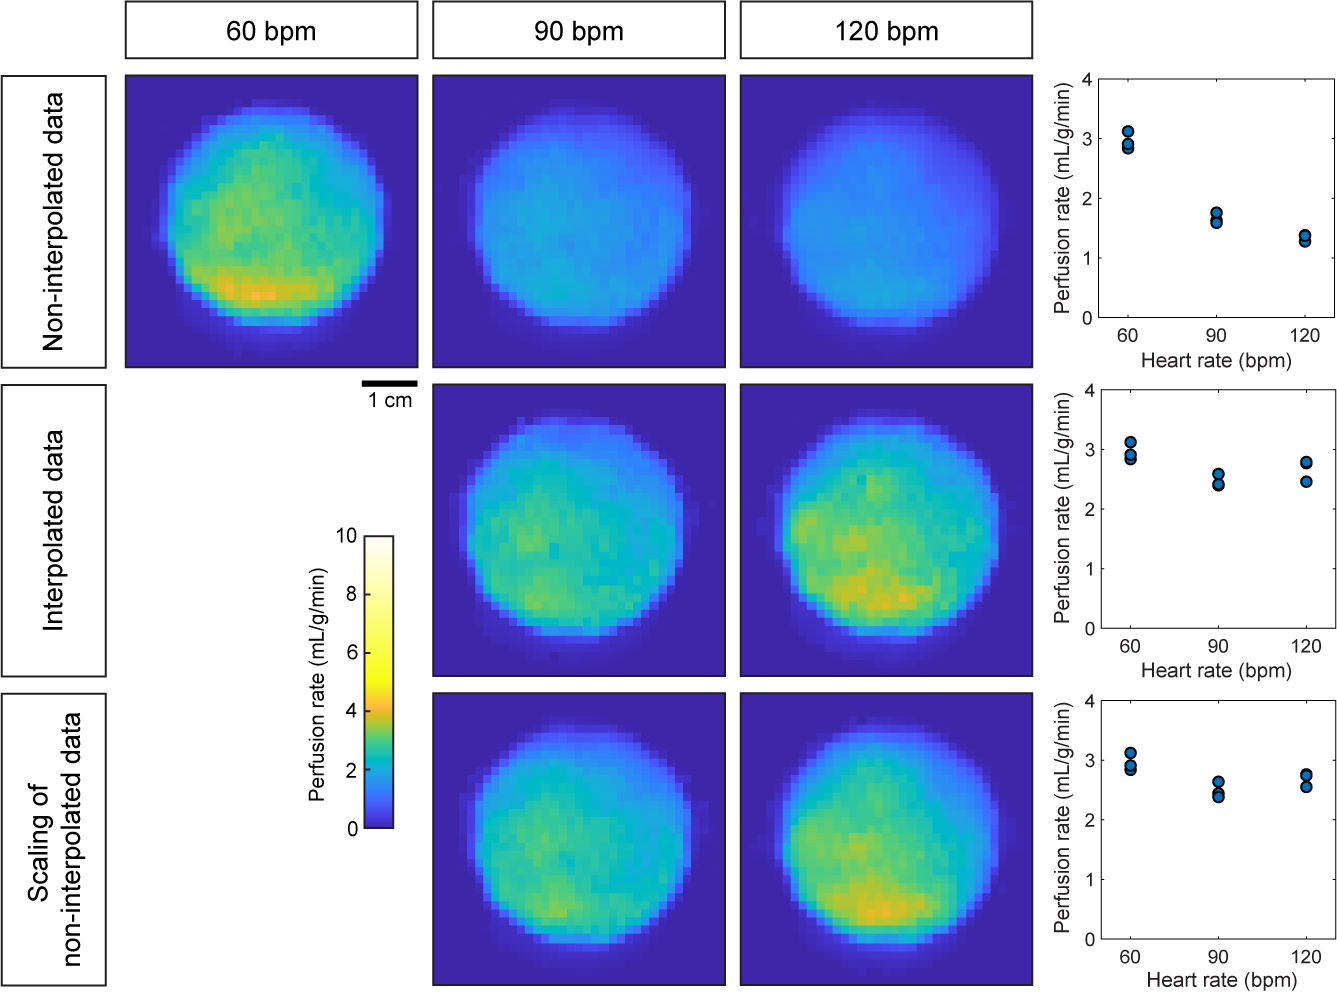
Figure 2. Example
perfusion rate maps for DCE-MRI scans of the synthetic myocardium of the
perfusion phantom acquired with 3 different simulated heart rates (HR). Maps
were also generated following data interpolation and by scaling the original
maps (in first row). The plots on the right-hand side show the mean estimates
of myocardial perfusion rate for all 3 scans per simulated HR.
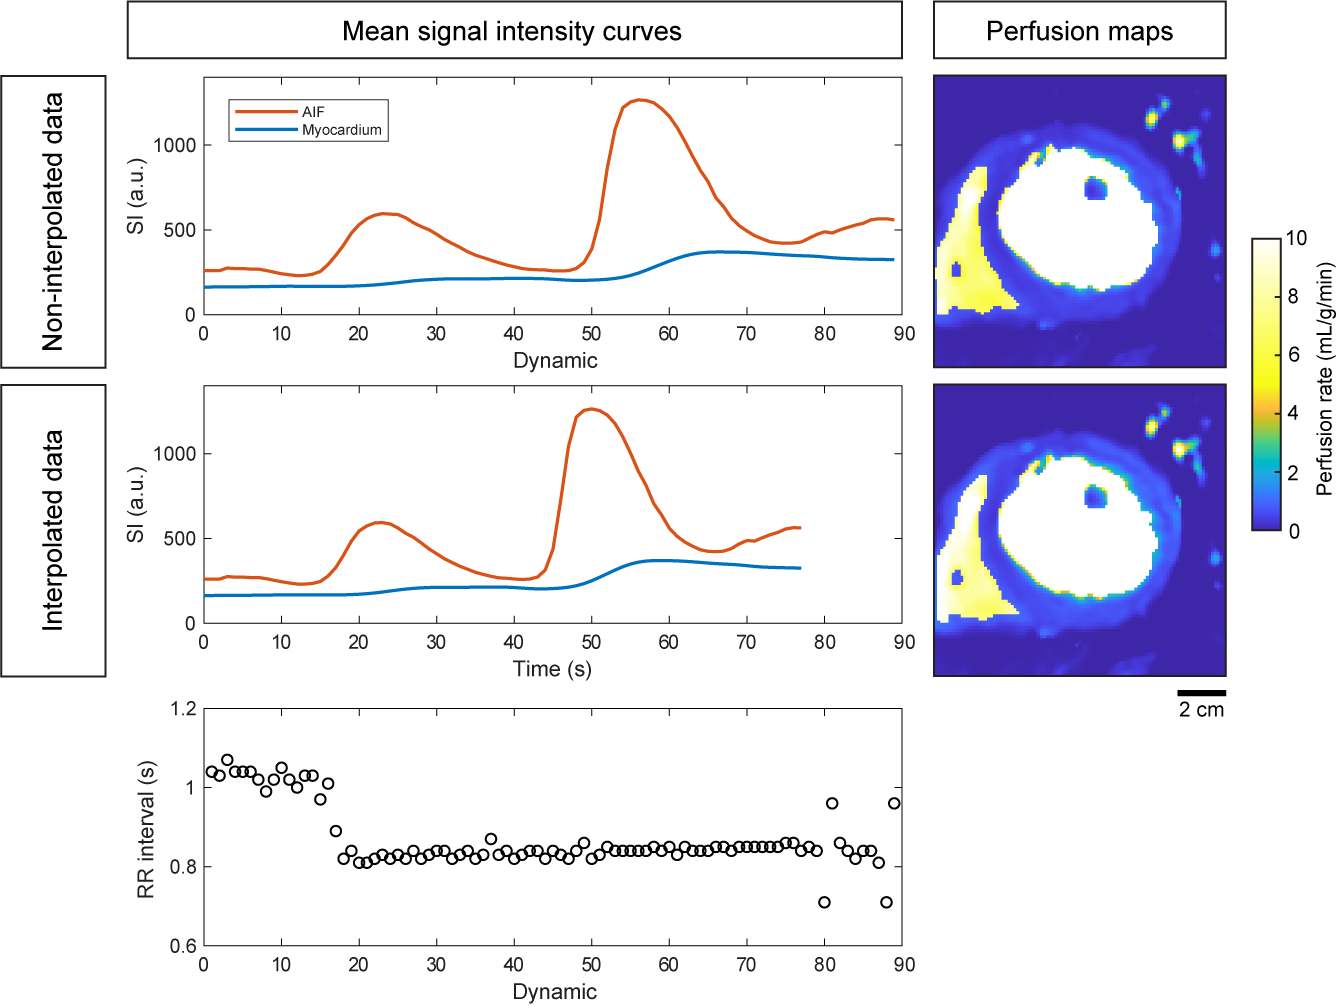
Figure 3. Effect
of data interpolation on clinical signal intensity (SI) curves and perfusion
rate maps. The basal slice of a dual-bolus rest DCE-MRI scan of a patient with
perfusion defects in the anterior, anteroseptal and inferoseptal segments is
shown. The median heart rate is 71.4 bpm (plot of RR interval per dynamic shown
at the bottom), causing an increase in mean perfusion rate from 0.54 mL/g/min
to 0.66 mL/g/min following data interpolation. While the apparent difference in
perfusion maps is usually small, interpolation may improve the delineation of
defects and thus the diagnostic accuracy.