2199
Extended Quantitative Cardiac First-Pass Perfusion Imaging in Mice Using Accelerated Data Acquisition and Spatially Distributed, Two-Compartment Exchange Modelling1Institute for Biomedical Engineering, ETH & University of Zurich, Zurich, Switzerland
Synopsis
The objective of the present work was to improve data acquisition and quantification of first pass perfusion imaging in the in-vivo murine heart. Undersampled data were acquired and reconstructed using k-t SPARSE. A two-compartment exchange model was employed to provide an additional characterization of myocardial tissue based on compartment volumes and the permeability surface area product. The feasibility of the proposed method was tested using perfusions analysis of first-pass perfusion data acquired with extracellular and intravascular contrast agents in mice. The results presented here show that two-compartment exchange modelling in the in-vivo murine heart is feasible and gives access to tissue parameters beyond myocardial blood flow.
Introduction
Firs-pass, gadolinium-enhanced, perfusion MRI (FPP) is a well-established imaging methodology for the assessment of myocardial blood flow1. FPP relies on dynamic MR imaging following administration of a bolus of a contrast agent (CA). A number of different kinetic models2 have been proposed for the analysis of CA uptake with the aim of a quantitative description of myocardial perfusion, Fp [ml/g/min]. The most common approach is based on the direct numerical deconvolution of the data with a Fermi function assuming a single passage of the CA3. As such, the data fitting is obtained using only the initial data points sampled during contrast uptake (first pass) and later contrast dynamics are omitted. A more general approach to analyse the myocardial uptake is to explicitly assume an exchange of CA between compartments with specific volumes (i.e. blood volume Vb and interstitial volume Visf) through a permeable membrane (characterized by the microvessel permeability-surface area product, PS) as used in4,5. Accordingly, the full data set of myocardial CA uptake and distribution) can be exploited for comprehensive tissue characterization.Methods
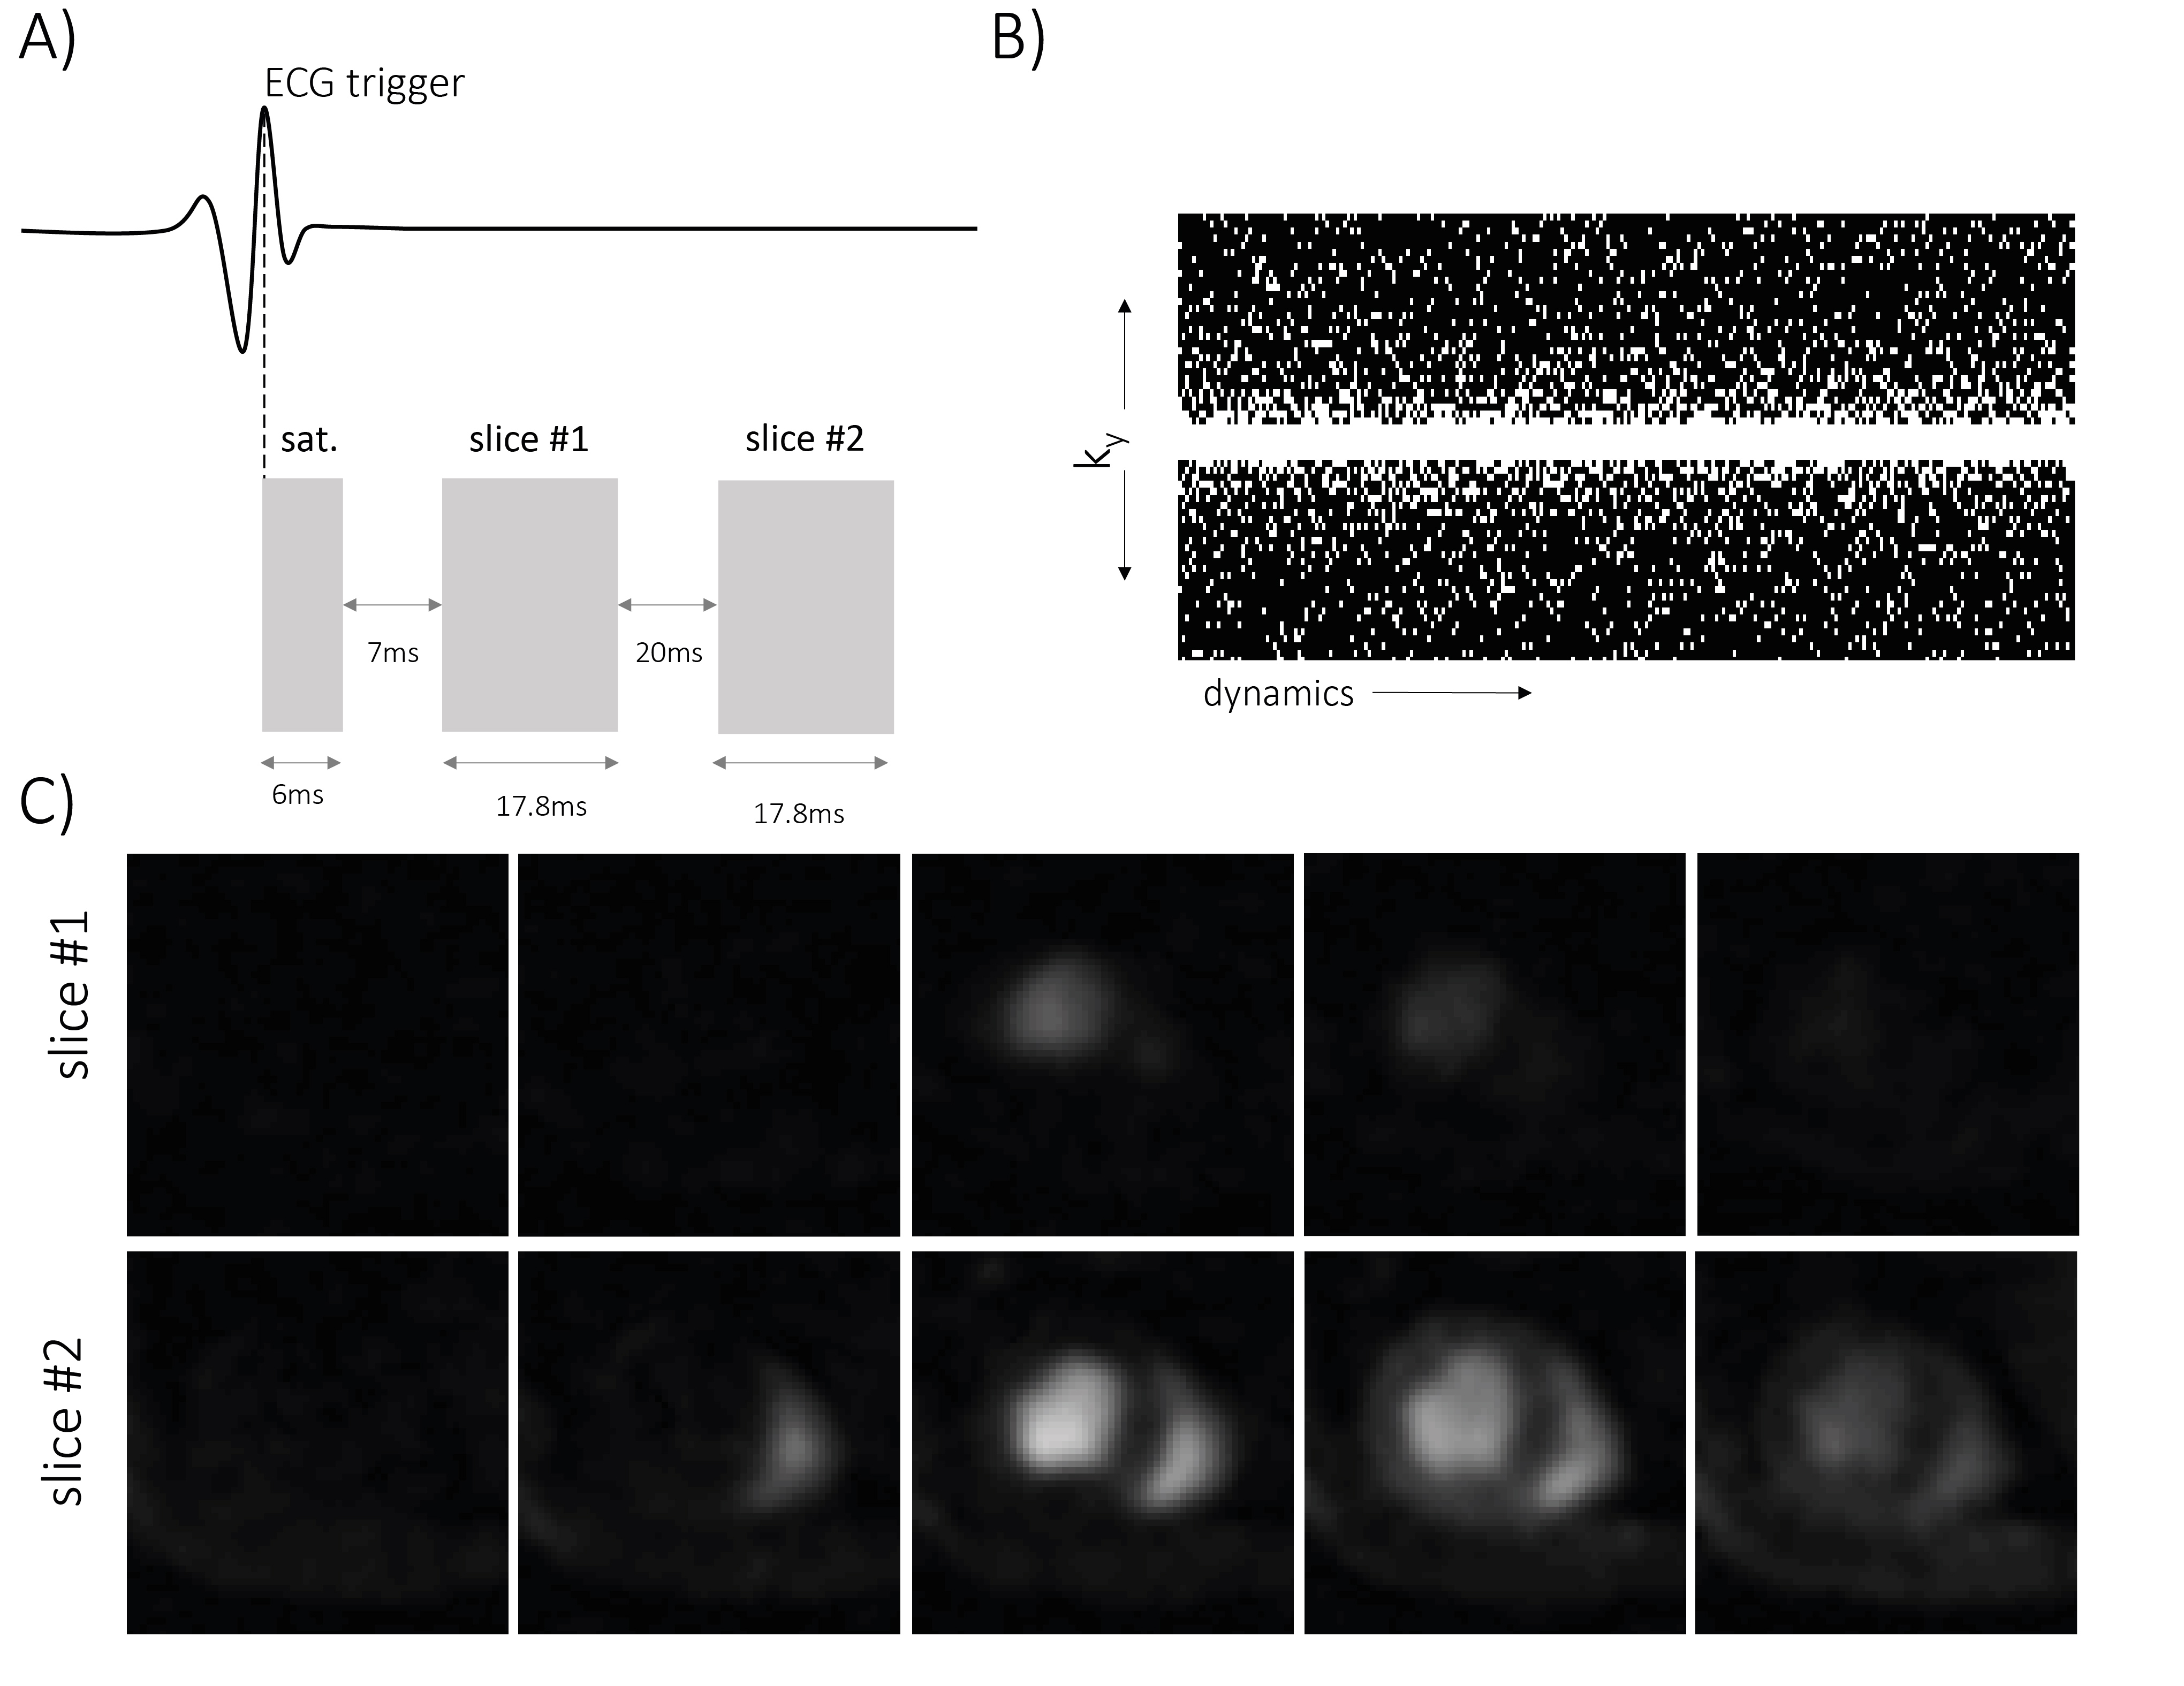
Data acquisition: All MR experiment were recorded with a 9.4 T small animal MRI scanner (Bruker BioSpec, Ettlingen, Germany). A dual-contrast, saturation-recovery gradient-echo sequence with a Cartesian read-out and data undersampling with R=4 was used6.The sequence consists of a saturation block based on a hyperbolic scent pulse triggered to an ECG derived R-wave, followed by an acquisition of two, mid-ventricular, short axis slices. Each slice was segmented into 2x8 phase encoding steps acquired over two consecutive heartbeats. The first slice with a recovery time t=15.9 ms was used for arterial input function (AIF) estimation, while the second slice with a recovery time t=53.7 ms was used for myocardial uptake estimation. Imaging parameters were as follows: field-of-view (FOV) = 20x20 mm2, in-plane resolution 0.31x0.31 mm2, echo time/repetition time (TE/TR) = 0.89/2.3 ms, acquisition matrix = 64x16, reconstruction matrix = 64x64, zero filled to 192x192, slice thickness = 1.2 mm, number of dynamics = 128.
Animal handling: All animal experiments were performed with adherence to the Swiss Federal Act on Animal Protection and were approved by the Cantonal Veterinary Office Zurich. A total of 14 female C57/BL6 mice were studied. Contrast agents (Gadovist/Vasovist, Bayer AG, Switzerland), were administrated using a syringe pump (Harvard PHD 2000, Harvard Apparatus, Holliston, Massachusetts, US). The injection speed was 2 ml/min and the injection volume was 100 μl.
Data reconstruction & analysis: All data reconstruction and analysis was performed in MATLAB (The Mathworks, Natick, MA, USA) using in-house developed software. The acquired undersampled data were reconstructed using k-t SPARSE7. Analysis with Fermi deconvolution was based as described previously3. The two-compartment exchange model (2CX) was fitted based on a solution to the following set of differential equations8:
$$\frac{C_{p}}{dt}=\frac{F_{p}}{V_{p}}(C_{in}-C_{p})-\frac{PS}{V_{p}}(C_{p}-C_{isf})$$
$$\frac{C_{isf}}{dt}=\frac{PS}{V_{isf}}(C_{p}-C_{isf})$$
Here, Cin represents the measured arterial input function (measured as a CA concentration change in the left ventricle (LV)), Cp/Vp and Cisf/Visf are the concentrations/volumes in each compartment and PS denotes the permeability surface-area product.
Results
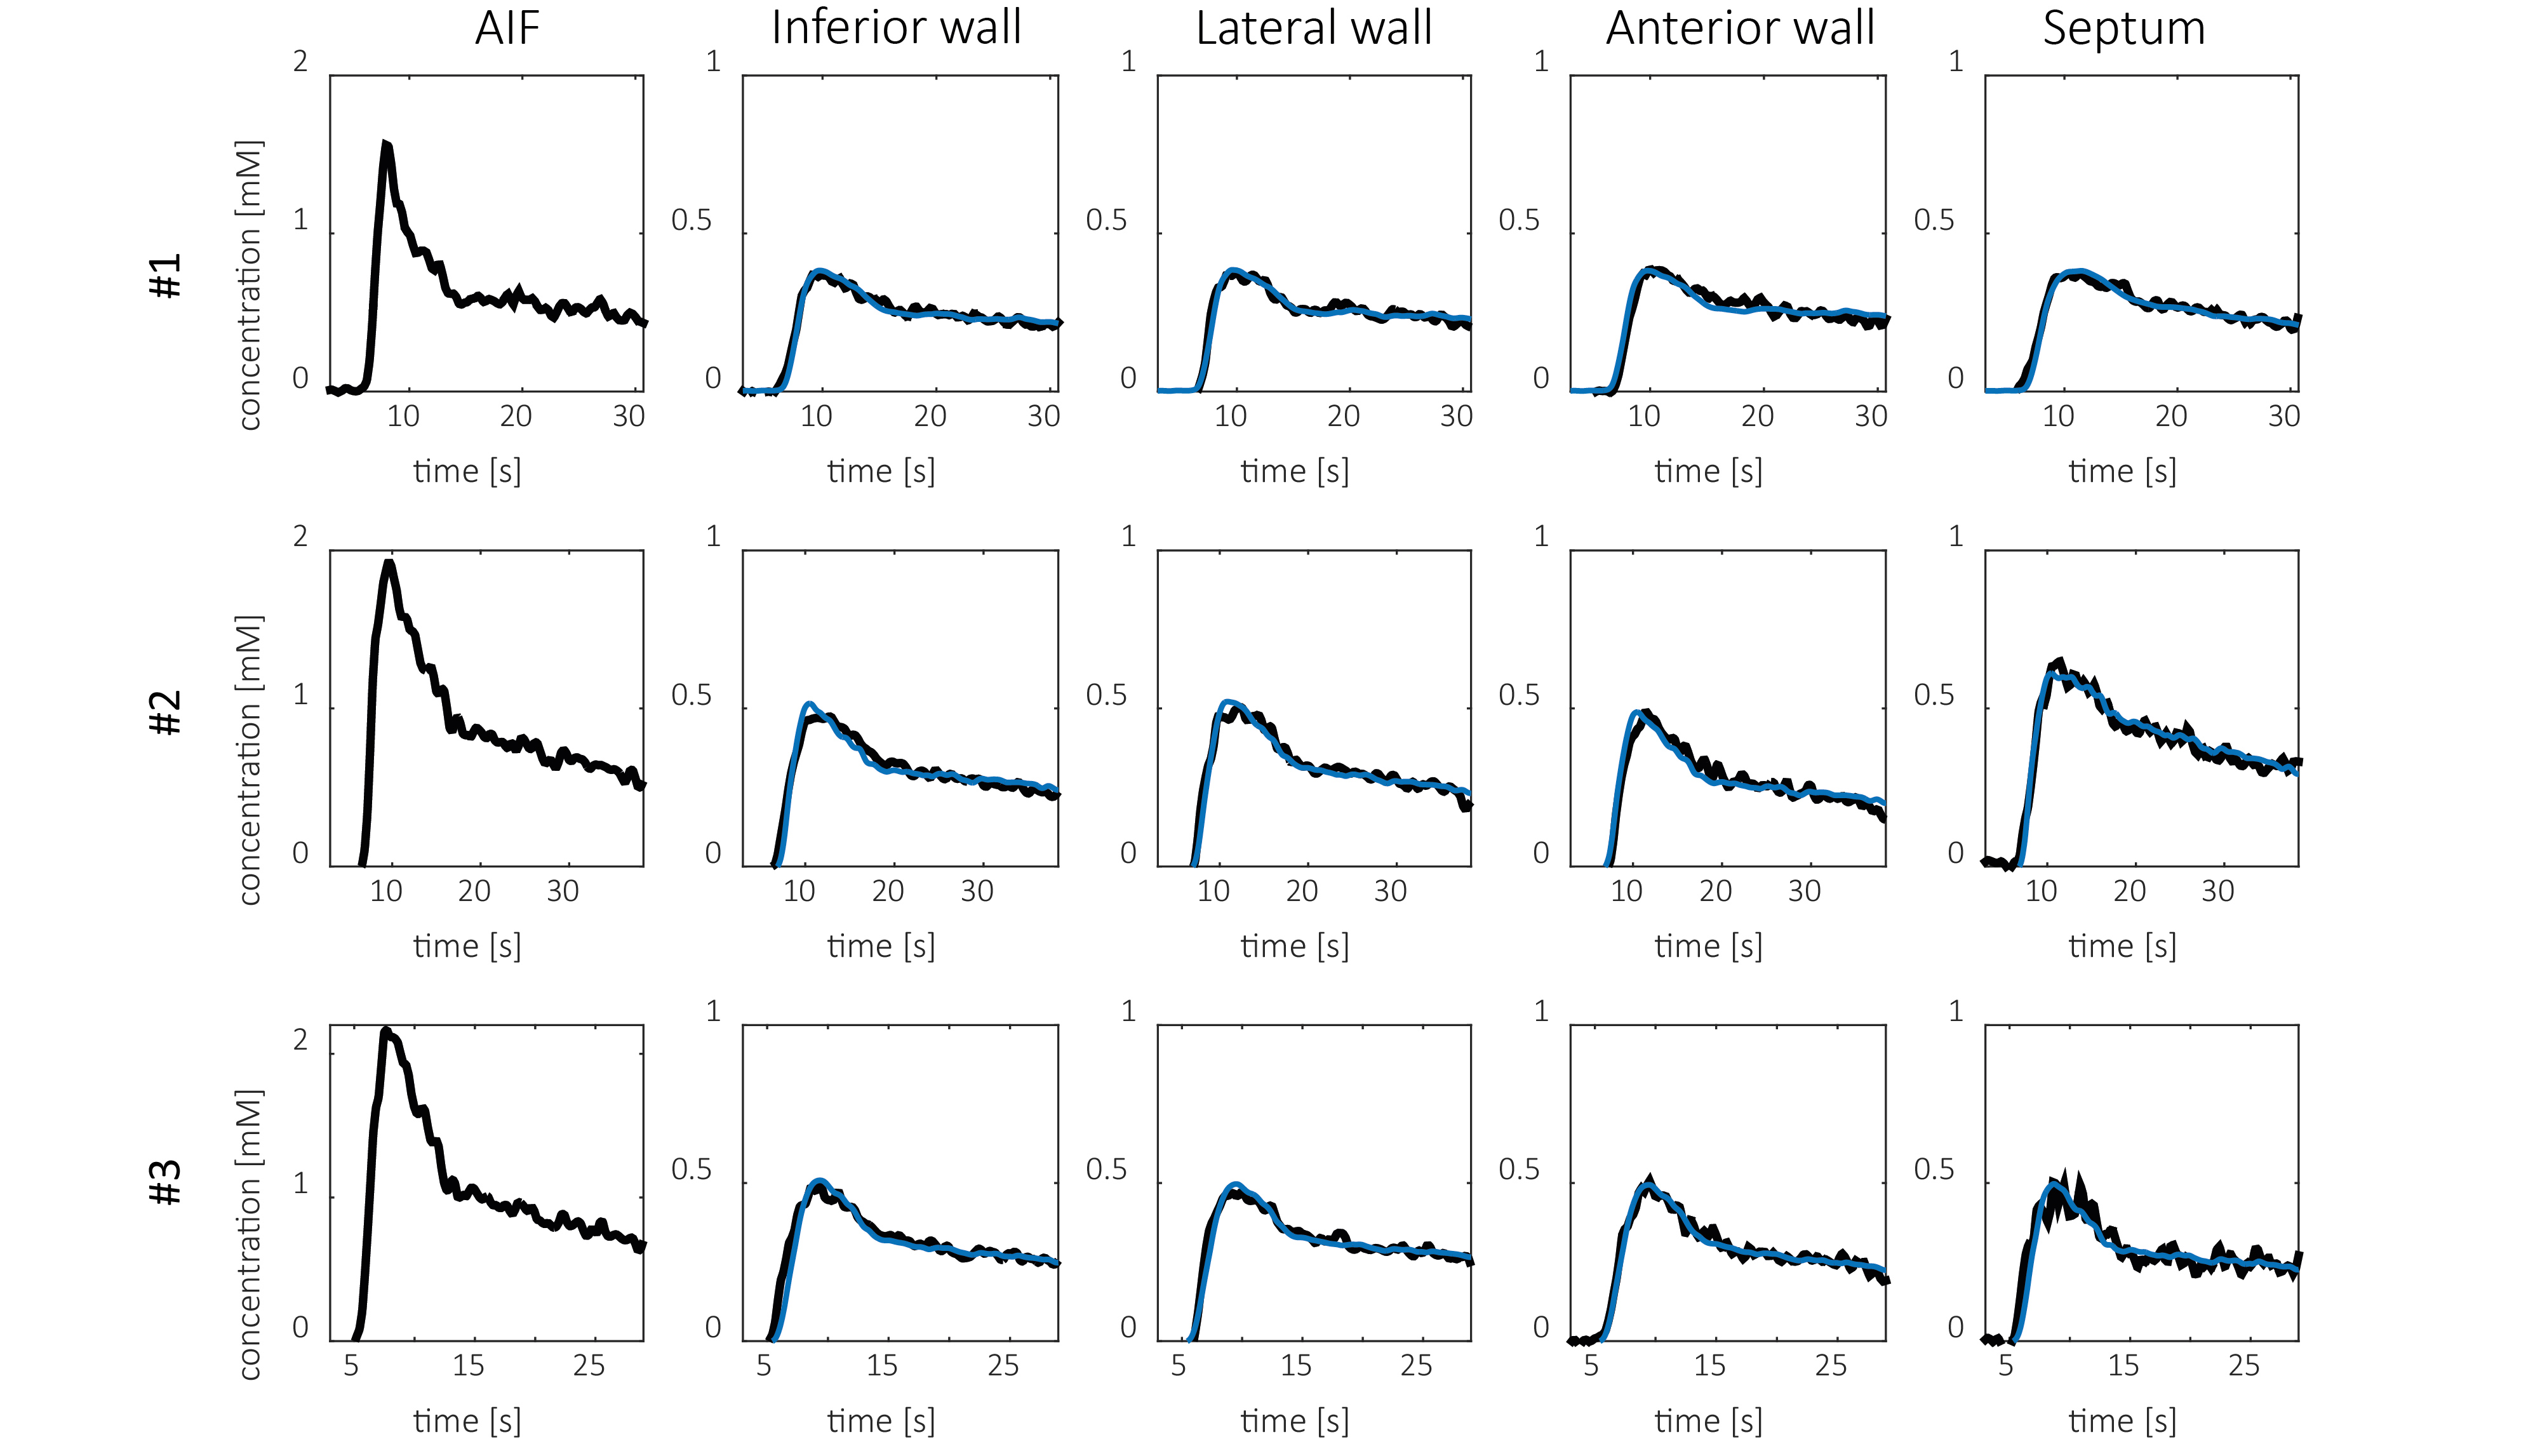
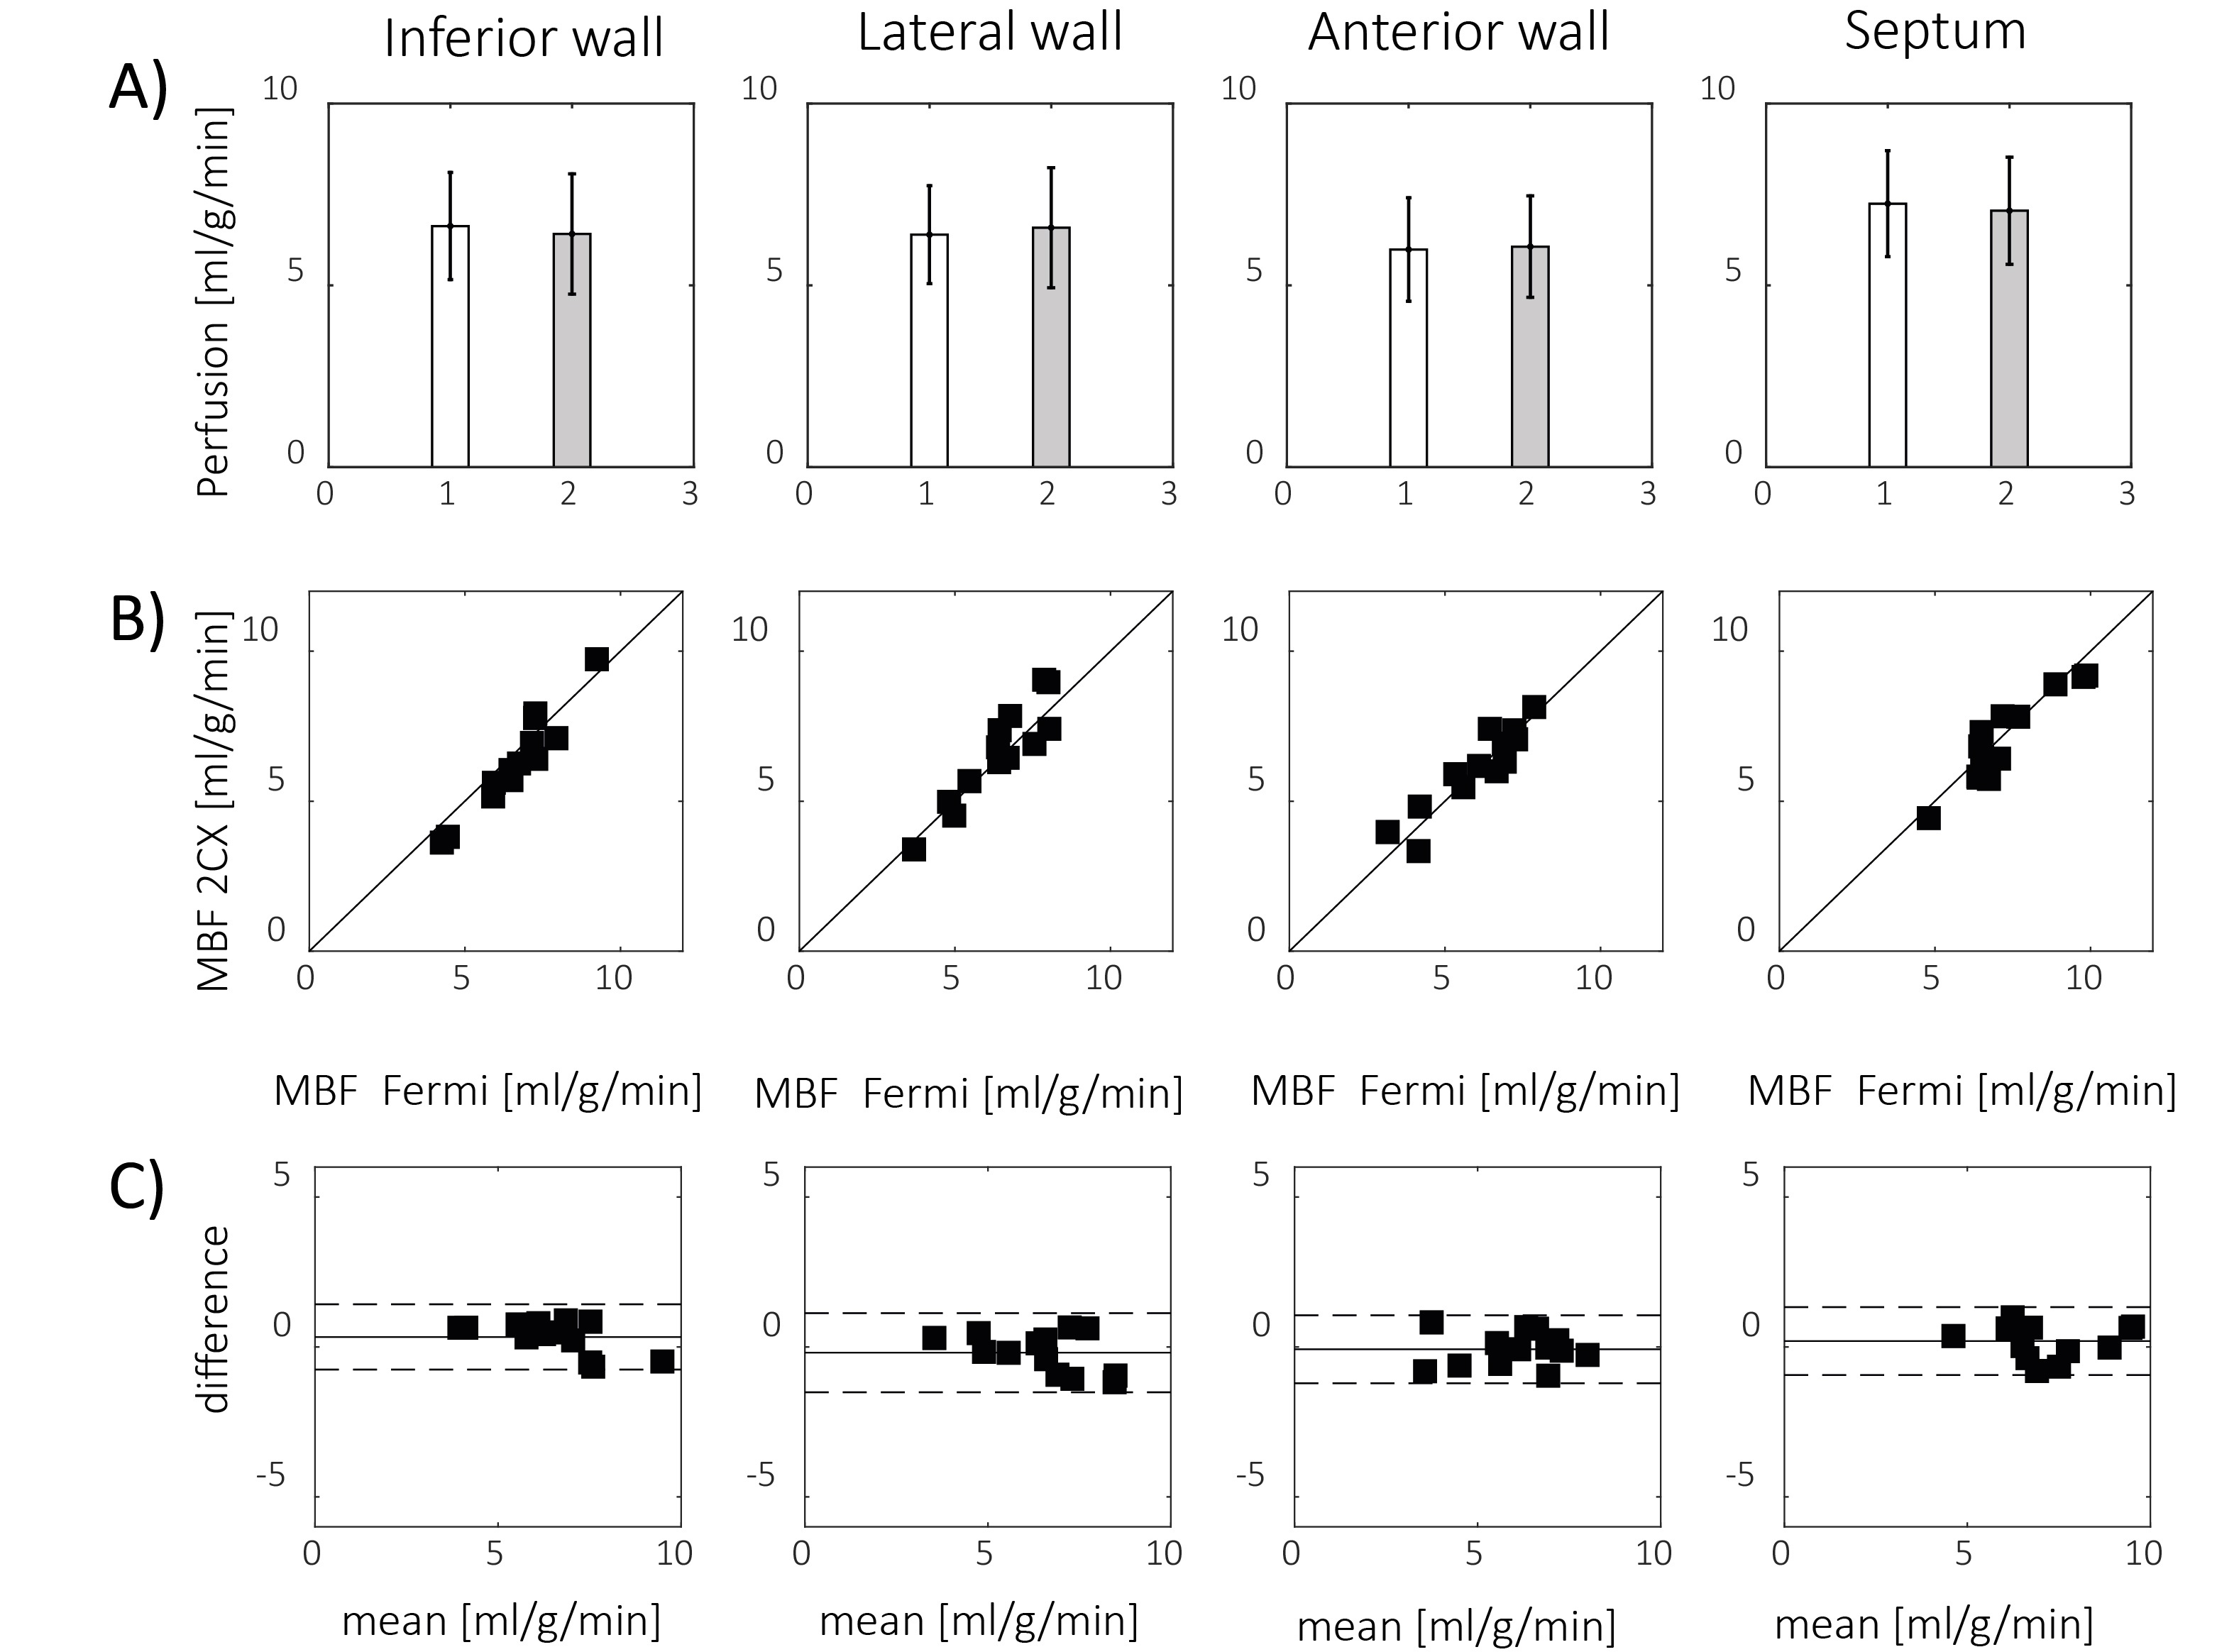
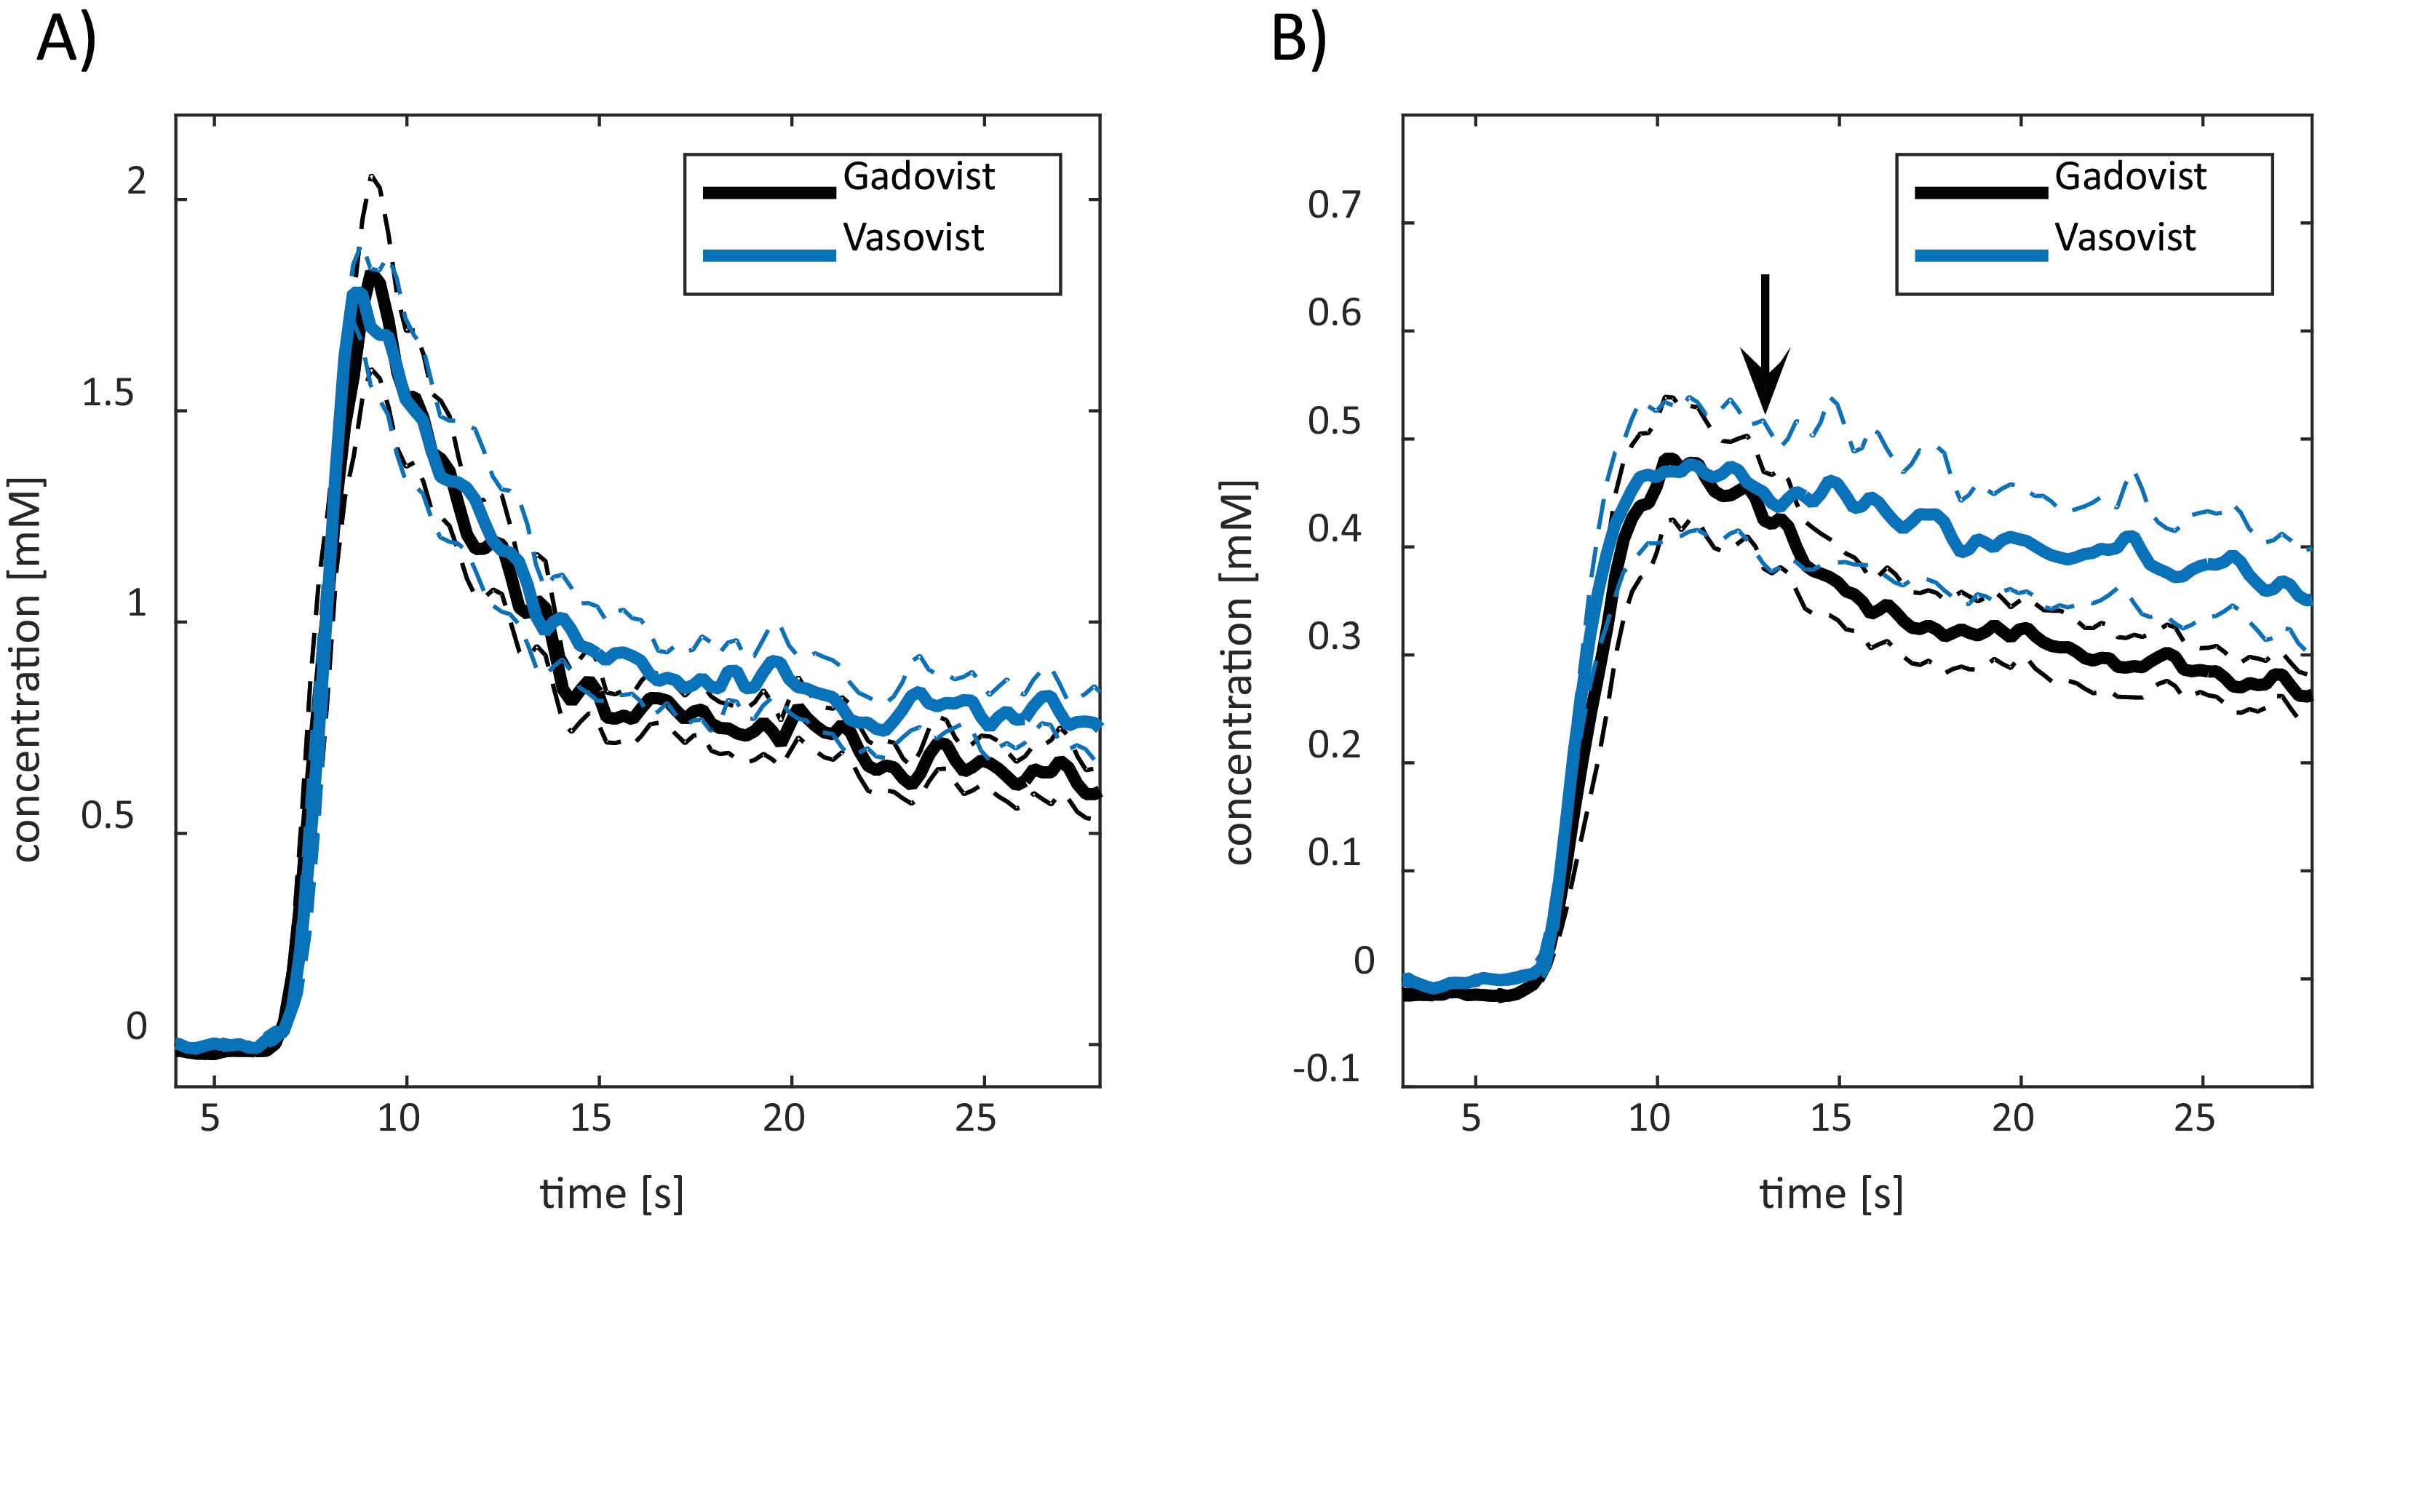
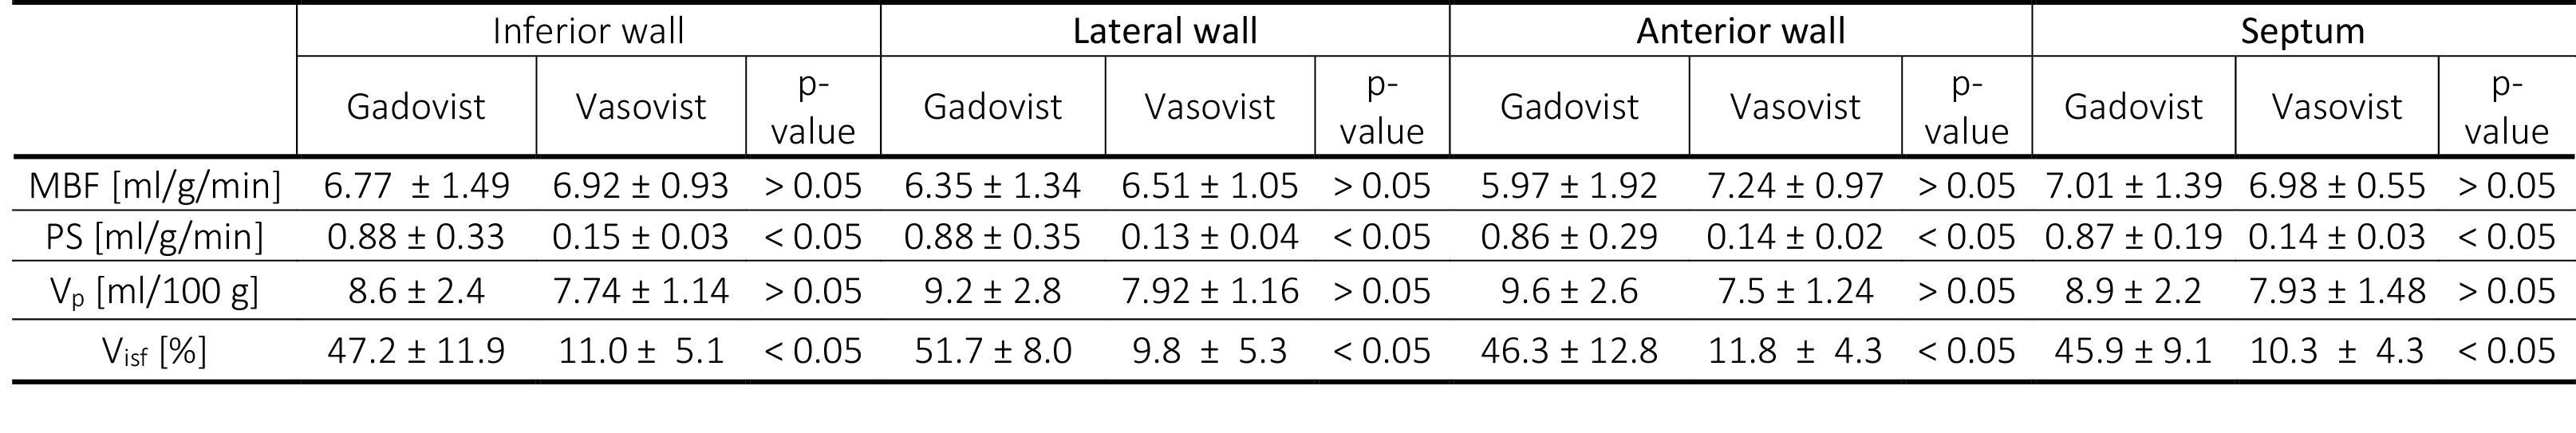
An overview of the sequence is given in Fig. 1. A set of representative fits of the 2CX model to perfusion curves in four myocardial segments is shown in Fig.2. A comparison between myocardial blood flow (MBF) obtained using Fermi deconvolution and the 2CX model is shown in Fig.3. Differences in the myocardial uptake dynamics of the extracellular (Gadovist) versus the intravascular (Vasovist) CA are shown in Fig.4 using a set of four animals with the same heart rate at the time of injection. The statistical analysis of all model parameters (MBF, compartment volumes Vb, Visf and PS) obtained for injections with both CAs is presented in Table 1.Discussion
In this study, extended quantitative perfusion imaging in mice using accelerated data acquisition and two-compartment modelling was successfully implemented. The dynamics of myocardial CA uptake and distribution could be well captured in all myocardial segments using the compartment model. The values of MBF obtained using the 2CX model were in excellent quantitative agreement with those based on the Fermi deconvolution approach9,10. However, pronounced differences were observed between Gadovist and Vasovist, reflecting the lack of extravasation for the latter. While no significant difference was found between MBF and blood volume for the extra- versus intravascular CA, the permeability surface-area product and the interstitial volume were significantly different as expected. The non-zero PS value for Vasovist could be explained be the relatively short acquisition time and/or the confounding effects of CA uptake by other organs. In conclusion, accelerated data acquisition and two-compartment modelling offer a comprehensive analysis of cardiac tissue perfusion in in-vivo mice.Acknowledgements
No acknowledgement found.References
1. Jerosch-herold M. Quantification of myocardial perfusion by cardiovascular magnetic resonance. J Cardiovasc Magn Reson. 2010;12:1-16.
2. Pelgrim GJ, Handayani A, Dijkstra H, et al. Quantitative Myocardial Perfusion with Dynamic Contrast-Enhanced Imaging in MRI and CT: Theoretical Models and Current Implementation. Biomed Res Int. 2016;2016:1-12. doi:10.1155/2016/1734190.
3. Jerosch-herold M, Wilke N, Stillman AE, Wilson RF. Magnetic resonance quantification of the myocardial perfusion reserve with a Fermi function model for constrained deconvolution. Med Phys. 1998;25(1):73-84.
4. Schwab F, Ingrisch M, Marcus R, et al. Tracer kinetic modeling in myocardial perfusion quantification using MRI. Magn Reson Med. 2015;73(3):1206-1215.
5. Broadbent DA, Biglands JD, Larghat A, et al. Myocardial blood flow at rest and stress measured with dynamic contrast-enhanced MRI: Comparison of a distributed parameter model with a fermi function model. Magn Reson Med. 2013;70(6):1591-1597
6. Naresh NK, Chen X, Roy RJ, Antkowiak PF, Annex BH, Epstein FH. Accelerated Dual-Contrast First-Pass Perfusion MRI of the Mouse Heart : Development and Application to Diet-Induced Obese Mice. Magn Reson Med. 2015;73:1237-1245.
7. Wespi P, Steinhauser J, Kwiatkowski G, Kozerke S. High-resolution hyperpolarized metabolic imaging of the rat heart using k–t PCA and k–t SPARSE. NMR Biomed. 2018;31:3876.
8. Sourbron SP, Buckley DL. Tracer kinetic modelling in MRI: Estimating perfusion and capillary permeability. Phys Med Biol. 2012;57(2).
9. Nierop BJ Van, Coolen BF, Dijk WJR, et al. Quantitative First-Pass Perfusion MRI of the Mouse Myocardium. Magn Reson Med. 2013;1744:1735-1744.
10. Makowski M, Jansen C, Webb I, et al. First-Pass Contrast-Enhanced Myocardial Perfusion MRI in Mice on a 3-T Clinical MR Scanner. Magn Reson Med. 2010;64:1592-1598.
Figures