2195
Self-gated 5D cardiac MRI in mice : a detailed study1CNRS - Univ. Bordeaux, CRMSB UMR 5536, BORDEAUX Cedex, France, 2CNRS UNIV BORDEAUX, IMB UMR 3251, Talence, France
Synopsis
Until now, mouse respiratory movement has never been deeply studied and the data acquired during breathing period are not used to obtain 4D cardiac images in mice. First, this study aims at evaluating the respiration movement and its impact on the heart region. First, motion field maps of the thorax during breathing demonstrated motion of 1mm in the anteroposterior direction. Second, 4D cardiac images were reconstructed using the data acquired during the breathing periods and a technic based on sliding window. This improvement allows a considerable acquisition time shortening (about 30%) for 3D cine whole heart imaging on small animals.
INTRODUCTION
Instrumental developments and the use of non-Cartesian MRI sequences have recently resulted in the ability to obtain self-gated 4D (3D cine) cardiac images in mice. Until now, the data acquired during this period are not used (this is the usual method). Indeed, unlike respiration in humans, the breathing of an anesthetized mouse takes the form of a start or a « hiccup » (Figure 1). Consequently, the acquisition time of 4D cardiac images in small animals remains long and the signal to noise ratio limited. First, this project aims at defining the respiration peak movement and its impact on the heart and its surrounding tissues. The second aim is to improve 4D cardiac imaging by using data during the breathing periods to reduce acquisition time. This strategy relies on the use of a self-gated UTE 3D sequence with a pseudo-random encoding [1].METHODS
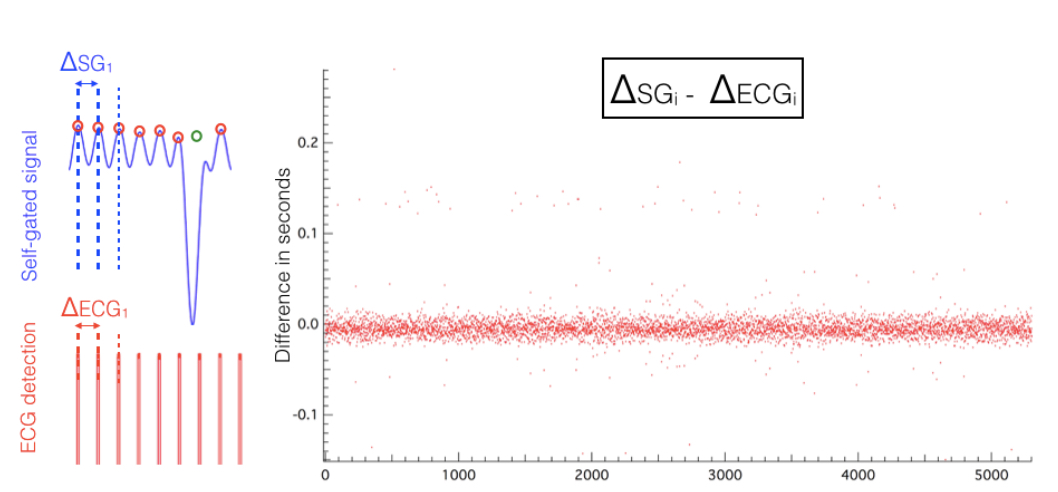
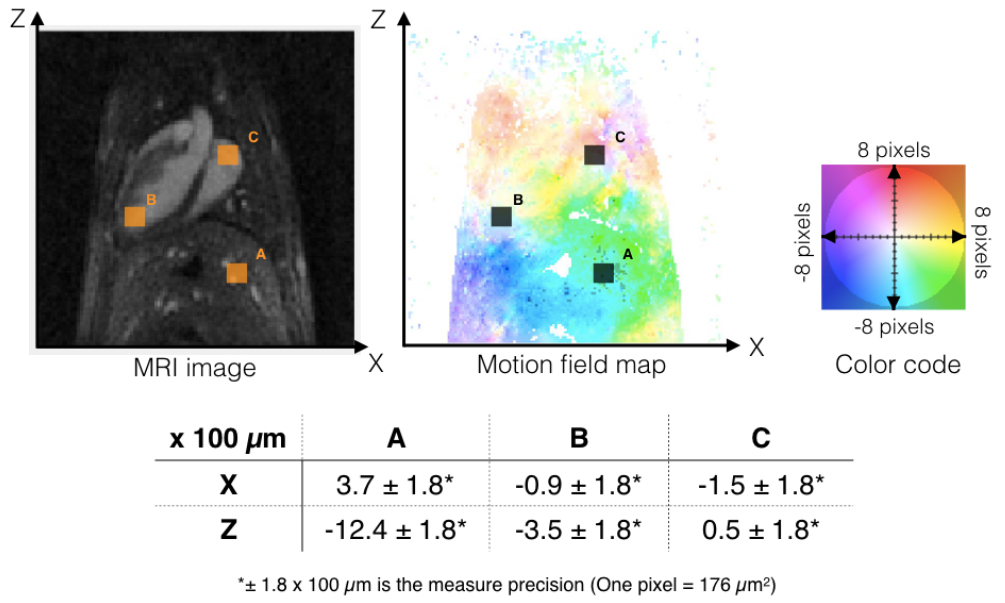
MRI experiments were performed on a 7T Bruker system (Germany). C57BL/6 mice (N=7) were anesthetized with isoflurane. Before mice positioning in the magnet, 100µmol Fe/kg of ultrasmall super paramagnetic iron oxide (USPIO, Ferumoxytol) was injected through the tail vein. The ECG signal was recorded using electrodes wrapped around the forelimbs. Cardiac rhythm was stabilized between 400 and 450 beats/min. A 3D self-gated UTE sequence was used : TR/TE=3.5/0.081 ms, Flip angle=15°, 5 data points sampled for self-gated signal (SG), 600 000 projections (30000 x 20 repetitions) distributing according to the pseudo Golden angle method, TA=35min. From these data, the respiratory and cardiac signals were extracted separately. 30 images were reconstructed along the respiratory cycle and movements of the heart and its surroundings were measured along the 3 space directions (coronal, axial and sagittal). A mathematical algorithm was used, providing displacement between images during the breathing cycle with motion field maps [2]. Three ROI were drawn to represent the global movement : at the top of the liver and in the heart (apex and right atrium). The cardiac data were extrapolated during the respiration peaks from standard data (Figure 1). 3D cine cardiac images were reconstructed, each using 30 images by cardiac cycle, using different sets of data : stable phase only, respiration peak phase only, or both. To compare image qualities between the usual reconstruction (neglecting data during respiration peak) and the whole data reconstruction, 2x or 4x-undersampled images were reconstructed (210128 and 104833 projections). Self-Gated signal during the stable phase and extrapolated peaks during respiration peak was compared to the external ECG signal to confirm their position along the acquisition.RESULTS
The images reconstructed along the respiratory cycle enabled to build motion field maps along the 3 axis (Figure 2). The results show a significant displacement of the liver in the antero-posterior direction (943±180 µm). In the heart, motion due to respiration is inhomogeneous, with a maximum displacement up to 400±180 µm in the apex. Figure 3 shows images reconstruct without the data during respiration (A), and with only the extrapolated data (B). In the latter, 70% less projections than in A were used, generating some blurring. The combination of the two data sets (A and B), enabled to use 100% of the data, which increased image quality compared to A, within the same acquisition time (35min). The second row compares two undersampled images reconstructed either with (E) or without (D) data during respiration peak. Image quality is similar, except that the acquisition time was reduced by 30% in E (17 min vs 11 min). Similarly, the same improvement is shown in the last row (8 min vs 5 min) (G). After extrapolation of the cardiac data during respiratory peak phases, the SG and ECG comparison shows a non-significant difference of 3.9±17 ms (<10% of a cardiac cycle duration) in cardiac cycles duration (Figure 4).DISCUSSION
The present work shows the existence of significative displacements in the liver and small movements in the heart during respiration. This finding proves the utility of using data during respiratory period to fasten cardiac image acquisitions. Self-gating data during the stable phase were extrapolated to obtain cardiac self-gating signal during the respiration peak periods. This technique was validated by comparing the heart beat frequency acquired with ECG external data.CONCLUSION
Here, we propose a new technique based on sliding-window extrapolation algorithm, which provides a 3D-cine whole mouse heart image in less than 5 minutes or allows to reconstruct 3D cine data as a function of respiratory cycle (5D cardiac imaging).Acknowledgements
No acknowledgement found.References
- Trotier AJ, Castets CR, Lefrançois W, Ribot EJ, Franconi JM, Thiaudière E, Miraux S. USPIO-enhanced 3D-cine self-gated cardiac MRI based on a stack-of-stars golden angle short echo time sequence : Application on mice with acute myocardial infarction.J Magn Reson Imaging. 2016 Aug. 44(2):355-65. doi: 10.1002/jmri.25150
- C Zachiu, N Papadakis, M Ries, C Moonen and B Denis de Senneville. An improved optical flow tracking technique for real-time MR-guided beam therapies in moving organs. Phys. Med. Biol. 60 (2015) 9003–9029
Figures
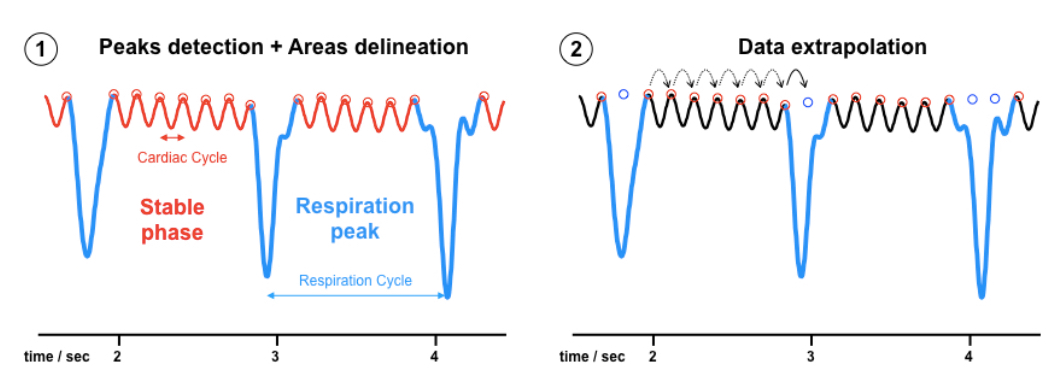
1 - A Matlab function was used to detect all the cardiac peaks (red circles) from the SG signal. Then, a sliding-window was used to distinguish data during respiratory phases. The median amplitude of 15 peaks was calculated to determine the presence or not of another successive one. This method leads to a strict delineation of the two periods : « Stable » (red) and « During respiratory motion » (blue).
2 - Finally, cardiac data were extrapolated during respiratory phase. The median of the previous cardiac cycles was calculated and reported during respiratory duration (blue circles).
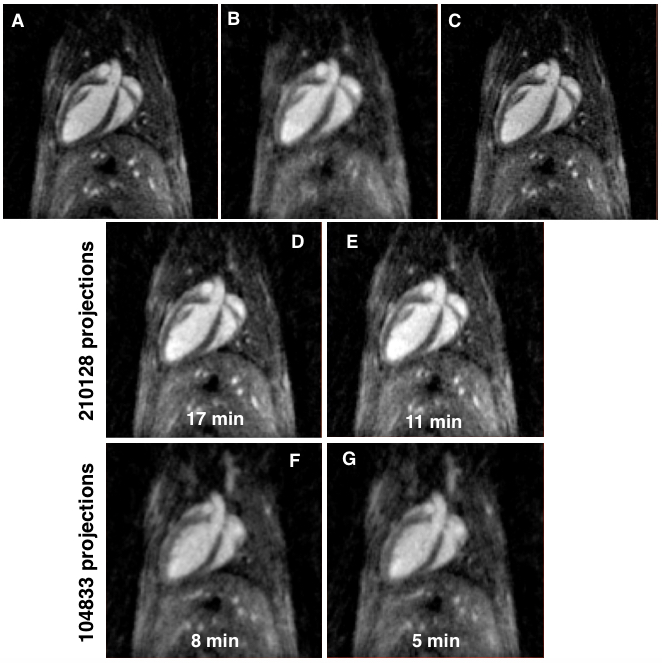
2D slices extracted from 3D cine cardiac images during diastole, reconstructed with different sets of projections.
A - Standard cardiac reconstruction (No use of data during respiration peak) (429877 projections, 35 min)
B - Only the extrapolated data during respiration peak (170123 projections)
C - Standard + Data during respiration peak (600000 projections, 35 min)
D - Standard reconstruction, undersampled by 2, using 210128 projections, TA=17min
E - Standard + Data during respiration peak, using 210128 projections, with a TA of 11 min
F - Standard reconstruction, undersampled by 4, using 104833 projections, TA=8min
G - Standard + Data during respiration peak, using 104833 projections, with a TA of 5 min