2194
Dynamic T1 Mapping for Quantitative Myocardial Perfusion Imaging1Physikalisch-Technische Bundesanstalt (PTB), Braunschweig and Berlin, Germany, 2School of Biomedical Engineering and Imaging Sciences, King’s College London, London, United Kingdom, 3Working Group on Cardiovascular Magnetic Resonance, Experimental and Clinical Research Center, a joint cooperation between the Charité Medical Faculty and the Max-Delbrueck Center for Molecular Medicine, Berlin, Germany, 4ZMT Zurich MedTech AG, Zurich, Switzerland
Synopsis
Myocardial perfusion imaging is a valuable diagnostic tool to assess cardiac viability. Quantitative perfusion imaging promises to provide absolute values of myocardial perfusion allowing for objective disease assessment and monitoring. Here we present a phantom study evaluating accuracy and reproducibility of a high-resolution dynamic T1 mapping approach to directly measure changes in contrast agent concentration and yield quantitative myocardial perfusion without the need of signal-intensity calibration. Our proposed technique provides one high-resolution T1 map for each cardiac cycle and leads to accurate myocardial perfusion values verified with standard 2D phase-contrast MRI (difference of estimated flow 10 – 20%).
Introduction
Myocardial perfusion imaging using dynamic contrast enhanced MRI can provide valuable diagnostic information about myocardial ischemia1. Commonly, qualitative dynamic T1-weighted MR images are obtained over several seconds after the injection of a contrast bolus. Image intensity changes can then be qualitatively assessed for myocardial perfusion2. In order to quantify perfusion, signal intensity needs to be converted to contrast agent (CA) concentration using signal models, calibration curves and/or additional scans3–5. Recently, methods have been presented which directly measure the changes of T1 and hence the changes of CA concentration using dynamic T1 mapping6. So far, these approaches still require temporal and spatial regularisation and have not been quantitatively evaluated.
Here we present a phantom study evaluating the accuracy and reproducibility of a high-resolution dynamic T1 mapping (DynT1Map) approach for quantitative myocardial perfusion without the need of regularisation.
Methods
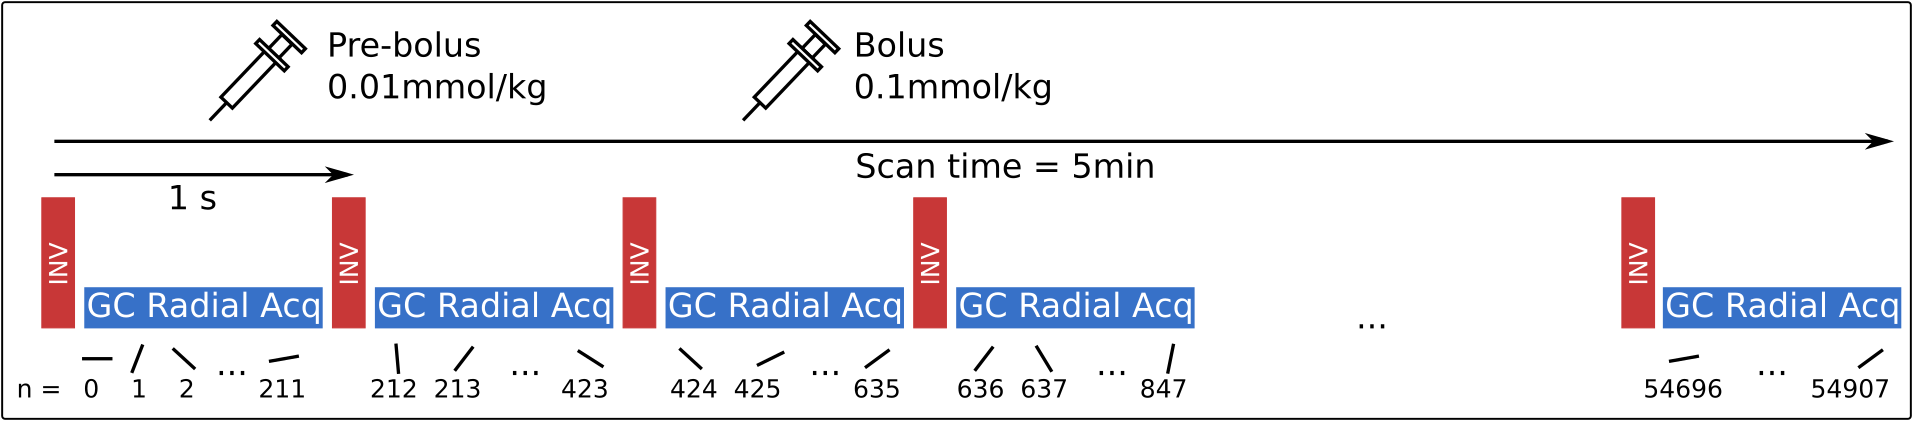
Data acquisition: Data was acquired continuously for 5min using a 2D Golden radial trajectory leading to 54908 radial lines (FA: 5°, TR/TE: 5.3/2.3ms, FOV: 320x320 mm2, 1x1mm2 resolution and 8mm slice thickness)7. Based on a simulated heart rate of 60bpm, an inversion pulse was applied once every cardiac cycle. A pre-bolus with 0.01mmol/kg and a main bolus with 0.1mmol/kg of Gadolinium-based CA (Gadoteridol) were injected after 1 and 2min of scan time, respectively. The pre-bolus was not used for evaluation in this study.
Image reconstruction: Raw data was split into 7769 time frames leading to 29 dynamic images for each heart cycle and hence each inversion pulse. Individual dynamic images were reconstructed with an iterative non-cartesian SENSE reconstruction scheme8. No spatial or temporal regularization was used.
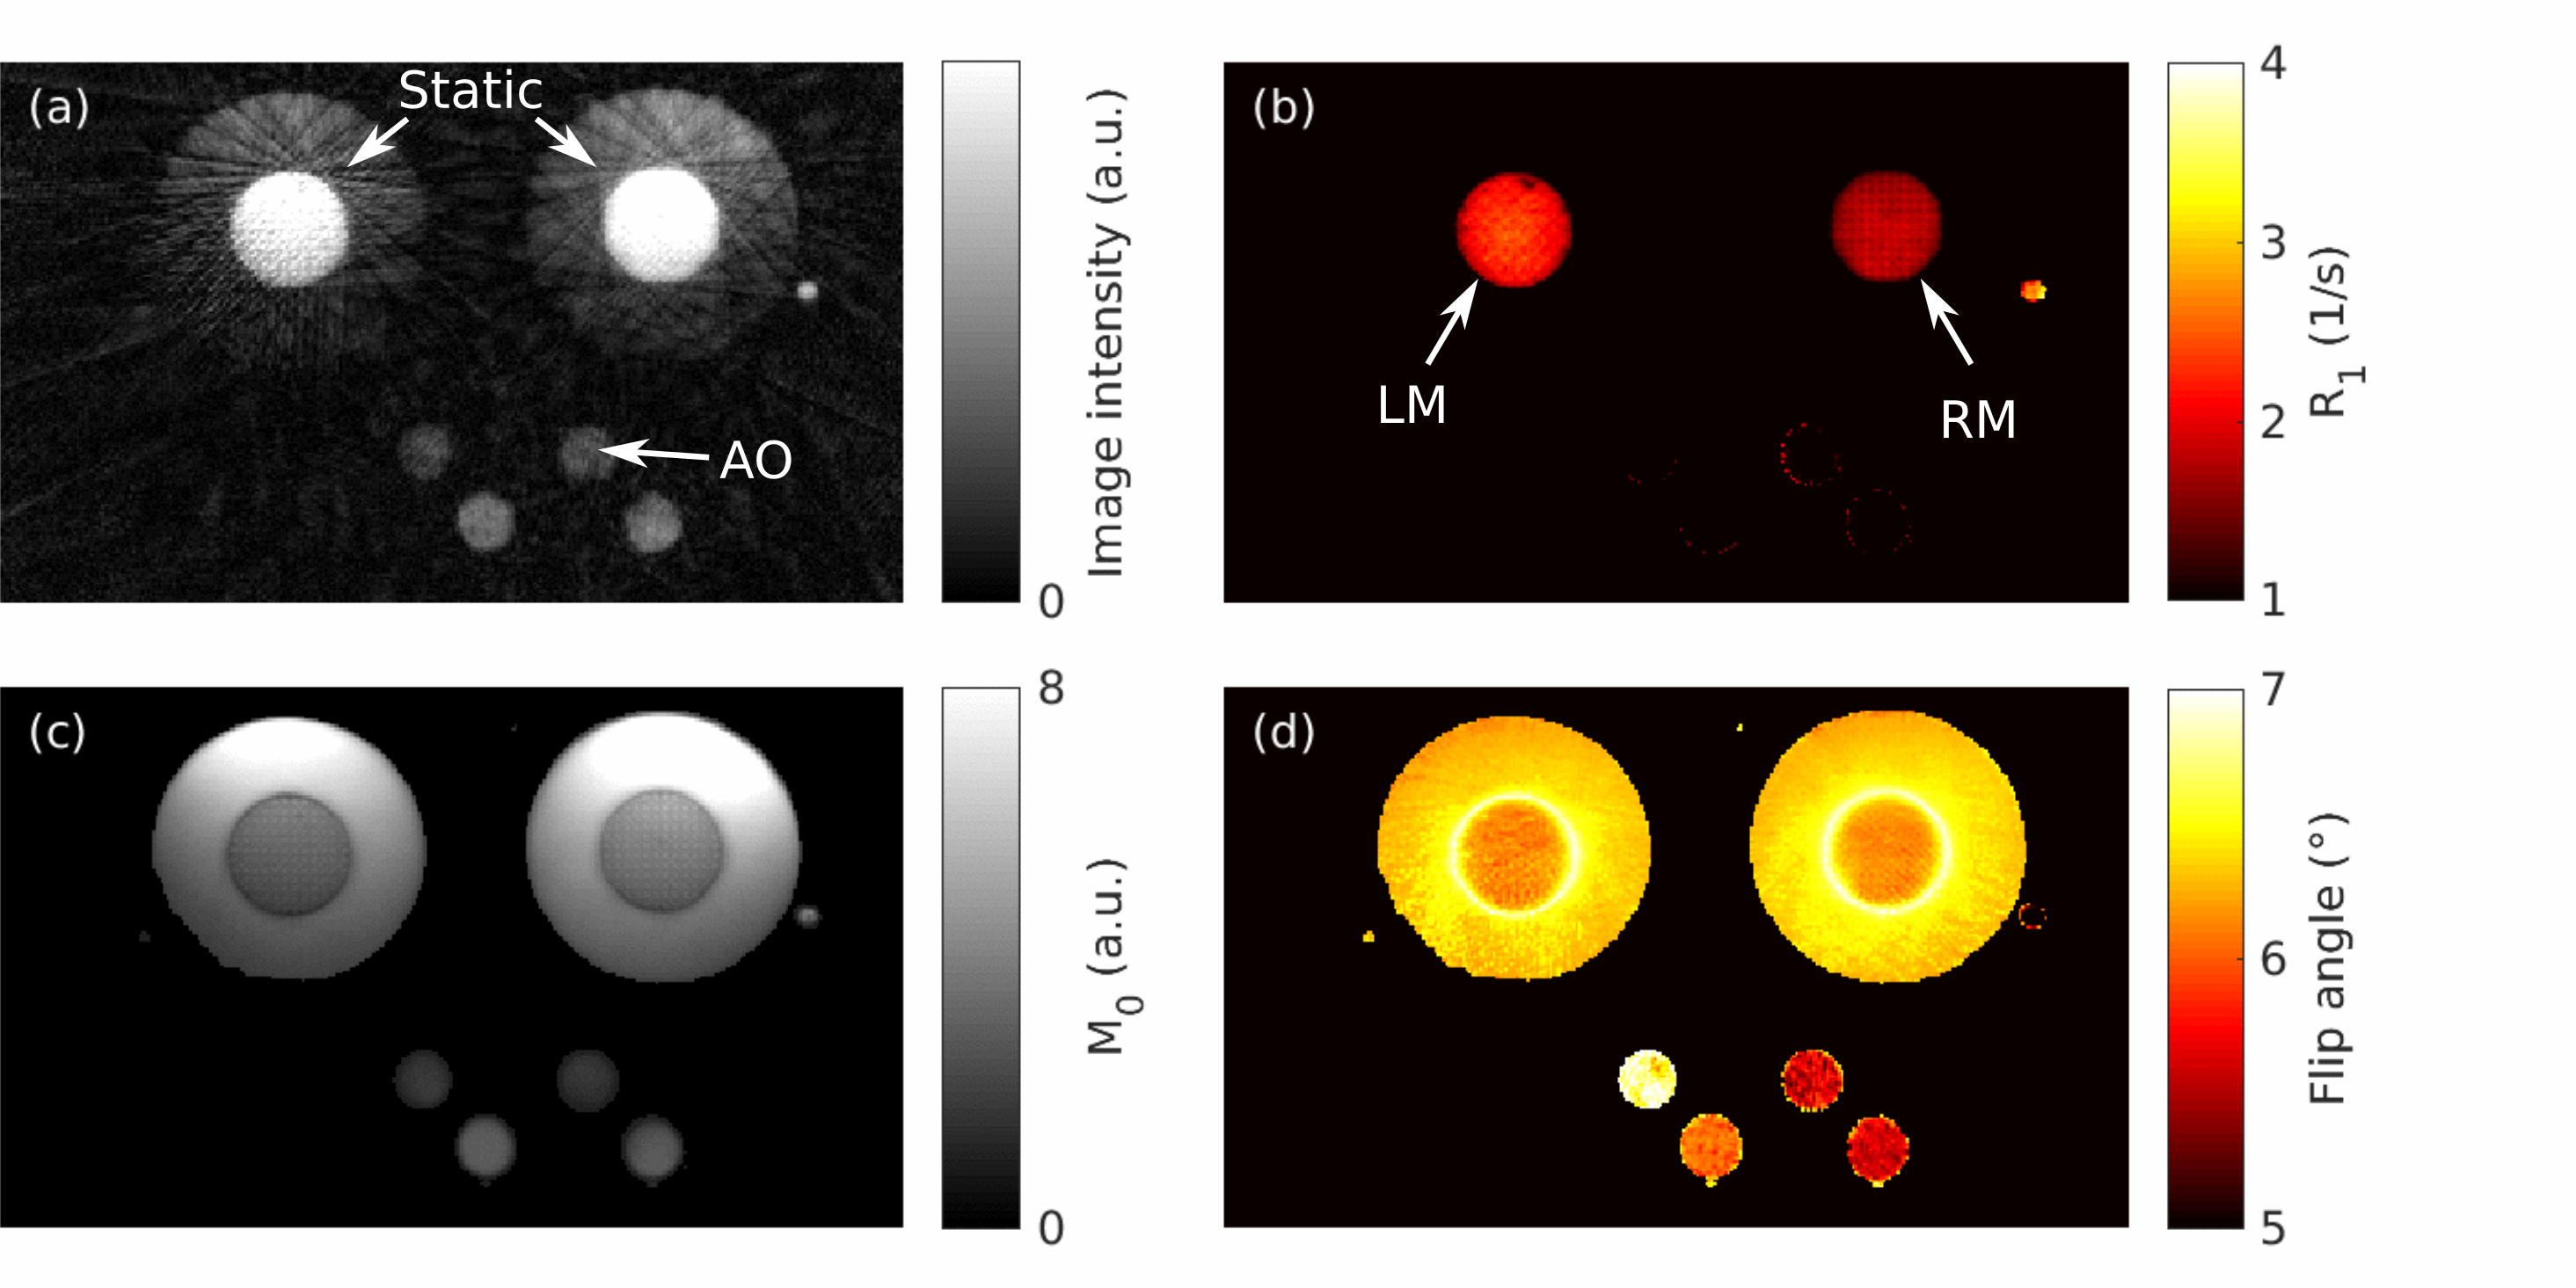
T1 mapping: Prior to the injection of CA, T1 can be assumed constant representing the basis T1 value of the phantom fluid. Due to the injection of the contrast agent, only T1 changes and not FA and M0. Therefore, in a first step, a 3-parameter model (T1, FA and M0) was fitted to the first 20 cardiac cycles obtaining a single value for T1, FA and M0 in each pixel. In a second step, a 1-parameter model (T1) was fitted to the dynamic images of each cardiac cycle individually using FA and M0 from the 3-parameter fit. This yields dynamic T1 maps with a temporal resolution of 1s. For in-vivo application, cardiac motion needs to be taken into consideration. Therefore, we carried out this fit once using all 29 dynamic images of each cardiac cycle and once using only 6 dynamic images corresponding to an acquisition window of approximately 200ms per cardiac cycle.
Perfusion estimation: Estimated T1 values were calculated into CA concentration assuming a relaxivity of r1 = 4.7(mmol s)-1. Perfusion estimation was carried out on a pixel-level using the well-established Fermi-method which uses the Fermi function as a parametric model for the response function9,10.
Phantom experiments: DynT1Map was evaluated in a perfusion phantom similar as described in Chiribiri et al11. It consists of two cylindrical components with a 3D printed tube structure to mimic perfusion in a myocardial component surrounded by a static water cylinder (as static tissue). All other cardiac chambers and main vessels are also replicated allowing for a simulation of dynamic contrast behaviour of perfusion. The flow through each “myocardium compartment” can be separately controlled and was set to 400ml/min (left myocardium, LM) and 200ml/min (right myocardium, RM). In order to validate the obtained flow from DynT1Map, a 2D phase contrast MR scan (PC) was carried out (0.5x0.5mm2 resolution, 5mm slice thickness). All scans were repeated five times alternatingly.
Evaluation: The flow values obtained with DynT1Map and PC were compared as averages of a small region of interest in LM and RM.
Results
The average flow over all 5 measurements obtained with PC was 342.8±47.7ml/min (LM) and 174.7±9.9ml/min (RM). Perfusion flow values calculated form DynT1Map were 302.2±36.5ml/min (LM) and 198±13.1ml/min (RM). Using only 200ms of data in each cardiac cycle for DynT1Map yielded a measured flow of 278.95±47.6ml/min (LM) and 200.8±25.1ml/min (RM).Conclusion
DynT1Map provided accurate flow measurements comparable to PC with differences of 11.6±5% (LM) and -13.3±4% (RM). Reducing the acquisition window in each cardiac cycle to 200ms still led accurate flow estimates with differences of 18.7±6% (LM) and -14.7±10% (RM) compared to PC flow measurements. So far, the data fit is a two-step approach and requires several cardiac cycles without T1 change to estimate FA and M0. Future work will focus on a fitting approach which provides a T1 value for each cardiac cycle and fits a single FA and M0 value for all cardiac cycles in each pixel. This will reduce the overall required scan time and make it applicable in a single breathhold.Acknowledgements
This work was supported by the EMPIR project 15HLT05 PerfusImaging. The EMPIR initiative is co-funded by the European Union's Horizon 2020 research and innovation programme and the EMPIR Participating States.References
1. Hendel RC, Friedrich MG, Schulz-Menger J, et al. CMR First-Pass Perfusion for Suspected Inducible Myocardial Ischemia. JACC Cardiovasc Imaging. 2016;9(11):1338-1348.
2. Coelho-Filho OR, Rickers C, Kwong RY, Jerosch-Herold M. MR Myocardial Perfusion Imaging. Radiology. 2013;266(3):701-715.
3. Hsu LY, Kellman P, Arai AE. Nonlinear myocardial signal intensity correction improves quantification of contrast-enhanced first-pass MR perfusion in humans. J Magn Reson Imaging. 2008;27(4):793-801.
4. Gatehouse PD, Elkington AG, Ablitt NA, Yang GZ, Pennell DJ, Firmin DN. Accurate assessment of the arterial input function during high-dose myocardial perfusion cardiovascular magnetic resonance. J Magn Reson Imaging. 2004;20(1):39-45.
5. Cernicanu A, Axel L. Theory-Based Signal Calibration with Single-Point T1 Measurements for First-Pass Quantitative Perfusion MRI Studies. Acad Radiol. 2006;13(6):686-693.
6. Christodoulou AG, Shaw JL, Nguyen C, et al. Magnetic resonance multitasking for motion-resolved quantitative cardiovascular imaging. Nat Biomed Eng. 2018;2(4):215-226.
7. Becker K, Schulz-Menger J, Schaeffter T, Kolbitsch C. Simultaneous high-resolution cardiac T1 mapping and cine imaging using model-based iterative image reconstruction. Magn Reson Med, DOI: 10.1002/mrm.27474, 2018
8. Pruessmann KP, Weiger M, Boernert P, Boesiger P. Advances in sensitivity encoding with arbitrary k-space trajectories. Magn Reson Imaging. 2001;46(4):638-651.
9. Taheri S, Shah NJ, Rosenberg GA. Analysis of pharmacokinetics of Gd-DTPA for dynamic contrast-enhanced magnetic resonance imaging. Magn Reson Imaging. 2016;34(7):1034-1040.
10. Jerosch-Herold M, Wilke N, Stillman AE, Wilson RF. Magnetic resonance quantification of the myocardial perfusion reserve with a Fermi function model for constrained deconvolution. Med Phys. 1998;25(1):73-84.
11. Chiribiri A, Schuster A, Ishida M, et al. Perfusion phantom: An efficient and reproducible method to simulate myocardial first-pass perfusion measurements with cardiovascular magnetic resonance. Magn Reson Med. 2013;69(3):698-707.
Figures