2189
Evaluation of the performance of voxel-wise myocardial perfusion quantification methods using a traceable phantom1Department of Mathematics and Statistics, Laboratoire National de Métrologie et d'Essais (LNE), Trappes, France, 2Division of Medical Physics and Metrological Information Technology, Physikalisch-Technische Bundesanstalt (PTB), Braunschweig und Berlin, Berlin, Germany, 3Data Science, National Physical Laboratory (NPL), Teddington, United Kingdom, 4Cardiovascular Imaging, King’s College London, London, United Kingdom, 5Biomedical Engineering, King’s College London, London, United Kingdom
Synopsis
Assessing and comparing myocardial imaging methodologies require the use of a physical standard. A novel 3D printed cardiac phantom mimicking transmural myocardial perfusion gradients is used in this study, first to evaluate the repeatability of phase contrast MRI (PC-MRI) measurements and then, to compare two common methods for perfusion quantification using dynamic contrast enhanced MRI (DCE-MRI) measurements: the dual bolus and the model-based approach.
Background
Traceable fully quantitative voxel-wise measurements of myocardial blood flow (MBF) using dynamic contrast-enhanced MRI (DCE-MRI) are challenging due to the lack of a standardised approach of the perfusion quantification process, as well as the need for a physical standard for the creation of ground-truth flow maps at a voxel-wise level. One particular challenging issue for quantification of MBF using DCE-MRI is that it relies on the analysis of data describing the temporal variation of contrast agent concentration following bolus administration. The relation between signal intensity (SI) and contrast agent (CA) concentration at the doses required for sufficient signal-to-noise ratio (SNR) is non-linear.1 In this study, the performance of two well-established methods for dealing with this non-linearity is compared using data from a novel 3D printed cardiac phantom mimicking transmural myocardial perfusion gradients for first-pass perfusion:2 (i) the dual bolus approach;3 and (ii) the model-based approach where SI is converted to gadolinium concentration based on the Bloch equations.4 The repeatability of both of these methods is compared to that of the phase contrast MRI (PC-MRI) measurements of the physical phantom, which is here considered as the reference value.
Methods
The phantom (fig. 1) was scanned with a 3T Philips Achieva scanner equipped with a 32-channel cardiac phased array surface coil (Philips Healthcare, Best, Netherlands) and scanned at two different ground-truth perfusion rates (3 and 4 ml/g/min). A standard clinical perfusion imaging protocol was used for DCE-MRI. This involved a dual-bolus injection scheme (1:10 pre- to main bolus concentration of Gadovist®, 2 minutes delay between boluses) and ECG-triggered imaging with a turbo field echo (TFE) sequence (TR = 4.2 ms, TE = 2.1 ms, TI = 120 ms, 20° flip angle, 1 average, 160×160 matrix, 1.75×1.75 mm2 resolution, 10 mm slice thickness). For each perfusion rate, additionally, native T1 maps were obtained using the MOLLI 5(3)3 sequence (TR = 4.2 ms, TE = 2.1 ms, TImin= 103 ms, 10° flip angle, 1 average) and velocity maps using gradient echo phase contrast MRI (PC-MRI) (TR = 9.5 ms, TE = 7.0 ms, 10° flip angle, 4 averages) with matching resolution and slice positioning. All of the scans were repeated three times.
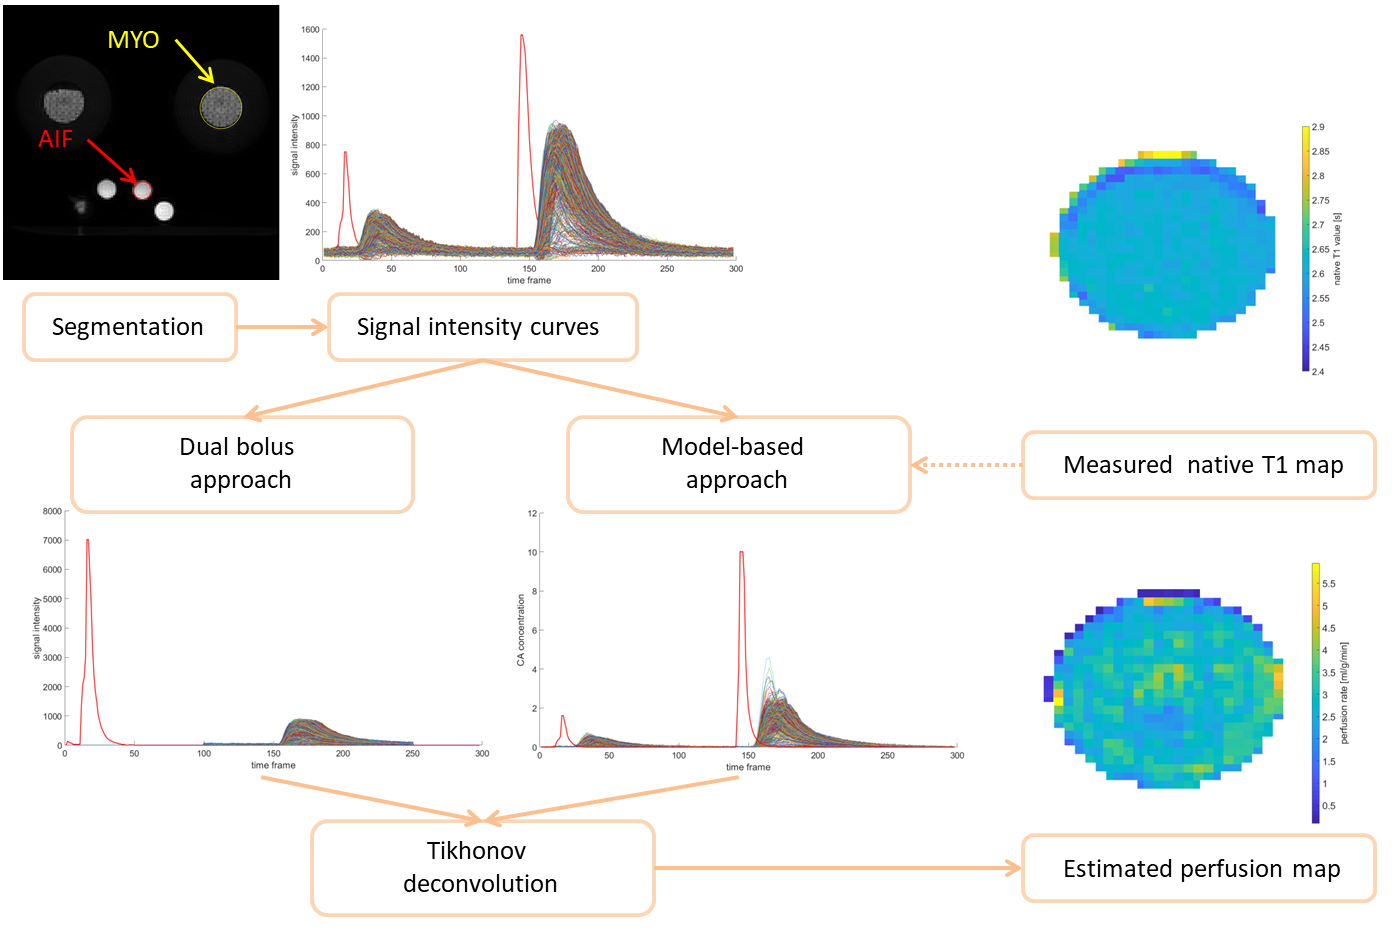
The reference flow maps were derived from the velocity maps acquired with PC-MRI measurements, and, the total dispersion volume of the phantom (80 mL) was used, assuming that it is equally distributed to each voxel. Repeated measurements from DCE-MRI data were then used to estimate perfusion maps using (i) and (ii) followed by a Tikhonov deconvolution5 (fig. 2). Methods (i) and (ii) compute different output quantities: (i) gives a specific flow that needs to be converted to perfusion using a linear regression model; (ii) estimates the perfusion directly. For this reason, the comparison of both methods is performed by comparing the percentage relative standard deviation (RSD) of the estimated perfusion values for each method.
Results
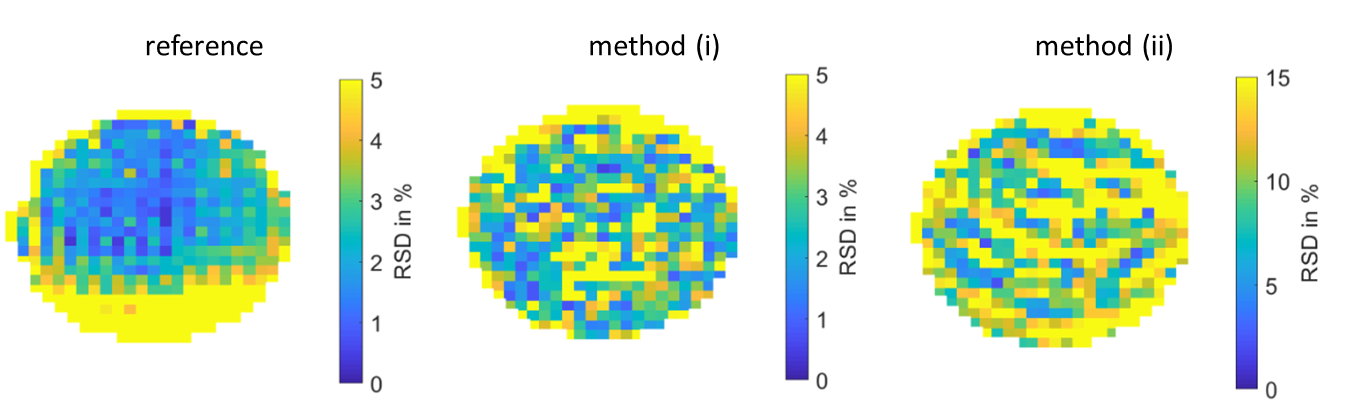
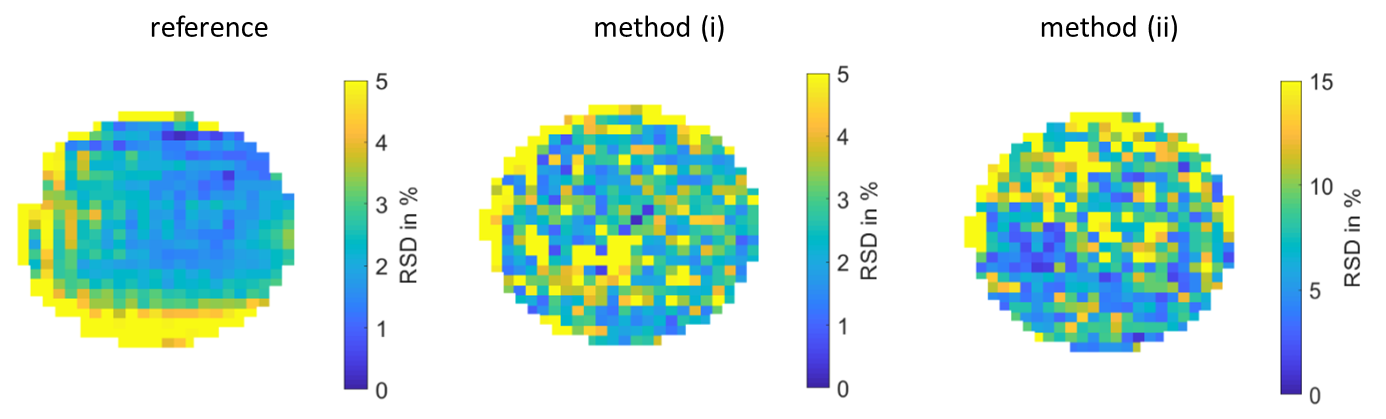
A global sensitivity analysis using Monte Carlo simulations has been carried out to identify the most influential parameters for each method, showing that the native T1 relaxation time is the most influential factor among the physiological tissue parameters used in (ii), leading to a mean RSD in perfusion estimates of 2.5 %. Figures 3 and 4 show the computed RSD maps for the two perfusion rates using (i) and (ii) as well as the computed RSD maps for the reference. 95 % of the computed RSD in perfusion measurements are below 12.47 % and 9.00 % for the reference, and 95% of the computed RSD in perfusion estimates are below 13.24 % and 8.25 % for (i) and 26.90 % and 22.46 % for (ii) for a perfusion rate of 3 ml/g/min and 4 ml/g/min, respectively.Discussion & Conclusions
The performance of two well-established methods for voxel-wise perfusion quantification has been compared against reference flow maps measured using a traceable phantom for two fixed perfusion rates. The RSD for repeatability of the reference (PC-MRI) measurements is close to 10 % for the two investigated perfusion rates, and it is very inhomogeneous over the entire myocardium. The computed RSD in perfusion estimates for the dual bolus approach (i) is of the same order of magnitude as the RSD for repeatability of PC-MRI measurements, while it is much higher for the model-based approach (ii) (close to 25 %). Repeated DCE-MRI measurements have highlighted the need for accurate and repeatable measurements to be able to perform fully quantitative estimation of myocardial perfusion, especially for the model-based approach.Acknowledgements
This project has received funding from the European Metrology Research Programme (EMPIR) co-financed by the Participating States and from the European Union’s Horizon 2020 research and innovation programme, under project number 15HLT05. This paper reflects only the authors' view and EURAMET is not responsible for any use that may be made of the information it contains.References
[1] Broadbent D A, Biglands J D, Ripley D P, Plein S, and Buckley D L. Comparison of non-linearity correction methods for quantitative myocardial perfusion MRI. Journal of Cardiovascular Magnetic Resonance, volume 17, page P45, 2015.
[2] Milidonis X, Nazir M S, Capstick M, Drost S, Kok G, Pelevic N, Poelma C, Schaeffter T, and Chiribiri A. Dynamic contrast-enhanced and phase contrast MRI of a novel 3D printed cardiac phantom mimicking transmural myocardial perfusion gradients. Proceedings of the Joint Annual Meeting of the ISMRM-ESMRMB, Paris, 2018.
[3] Ishida M, Schuster A, Morton G, Chiribiri A, et al. Development of a universal dual-bolus injection scheme for the quantitative assessment of myocardial perfusion cardiovascular magnetic resonance. Journal of cardiovascular magnetic resonance: official journal of the Society for Cardiovascular Magnetic Resonance, 2011.
[4] Brown R W, Cheng Y C N, Haacke E M, et al. Magnetic Resonance Imaging: Physical Principles and Sequence Design: Second Edition. 2014. Section 18.2.1.
[5] Calamante F, Gadian D G, and Connelly A. Quantification of Bolus-Tracking MRI: Improved Characterization of the Tissue Residue Function Using Tikhonov Regularization. Magnetic Resonance in Medicine, 50(6):1237–1247, 2003.
Figures
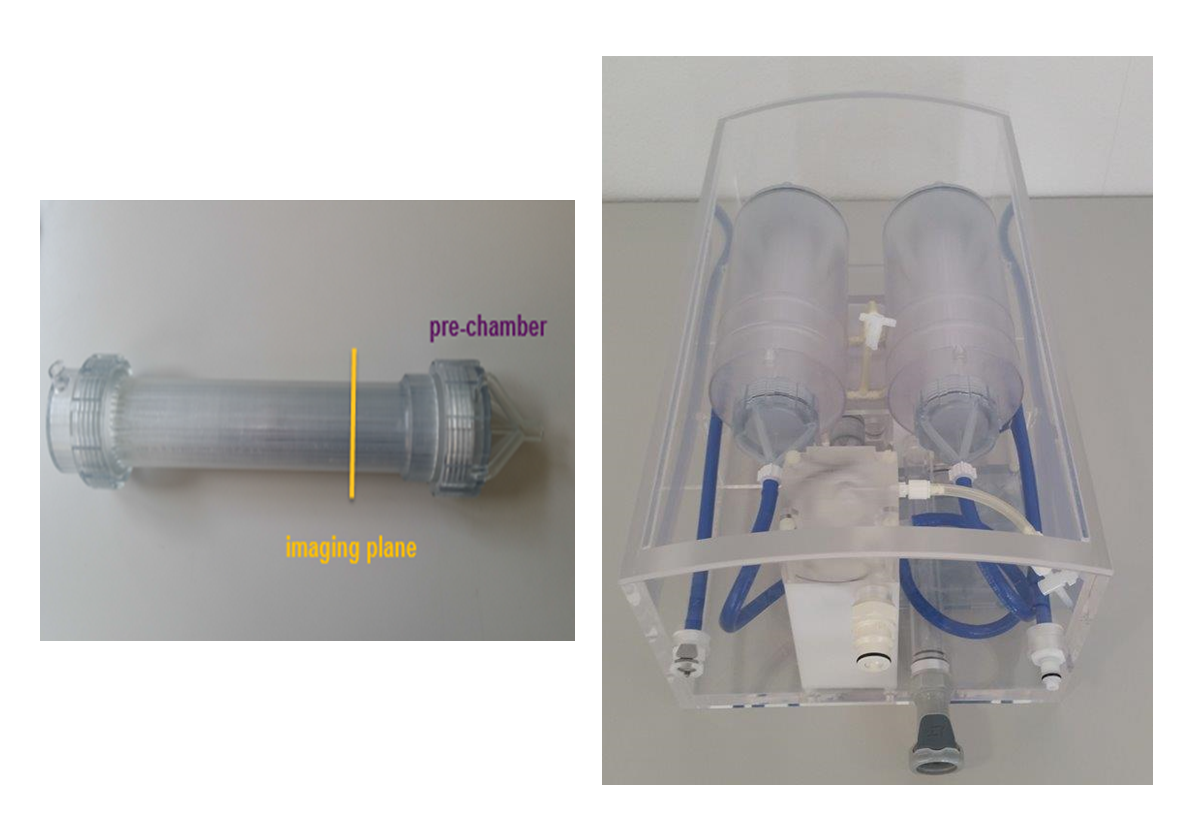
Figure 1: Photograph of the 3D printed myocardium indicating the main compartments (left) and the whole heart phantom with myocardial compartments installed (right) as described by Milidonis et al.2