2188
Comparison of regional microvascular dysfunction of hypertrophied myocardium and its relation with myocardial strains in cardiac amyloidosis and hypertrophic cardiomyopathy1Radiology, West China Hospital, Chengdu, China, 2Cardiology, West China Hospital, Chengdu, China, 3Radiology, West China Second University Hospital, Chengdu, China
Synopsis
Cardiac amyloidosis and hypertrophic cardiomyopathy can be both characterized with increased wall thickness. We intended to explore the microvascular function of the two different phenotypes of hypertrophy and its relation with regional myocardial function. Amyloid infiltration caused more severe myocardial perfusion disorder and systolic dysfunction. Significant correlations were observed between microcirculation and myocardial strain.
Purpose
To investigate the microvascular dysfunction and its relation with myocardial strains in cardiac amyloidosis(CA) and hypertrophic cardiomyopathy(HCM) with similar wall thickness.Methods
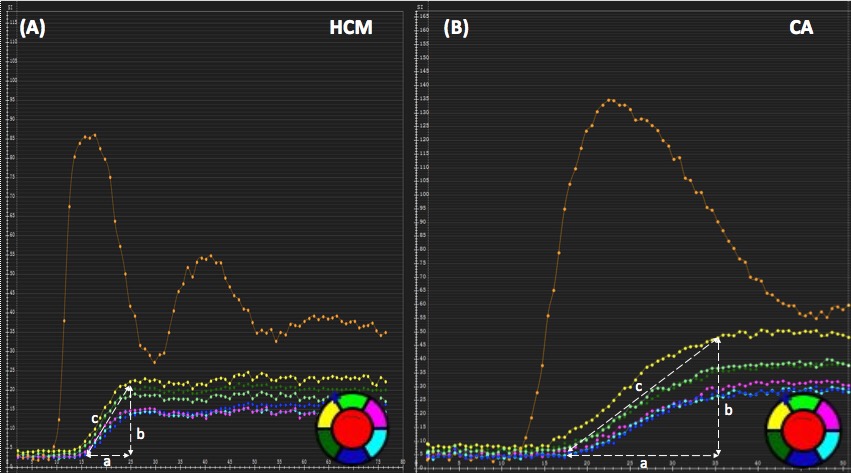
We included 30 biopsy-proven CA (65.4 ± 10.7 years, 54% female) and 36 patients with HCM1 (65.4 ± 10.7 years, 59% female). Segments with a wall thickness (WT) >12mm were considered thickened2. Perfusion parameters including upslope, time to maximum signal intensity (TTM), time to 50% maximum signal intensity (50%TTM) and max signal intensity (MaxSI) were obtained from the myocardial signal intensity-time curve3 (Figure 1). Myocardial strain indices including radial (RS), circumferential (CS) and longitudinal (LS) strain were derived from the tissue tracking model on cine images. The AHA 16-segment model was used for regional perfusion and strain analysis to match with each other.Results
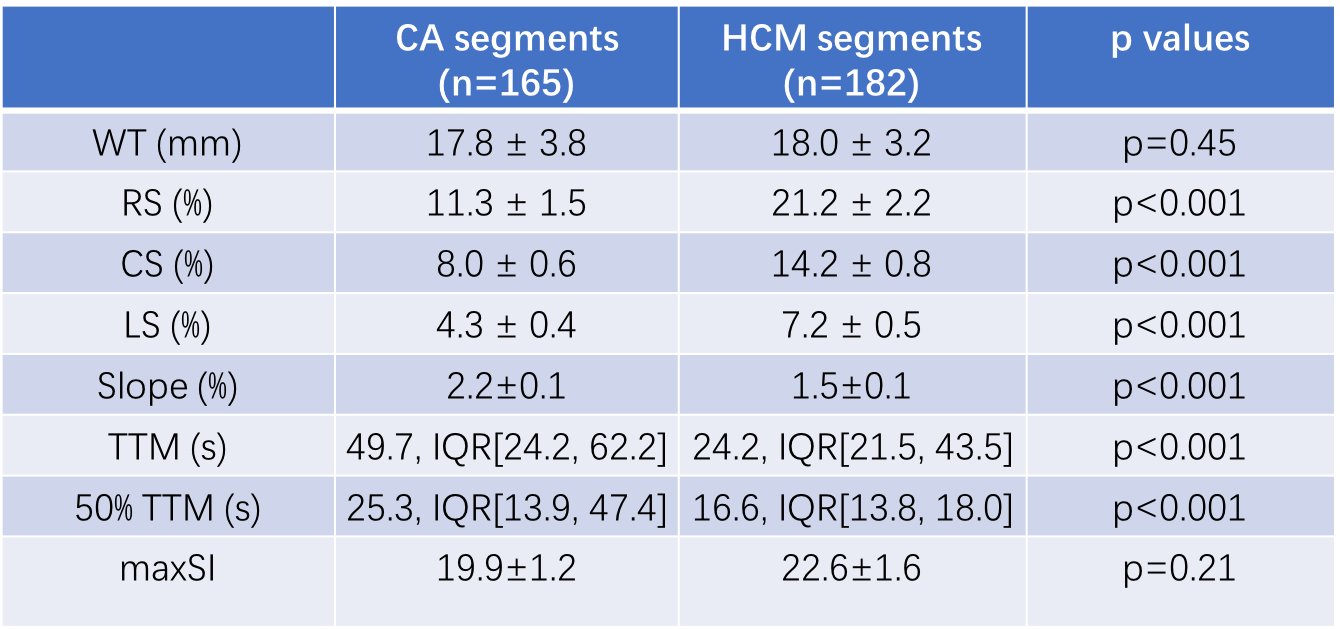
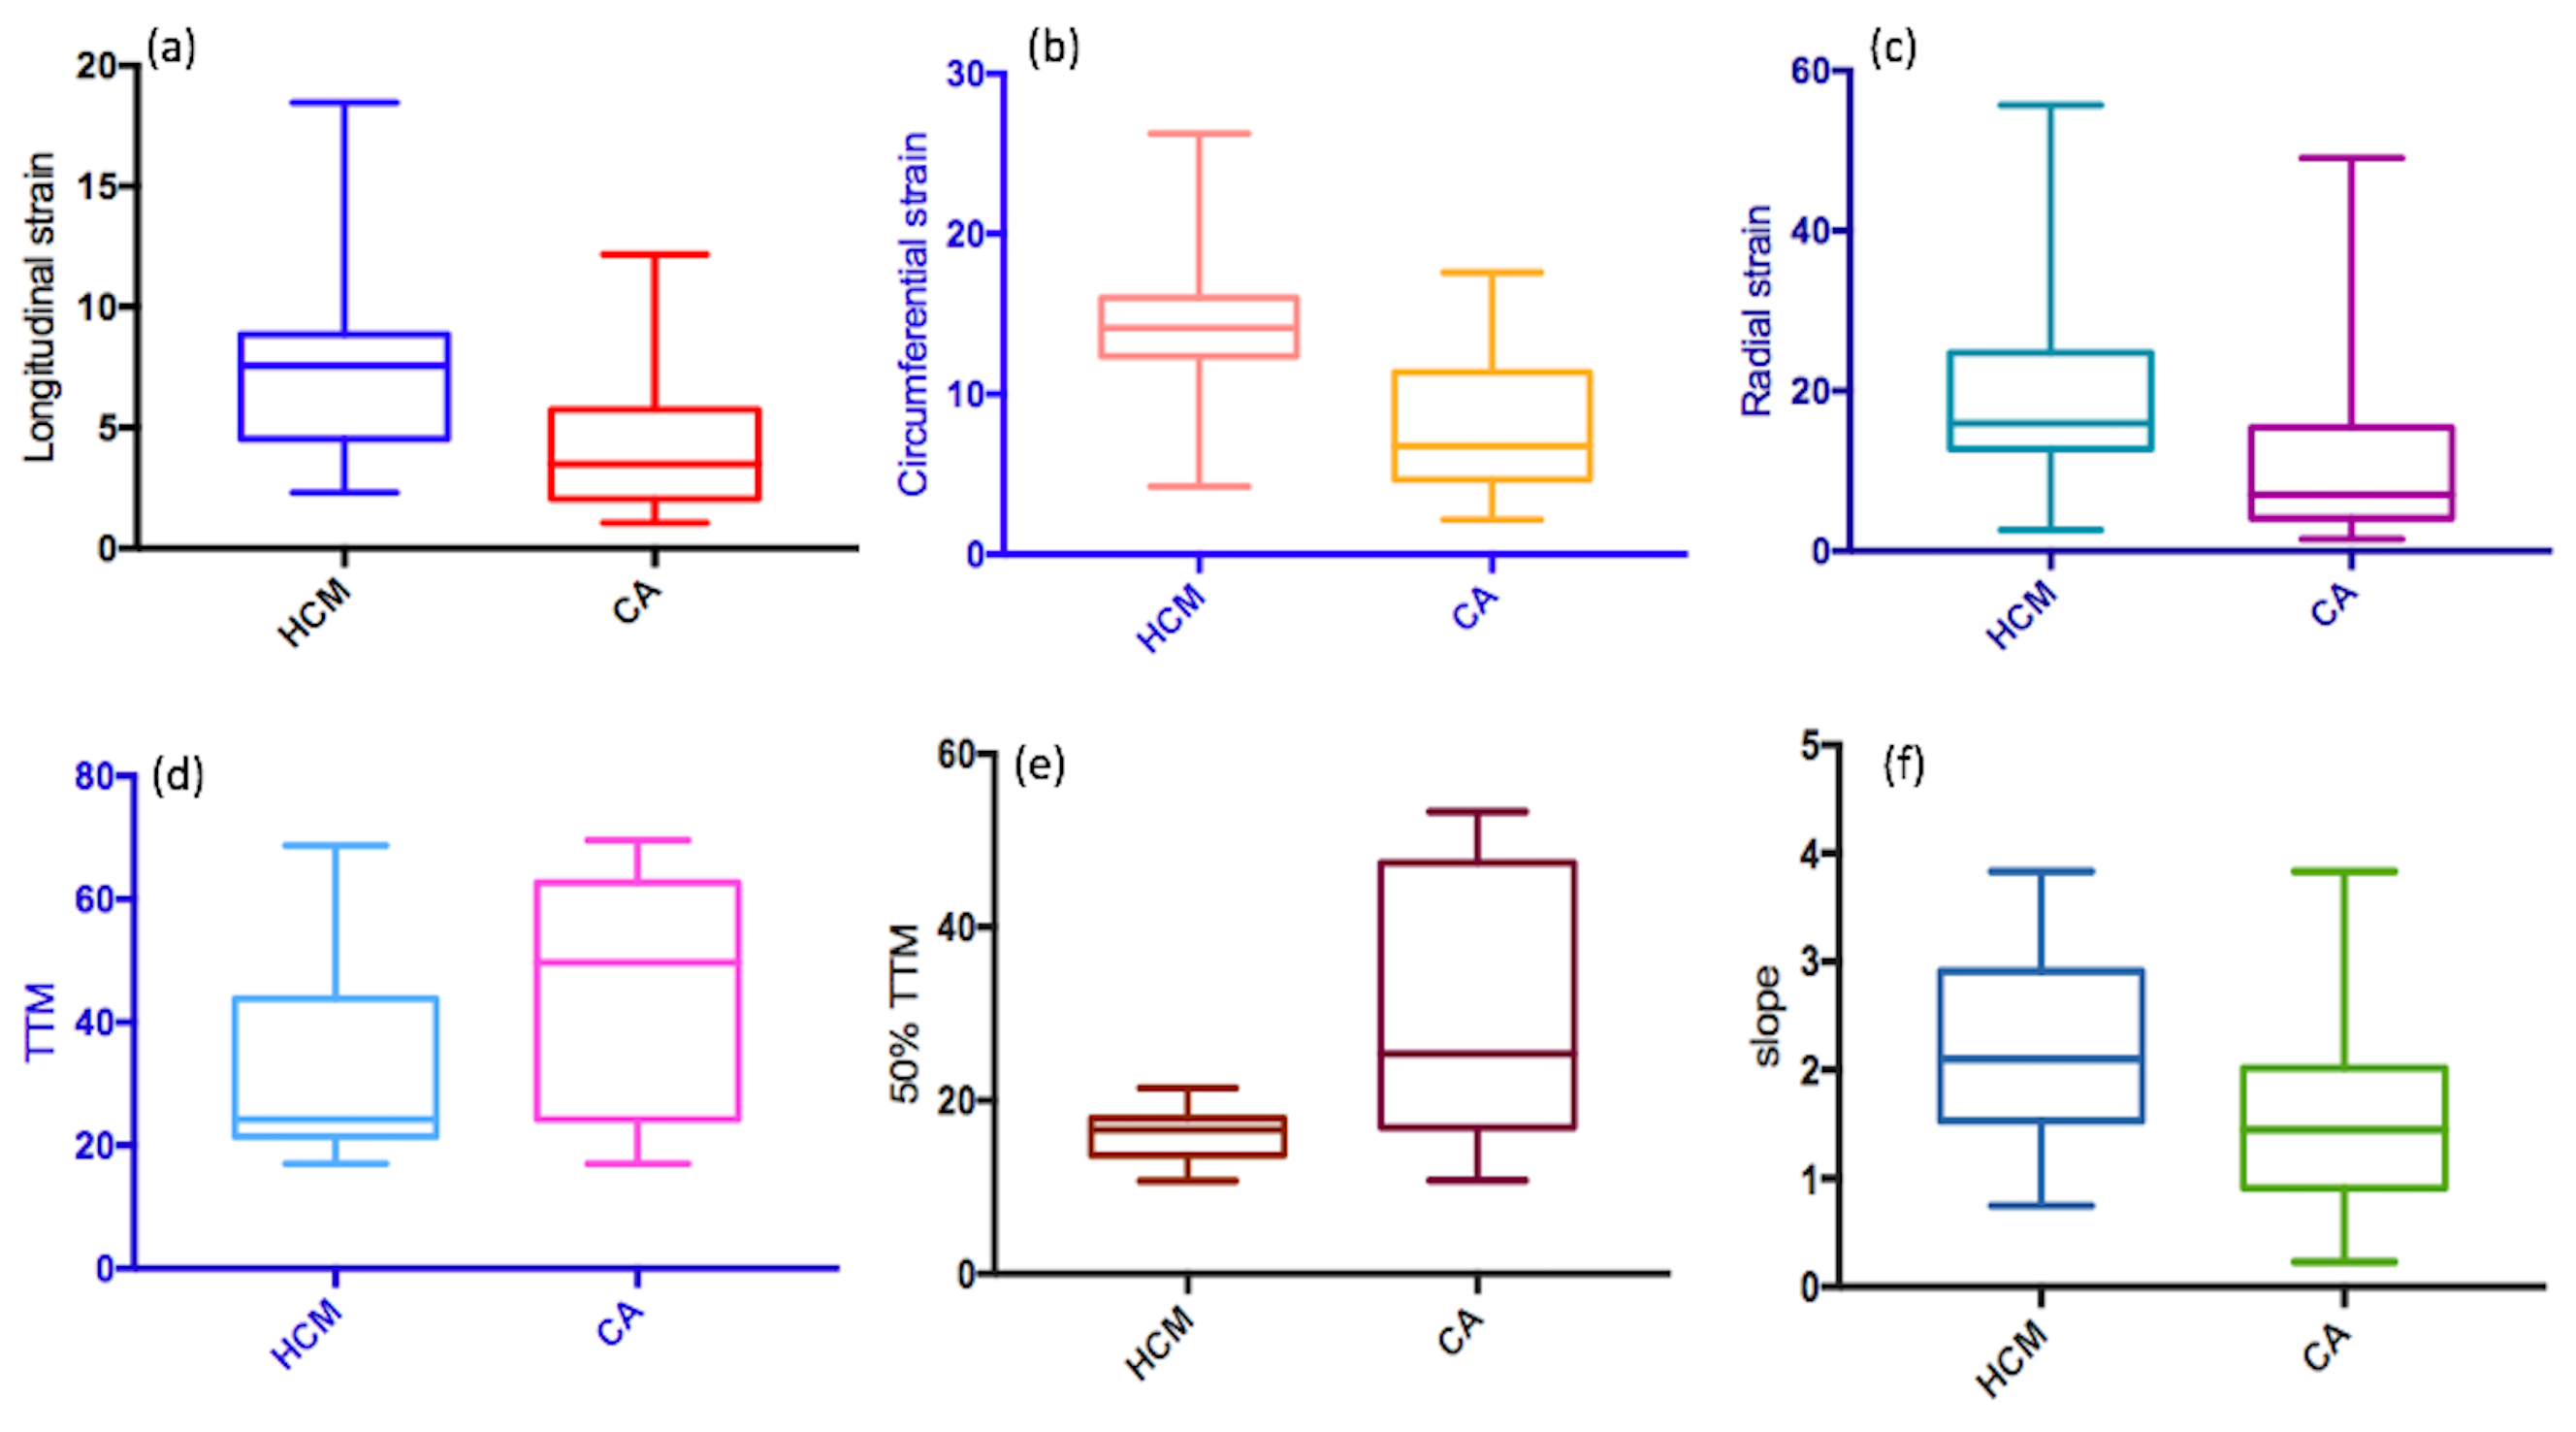
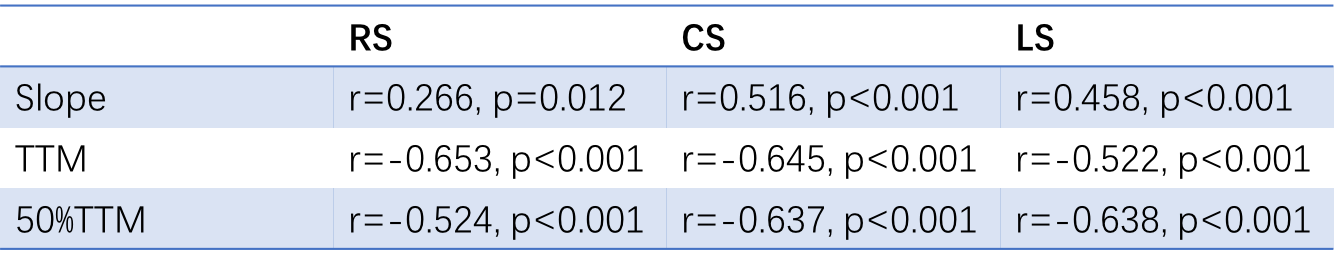
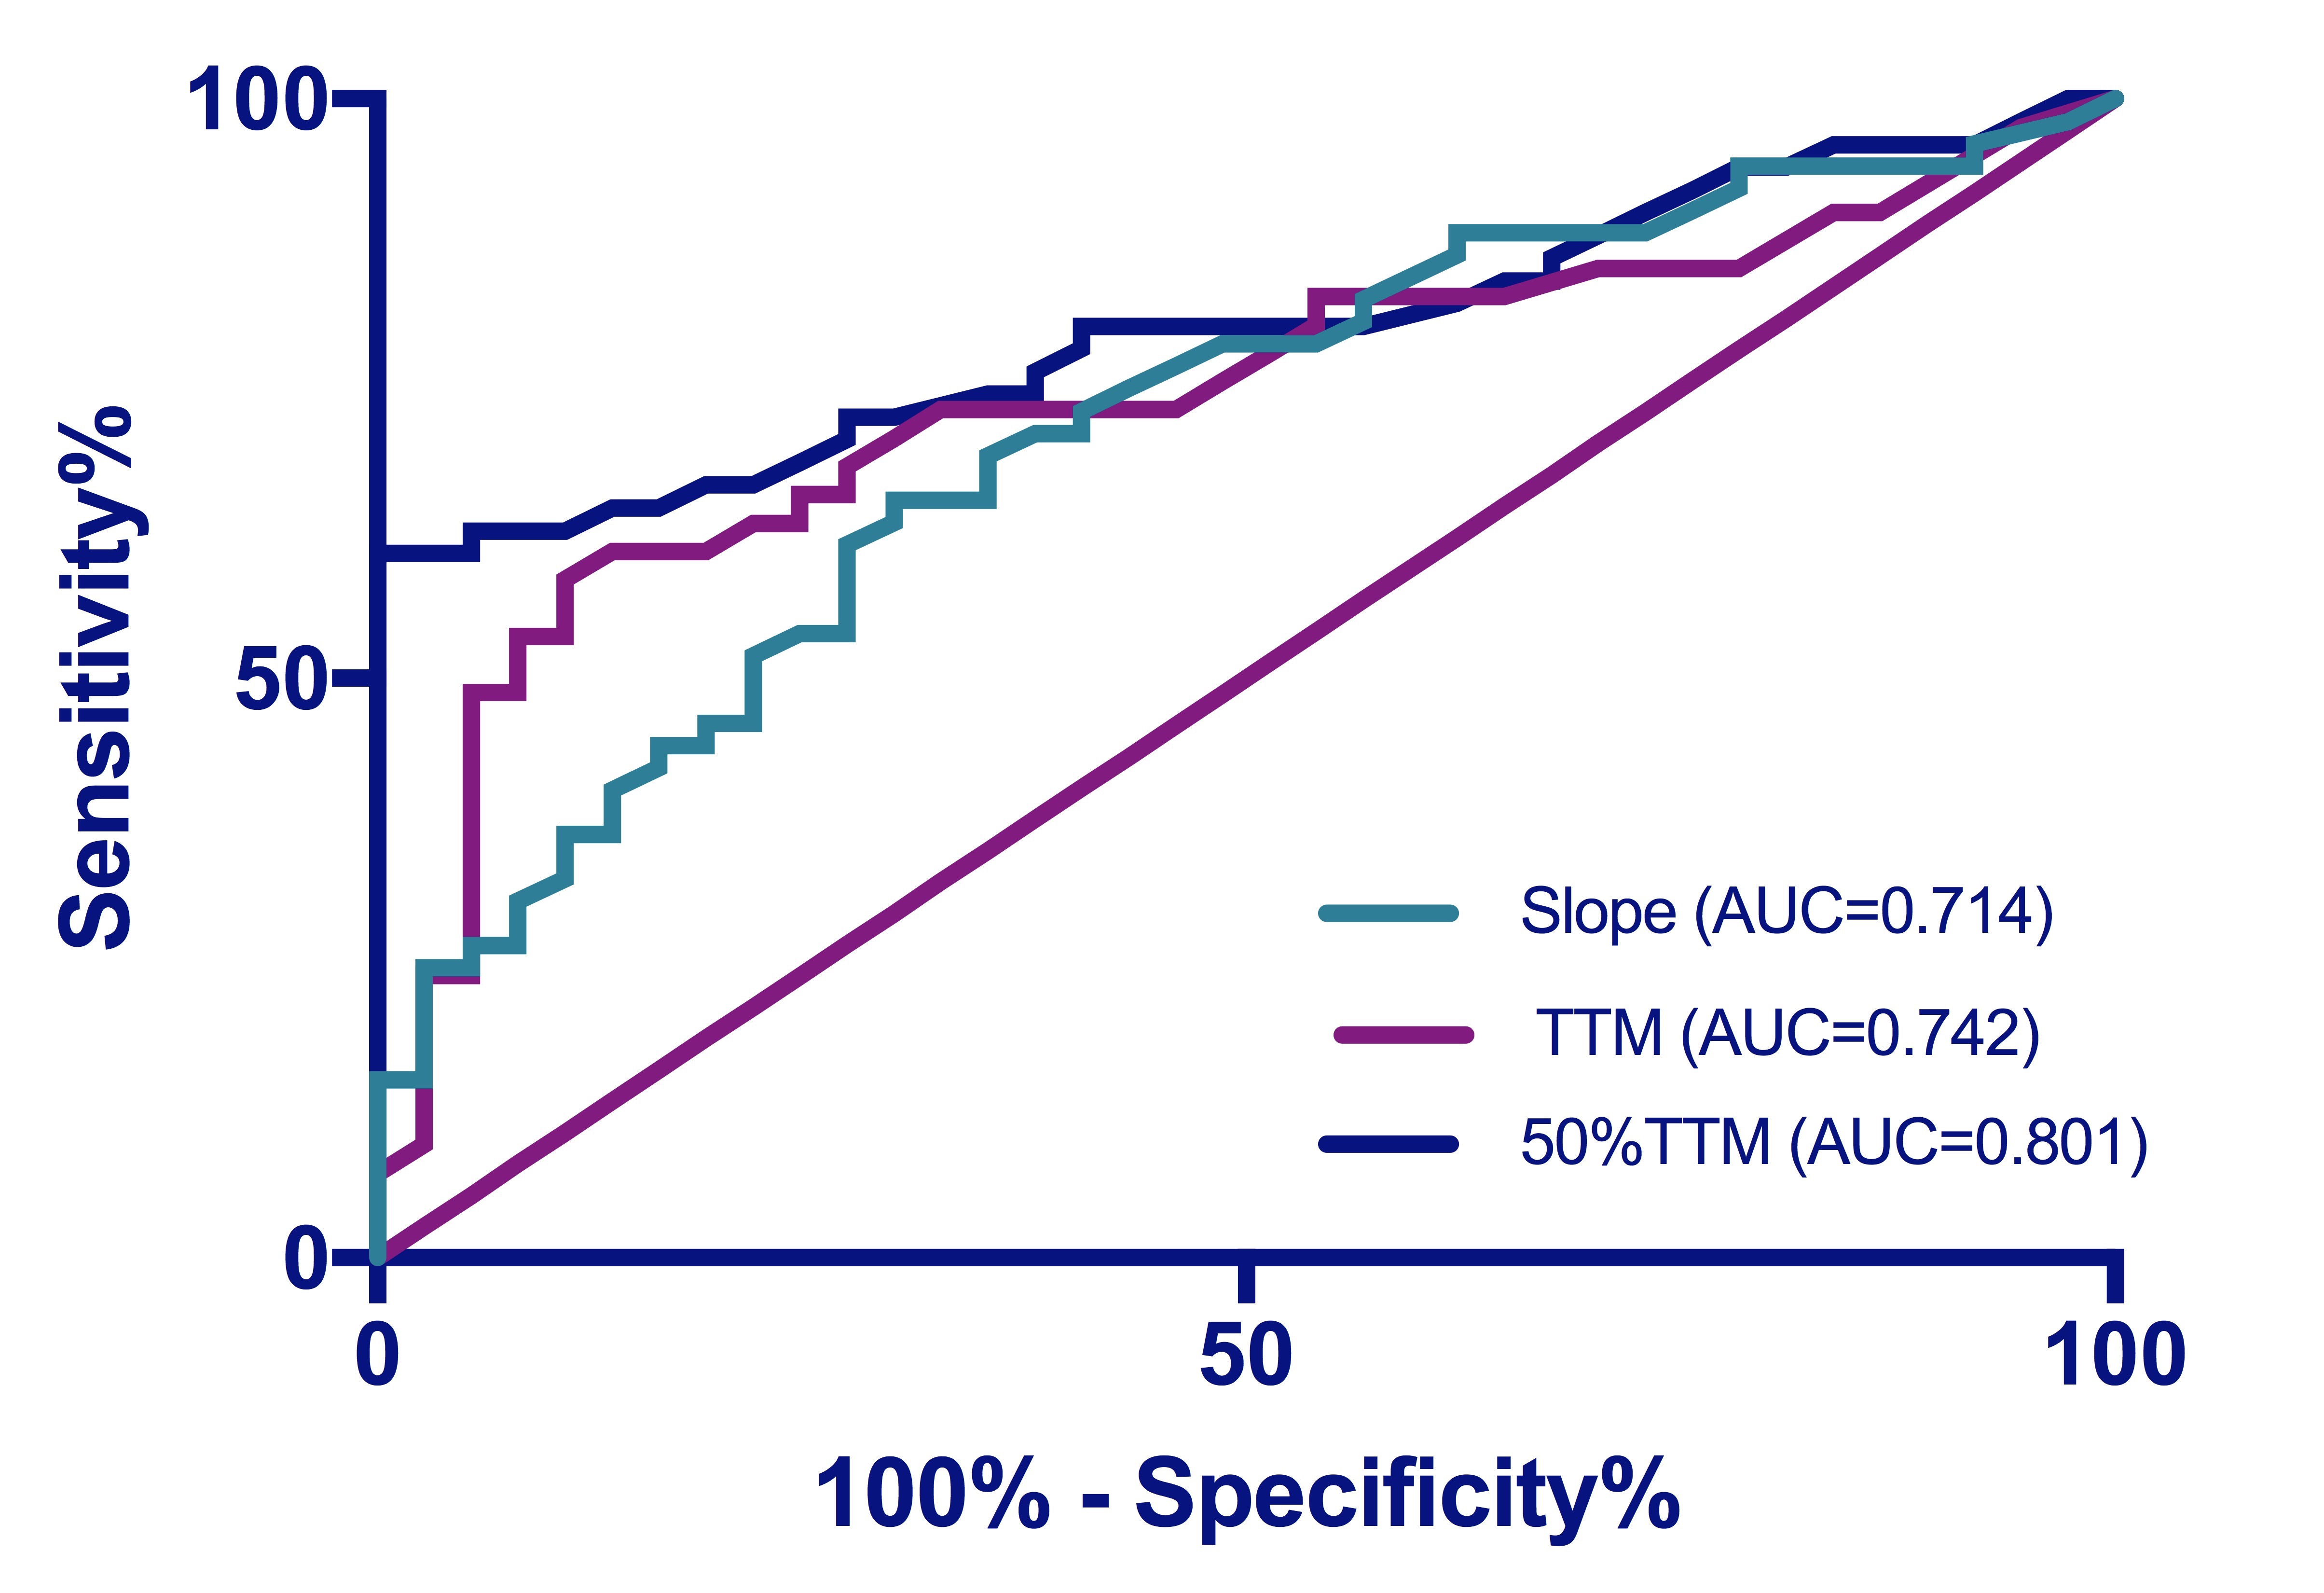
In total, 165 thickened segments in CA and 182 in HCM with WT >12mm (maximum WT 17.8 ± 3.8mm in CA vs. 18.0 ± 3.2 in HCM, p= 0.45) were evaluated. Thickened CA segments demonstrated more impaired myocardial strain and microvascular function compared with HCM segments with the same WT (Table 1 and Figure 2). There were significant correlations between myocardial perfusion and systolic function (Table 2). The ROC analysis of 50%TTM demonstrated an AUC=0.801, sensitivity=60.8%, and specificity=100% at the best cut-off point (50%TTM=22.3) in CA and HCM groups (ROC analyses results shown in Figure 3).Discussion and conclusions
We proposed to use first-pass perfusion function to compare the microvascular disorder in two different phenotypes of thickened hearts. Our results demonstrated that amyloid infiltration impair the regional microvascular system and systolic function more seriously than HCM characterized with cellular hypertrophy. Regional myocardial mechanics are significantly influenced by microvascular function.Acknowledgements
No acknowledgement found.References
1. Task A, Elliott PM, Uk C, et al. 2014 ESC Guidelines on diagnosis and management of hypertrophic cardiomyopathy. Eur Heart J. 2014;35(39):2733-2779. doi:10.1093/eurheartj/ehu284
2. Pagourelias ED, Mirea O, Vovas G, et al. Relation of regional myocardial structure and function in hypertrophic cardiomyopathy and amyloidois: a combined two-dimensional speckle tracking and cardiovascular magnetic resonance analysis. Eur Heart J Cardiovasc Imaging. 2018;(August):1-12. doi:10.1093/ehjci/jey107
3. Li R, Yang ZG, Wen LY, et al. Regional myocardial microvascular dysfunction in cardiac amyloid light-chain amyloidosis: Assessment with 3T cardiovascular magnetic resonance. J Cardiovasc Magn Reson. 2016;18(1):1-11. doi:10.1186/s12968-016-0240-7
Figures