2185
Regional Heterogeneity of Errors in Myocardial Perfusion Quantification Using Bolus-Based MRI1Chair of Cellular and Molecular Imaging, Comprehensive Heart Failure Center, University Hospital Wuerzburg, Wuerzburg, Germany, 2Dept. of Biomedical Engineering & Physics, Academic Medical Center, Amsterdam, Netherlands
Synopsis
Aim of the project is the computational modeling of contrast agent dispersion in coronary arteries down to pre-arteriolar level during contrast-enhanced MRI myocardial perfusion measurements. From a high resolution imaging cryomicrotome dataset a vascular 3D model of the left main coronary artery is extracted and furnished with a computational grid. Using an advanced boundary condition, Navier-Stokes equations for blood flow and the advection-diffusion equation for CA transport are solved to obtain CA bolus dispersion values on this model of unprecedented detail, and to analyze myocardial blood flow quantification errors. The analysis of the obtained results shows strong variability on the cm-scale.
Introduction
Dynamic contrast agent (CA) bolus-based quantitative perfusion imaging of the heart is subject to systematic errors due to contrast agent dispersion in the coronary arteries 1-3. Dispersion cannot be accounted for by assessment of the arterial input function (AIF) because for technical reasons its concentration-time curve is measured in the left ventricle and not at the direct voxel inlet.
In order to make an error correction of myocardial blood flow (MBF) and subsequent myocardial perfusion reserve (MPR) quantification feasible, a deep understanding of the underlying effects influencing mass transport in the coronary arteries is necessary.
In previous studies, several factors (e.g. flow velocity, length, curvature, branching angles, pathological alterations) influencing CA dispersion were analyzed, showing strongly heterogeneous impact on subsequent quantification of MBF and MPR.
In this work, CA transport through the full healthy porcine coronary vasculature down to vessels at pre-arteriolar level is performed in order to analyze regional variability of MBF and MPR quantification errors.
Methods
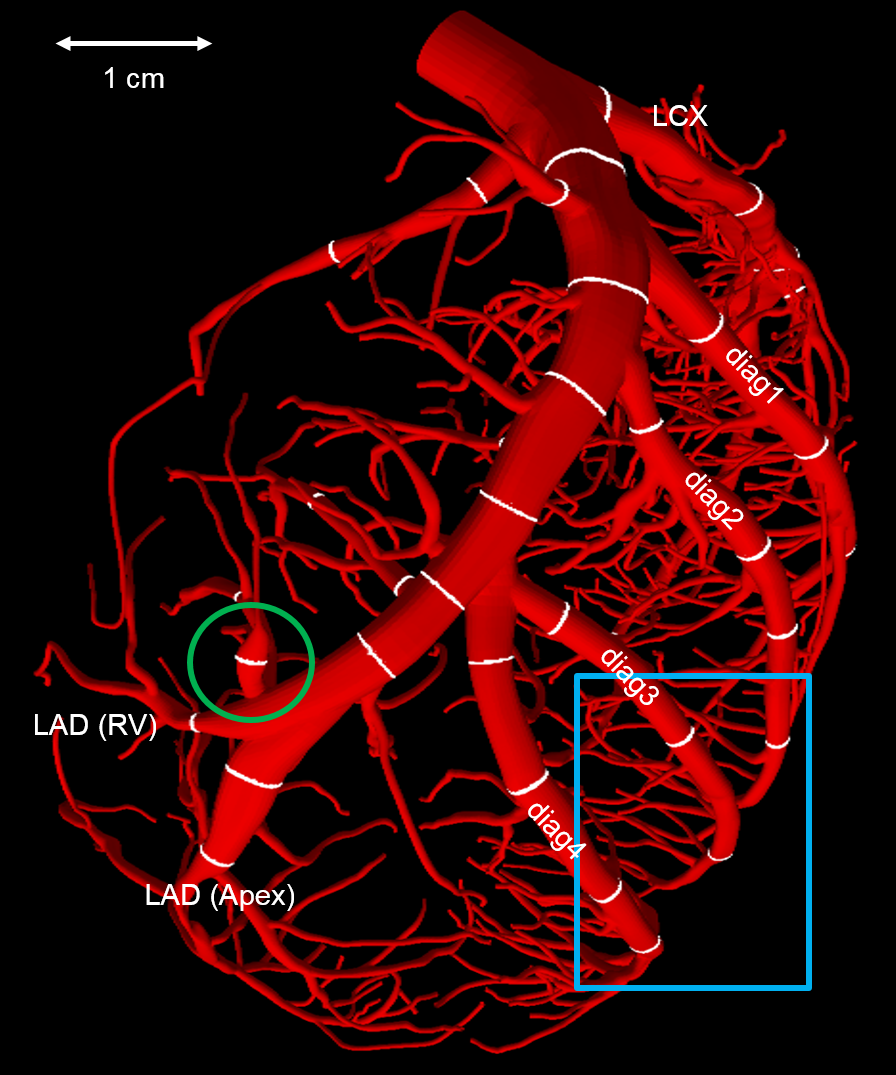
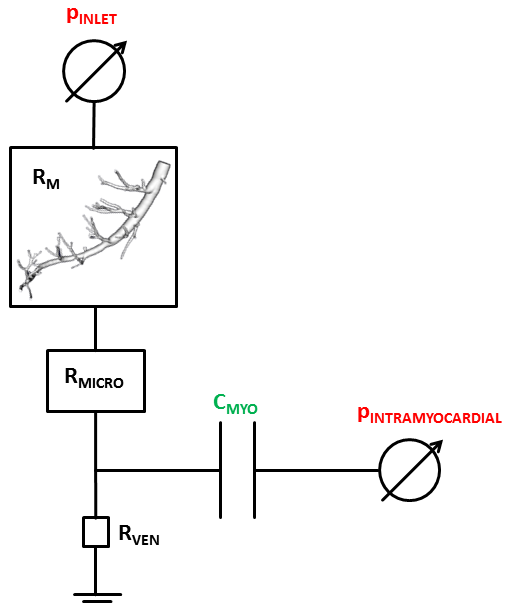
With a dedicated software package (SimVascular Vs. 2, SimTK, simvascular.github.io 4) a 3D model of the left main coronary artery (LMCA) is extracted from a high-resolution imaging cryomicrotome dataset 5-7 (Figure 1). Subsequently, in a largely automated procedure (cfMesh, Creative Fields, London, United Kingdom, https://cfmesh.com) the cardiovascular model is discretized with a computational grid of mainly hexahedral type. Afterwards, computational fluid dynamics (CFD) simulations are performed in a two-step procedure. First the Navier-Stokes equations are solved for blood flow, using a specifically designed advanced boundary condition to model inlet volume flow (Figure 2) 8,9. The resulting physical fields are then stored on disk for one full cardiac cycle. In the second step, these fields are repeatedly read in to compute CA transport through the geometry over several cardiac cycles.
At the cross sections
in the large left coronary epicardial arteries, marked in white in Figure 1, the dispersed AIFs
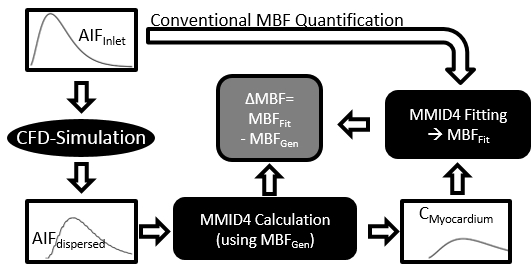
are quantified at both rest and stress. Subsequently, with the workflow shown
in Figure 3, $$$ΔMBF= MBF_{Fit} – MBF_{Gen}$$$ (cf. Figure 3) values are estimated by use of the
tissue perfusion model MMID410. This is done at
both resting and hyperemia condition, allowing an approximation of the error of
the following quantification of the MPR, defined as $$$MPR=MBF_{Stress}/MBF_{Rest}$$$.
Results
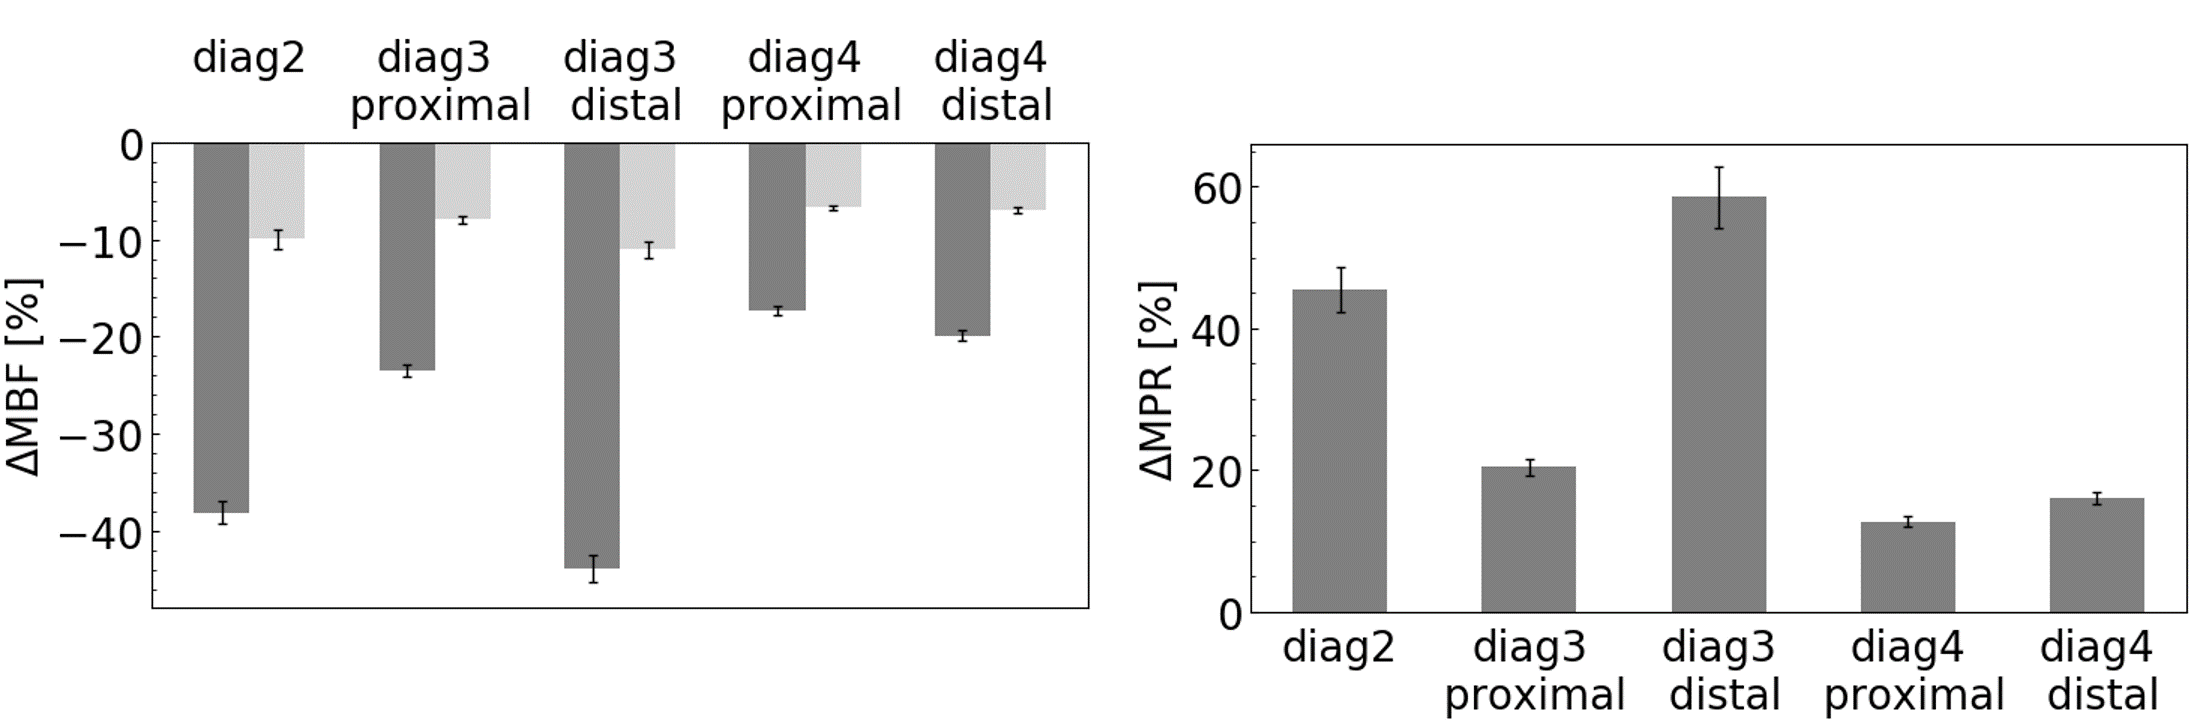
The obtained values of ΔMBF at the considered cross sections amount to mean values of -18.6±12.1% (range: -3-(-63)%) at rest and -6.6±2.4% (range: -3-(-16)%) at stress, resulting in a mean ΔMPR of 18±22% with a maximum of 127±16%. The extremal values for both ΔMBFRest,Stress and ΔMPR quantification are observed in the steep bifurcation encircled in green in Figure 1.
In order to reveal the effects of this strong heterogeneous regional variability on MBF quantification, the cross sections in the blue square in Figure 1 are compared. The resulting errors ΔMBFRest,Stress and ΔMPR are shown in Figure 4, ranging between -17-(-44)% for rest MBF quantification. Analogous to the results obtained across the whole LMCA, the region in the blue square also shows non-negligible MBF underestimation. Accordingly, the obtained overestimation of MPR ranging between 13-59%, demonstrates a similar spread.
Discussion
As expected, the obtained errors for both ΔMBF and ΔMPR are in accordance with what is found in previous studies 1,11. The regional heterogeneity of the MBF error due to bolus dispersion may be introduced by varying bifurcation angles, intraluminal CA concentration gradients as well as variations of the blood flow velocities as well as vessel curvature 2,3,12.
Across the whole myocardium, the values of ΔMBFRest,Stress and ΔMPR show great variance. Moreover, also on a smaller scale, the errors are subject to strong variability. On the other hand, it must be kept in mind that effects from the downstream vasculature are not incorporated in this analysis. Similar to reference 3, the microvasculature bed may reduce dispersion effects. Considering the fact that MBF itself is strongly heterogeneous on a mm scale 13,14, the presented results reflect the severity of the influence of CA dispersion in bolus-based perfusion measurements in general, however, particularly with regard to MRI.
Conclusion
Depending on the underlying supplying epicardial vasculature, bolus dispersion-based variations of the local arterial input function may induce significant errors in high-resolution quantitative perfusion MRI measurements. The results do not only apply to MRI measurements, but emphasize the problems of bolus-based perfusion quantification techniques independent of the imaging modality used.Acknowledgements
We acknowledge financial support of German Ministry of Education and Research (BMBF, grant: 01E1O1504). We acknowledge LRZ for access to Linux-Cluster, Munich, Germany.References
1. Graafen, D., Hamer, J., Weber, S., et al., Quantitative myocardial perfusion magnetic resonance imaging: the impact of pulsatile flow on contrast agent bolus dispersion. Physics in Medicine and Biology, 2011. 56: p. 5167-5185.
2. Sommer, K., Schmidt, R., Graafen, D., et al., Contrast Agent Bolus Dispersion in a Realistic Coronary Artery Geometry: Influence of Outlet Boundary Conditions. Annals of Biomedical Engineering, 2013. 42(4): p. 787-796.
3. Martens, J., Panzer, S., van den Wijngaard, J., et al., Analysis of coronary contrast agent transport in bolus-based quantitative myocardial perfusion MRI measurements with computational fluid dynamics simulations, in Proceedings of FIMH 2017 (Toronto). Springer LNCS. 10263, pp. 369-380.
4. Updegrove, A., Wilson, N., Merkow, J., et al., SimVascular: An Open Source Pipeline for Cardiovascular Simulation. Ann Biomed Eng, 2017. 45(3): p. 525-541.
5. Spaan, J.A.E., ter Wee, R., van Teeffelen, J., et al., Visualisation of intramural coronary vasculature by an imaging cryomicrotome suggests compartmentalisation of myocardial perfusion areas. Medical and Biological Engineering and Computing, 2005. 43: p. 431-435.
6. van den Wijngaard, J.P.H.M., Schulten, H., van Horssen, P., et al., Porcine Coronary Collateral Formation in the Absence of a pressure gradient remote of the iscemic border zone. Am J Physiol Heart Circ Physiol, 2010. 300: pp. H1930-H1937.
7. van den Wijngaard, J.P.H.M., van Lier, M., Spaan, J., et al., 3D Imaging of vascular networks for biophysical modeling of perfusion distribution within the heart. Journal of Biomechanics, 2012. 46: p. 229-239.
8. Kim, H.J., Vignon-Clementel, I., Coogan, J., et al., Patient-specific modeling of blood flow and pressure in human coronary arteries. Ann Biomed Eng, 2010. 38(10): p. 3195-209.
9. Itu, L., Sharma, P., Mihalef, V., et al., A Patient-Specific Reduced-Order Model for
Coronary Circulation. IEEE, 2012. 12: p. 832-835.
10. Kroll, K., Wilke, N., Jerosch-Herold, M., et al., Modeling regional myocardial flows from residue functions of an intravascular indicator. American Journal of Physiology, 1996. 27 (4 Pt 2): H1643-1655.
11. Sommer, K., Bernat, D., Schmidt, R., et al., Resting myocardial blood flow quantification using contrast-enhanced magnetic resonance imaging in the presence of stenosis: A computational fluid dynamics study. Medical Physics, 2015. 42(7): p. 4375-4384.
12. Graafen, D., Münnemann, K., Weber, S., et al., Quantitative contrast-enhanced myocardial perfusion magnetic resonance imaging: Simulation of bolus dispersion in constricted vessels. Medical Physics, 2009. 36(7): p. 3099-3106.
13. Chareonthaitawee, P., Kaufmann, P., Rimoldi, O., et al., Heterogeneity of resting and hyperemic myocardial blood flow in healthy humans. Cardiovascular Research, 2001. 50: p. 151-161.
14. Hoffmann, J.I.E., The history of the microsphere method for measuring blood flows with special reference to myocardial blood flow: a personal memoir. Am J Physiol Heart Circ Physiol, 2017. 312(4): p. H705-H710.
15. Burattini, R., Sipkema, P., van Huis, G., et al., Identification of canine coronary resistance and intramyocardial compliance on the basis of the waterfall model. Annals of Biomedical Engineering, 1985. 13: p. 385-404.
16. Huo, Y. and G.S. Kassab, The scaling of blood flow resistance: from a single vessel to the entire distal tree. Biophys J, 2009. 96(2): p. 339-46.
17. Layland, J., Carrick, D., Lee, M., et al., Adenosine: physiology, pharmacology, and clinical applications. JACC Cardiovasc Interv, 2014. 7(6): p. 581-91.
Figures