2184
High Resolution Simulation of B0 Field Conditions in the Human Heart Based on Segmented CT Images1Department of Biomedical Engineering, Columbia University in the City of New York, New York, NY, United States, 2Section of Medical Physics, Department of Radiology, Mainz University Hospital, Mainz, Germany, 3Department of Radiology, Columbia University in the City of New York, New York, NY, United States, 4Department of Cellular and Molecular Imaging, Comprehensive Heart Failure Center (CHFC), Wuerzburg, Germany
Synopsis
B0 inhomogeneity leads to dark band artifacts in cardiac MRI, in particular with the use of steady-state free precession (SSFP) pulse sequences. Limited spatial resolution of MRI-derived in vivo B0 maps and, moreover, the lack of population data prevents the systematic analysis of the problem at hand and the development of optimized B0 shim strategies. We used readily available CT images to derive the B0 conditions in the human heart at very high resolution. Calculated cardiac B0 fields showed consistency with MRI-based B0 measurements and local field artifacts concur with typical dark band locations. The approach is expected to enable the development of population-specific B0 shim strategies for the
Introduction
A common artifact in cardiac MRI is signal loss around the myocardium, known as dark band artifact (Figure 1), and fast MRI methods such as SSFP sequences are particularly vulnerable. The main cause of this artifact are localized B0 field inhomogeneities due to susceptibility differences between heart tissue and the lungs1,2,3. Potential artifact reduction by shortening the sequence repetition time is limited by SAR concerns and tissue heating, and only the physical B0 homogenization through B0 shimming promises a true remedy4. Spherical harmonic (SH) shimming up to the second order5 as well as a preliminary analysis of higher order SH and dynamic multi-coil (MC) B0 shimming6 demonstrated the benefits of dynamic approaches over static B0 shimming. To date, however, the limited resolution of MRI-derived in vivo B0 maps and, moreover, the limited availability of sufficiently sized population data, e.g. pediatric or elderly, prevents the comprehensive analysis of the problem at hand. B0 conditions in the human heart have been simulated from anthropometric phantoms7. Here we propose to use readily available CT images to derive the cardiac B0 distributions at very high resolution, thereby enabling the development of optimized subject- and population-specific B0 shim approaches. Methods
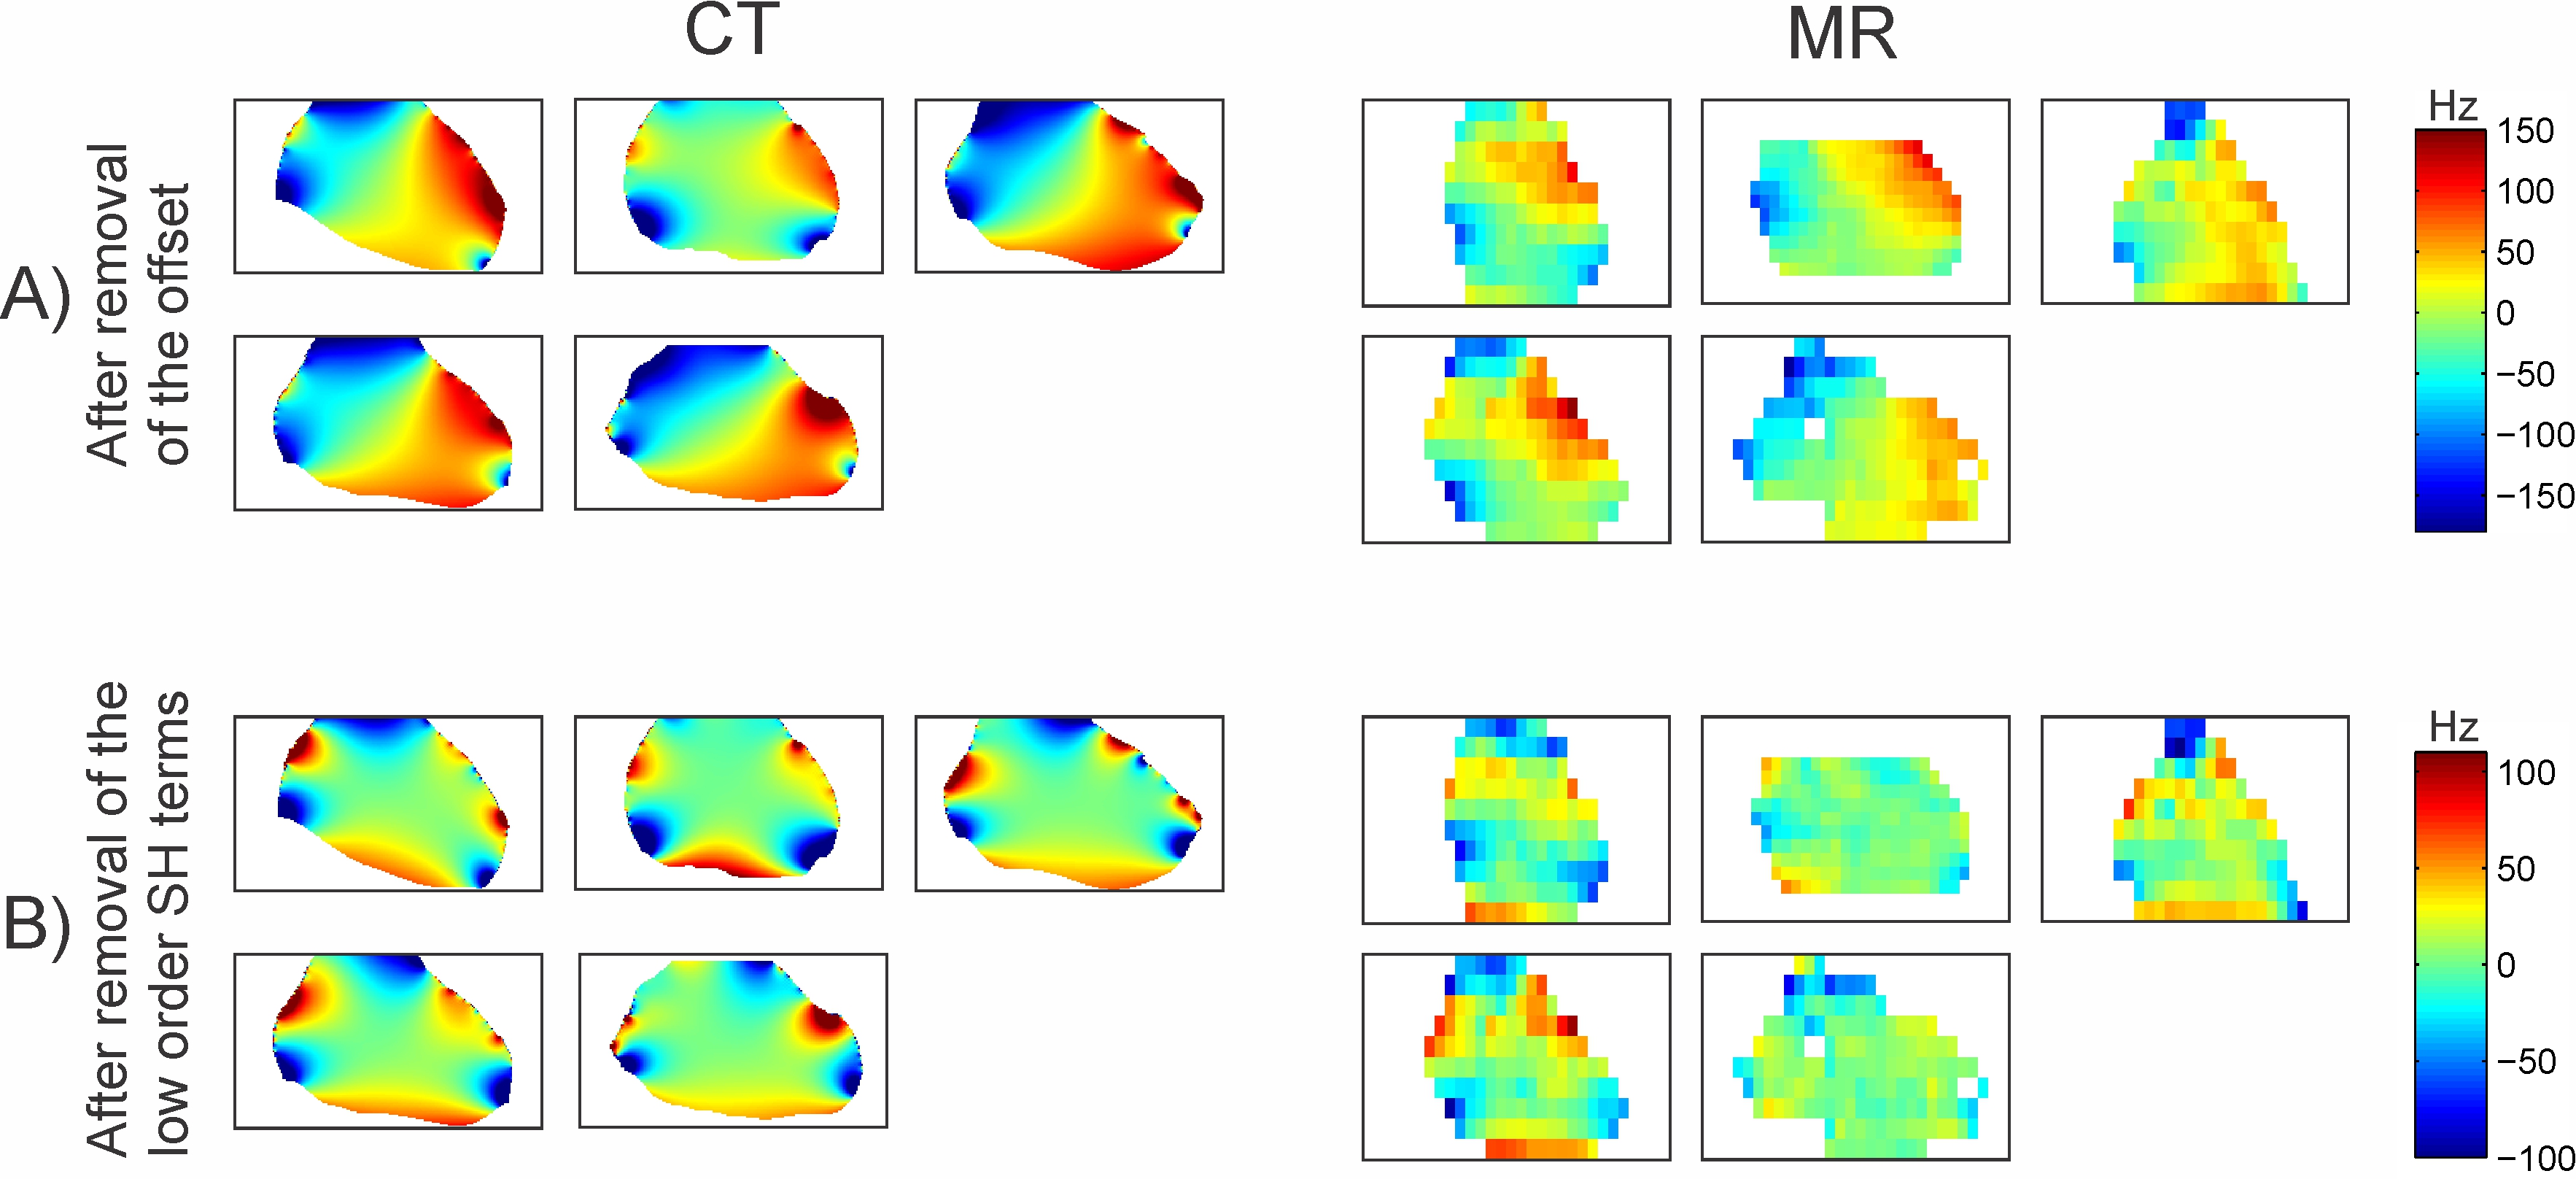
The B0 field conditions in the human heart of 5 subjects (2 male, 3 female) were calculated based on synthesized magnetic susceptibility distributions derived from high-resolution clinical CT images. To this end, whole thorax 3D CT images of 0.8x0.8 mm2 resolution (or better) were down-sampled to 1 mm isotropic resolution and segmented in tissue and lung compartments before susceptibility values of -9 ppm and 0 ppm were assigned respectively8. The synthesized susceptibility maps were then used to simulate the B0 field distribution throughout the thorax including the heart area using customized B0DETOX9,10 software based on numerical methods described previously11,12 (Figure 2). The 3-dimensional heart was automatically segmented from the CT images based on its boundary to the lungs (Figure 3, algorithm written in Matlab, Mathworks, Natick, MA, USA) and used as region-of-interest (ROI) for further analysis. The B0 maps synthesized from segmented CT images were compared to a sample of MRI-derived in vivo B0 field maps from five different healthy volunteers (1 male, 4 female) acquired with a multi-echo gradient-echo sequence (resolution 5.5x5.5x11.0 mm3, TE=2.00/3.17/4.37/5.57 ms) on a 3T MAGNETOM Prisma (Siemens, Erlangen, Germany). Since the cardiac phase of the CT images was undefined, the derived B0 shapes were compared to the last diastolic phase of the 9-phase MRI-derived B0 measurement. Simulated and in vivo field maps were assessed after offset removal and after elimination of first and second order SH terms to eliminate the impact of overall subject positioning and to provide an unobstructed view on the localized field distributions that are hypothesized to cause the dark band artifacts.Results
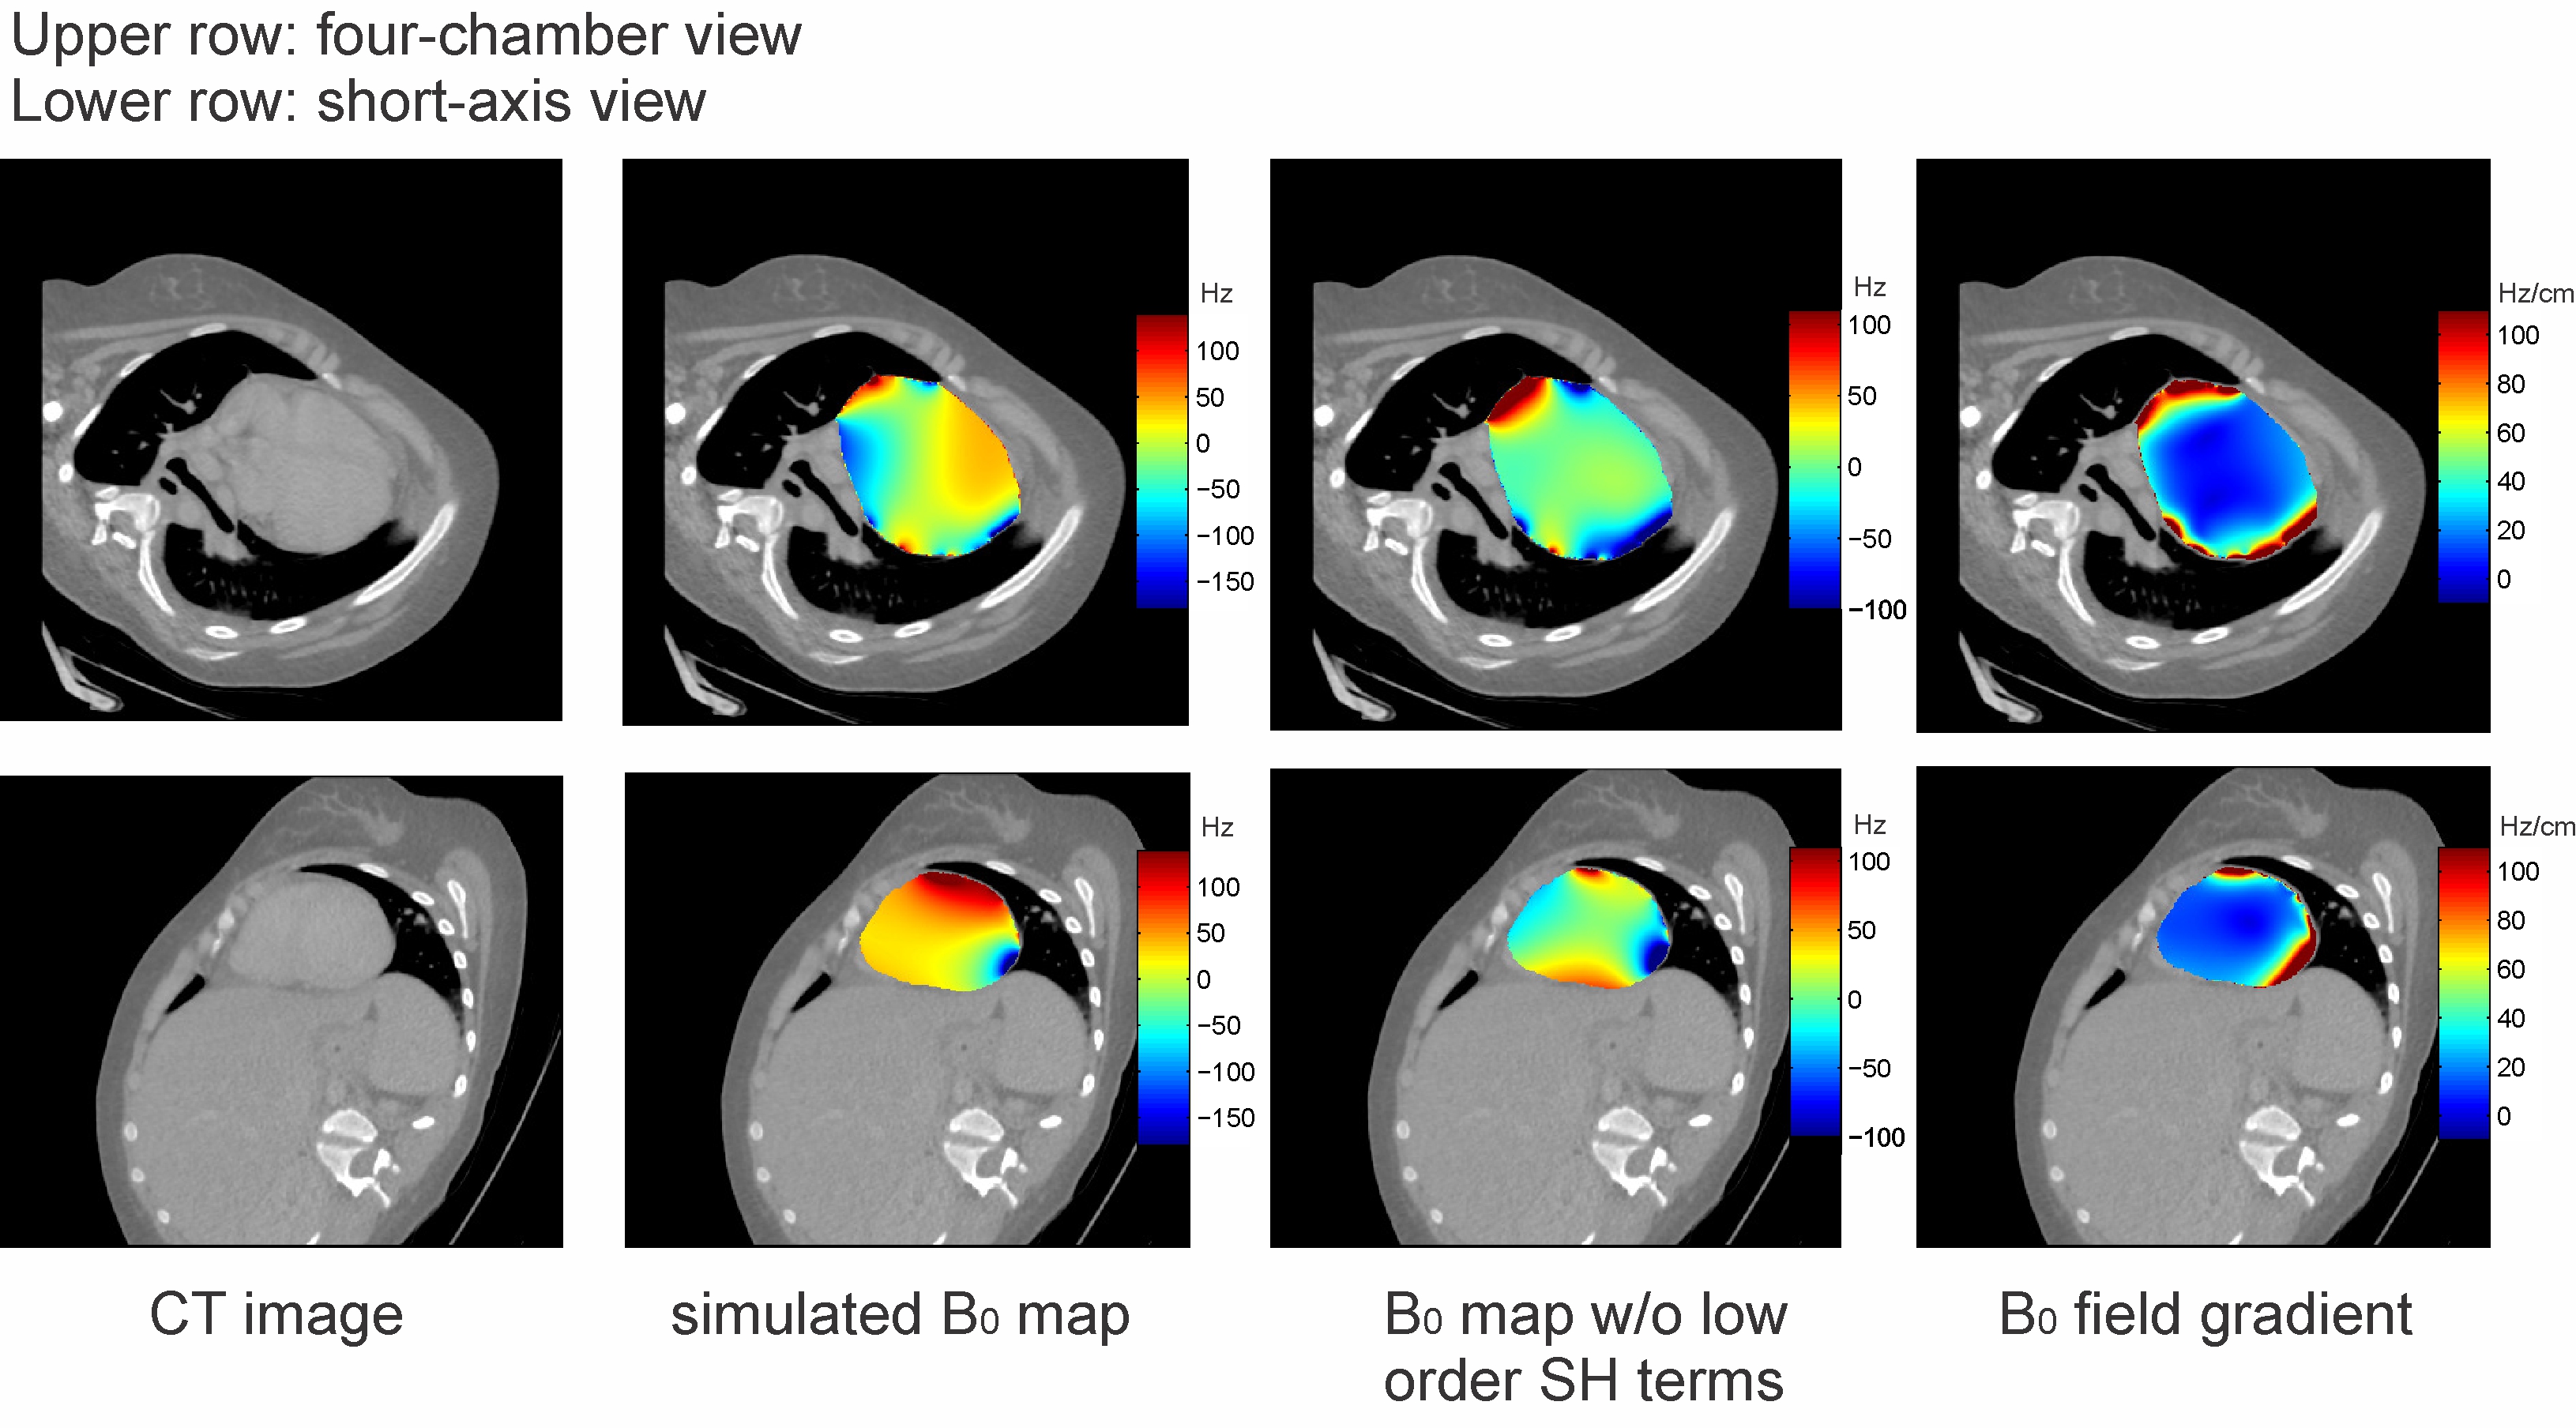
Simulated field maps exhibit field variations at the various tissue-air boundaries in the human thorax, with particularly strong and localized terms at the tips of the lung (Figures 2B/C). The simulated B0 field patterns are consistent across all CT-derived subjects and also with the corresponding B0 information measured in vivo. Besides an overall linear gradient roughly in the left-right direction of the heart (Figures 4A), distinct higher order patterns become apparent after removal of the low order field terms (Figures 4B). These strong regional B0 inhomogeneities and corresponding field gradients are located precisely in areas of the myocardium where dark band artifacts often occur in cardiac SSFP short-axis images (Figure 1 and 5). These field patterns are beyond the second SH order and are therefore hard to compensate with most clinical MR scanners lacking suitable B0 shim capability.Discussion
We demonstrated the consistency of cardiac B0 field distributions calculated from readily available clinical CT images with those specifically measured by MRI. While the subjects in the CT and MRI groups were not identical, similar overall patterns of local field inhomogeneity were found within and across groups. These field terms furthermore concurred with typical locations of dark band artifacts.
Future improvements will consider 1) potential susceptibility differences between various tissue types and bone, 2) cardiac phases, 3) potential dynamic effects, e.g. blood oxygenation levels, and 4) specific populations, e.g. with respect to age, gender, body type and cardiac disease (such as hypertrophic hearts vs. hearts with myocardial thinning). In addition, further validation of the presented B0 simulation technique with high resolution experimental B0 maps is warranted. The derivation of high-resolution B0 conditions from segmented CT images is expected to pave the way for the development of optimized population-specific cardiac B0 shim strategies using both standard clinical and state-of-the-art B0 shim technology.
Acknowledgements
We acknowledge financial support of German Ministry of Education and Research (BMBF, grant 01E1O1504).References
1. Earls JP, Ho VB, Foo TK, Castillo E, Flamm SD. Cardiac MRI: Recent Progress and Continues Challenges. J Magn Reson Imaging. 2002;16(2):111-127.
2. Ferreira PF, Gatehouse PD, Mohiaddin RH, Firmin DN. Cardiovascular magnetic resonance artefacts. J Cardiovasc Magn Reson. 2013;15(1):41.
3. Atalay MK, Poncelet BP, Kantor HL, Brady TJ, Weisskoff RM. Cardiac Susceptibility Artifacts Arising From the Heart-Lung Interface, Magn Reson Med. 2001;45(2):341–345.
4. Schär M, Kozerke S, Fischer SE, Boesiger P. Cardiac SSFP Imaging at 3 Tesla. Magn Reson Med. 2004;51(4):799–806.
5. Kubach MR, Bornstedt A, Hombach V, Merkle N, Schär M, Spiess J, Nienhaus GU, Rasche V. Cardiac phase-specific shimming (CPSS) for SSFP MR cine imaging at 3 T, Phys Med Biol. 2009;54(20):N476-N478.
6. Mattar W, Juchem C, Terekhov M, Schreiber L. Multi-Coil B0 shimming of the Human Heart: A Theoretical Assessment, Proc. ISMRM (2016), p. 1151.
7. Anderson DJ, Dendy JM, Paschal CB. Simulation Study of Susceptibility Gradients Leading to Focal Myocardial Signal Loss. J Magn Reson Imaging. 2008;28(6):1402-8.
8. Schenck JF. The role of magnetic susceptibility in magnetic resonance imaging: MRI magnetic compatibility of the first and second kinds. Med Phys. 1996;23(6):815-850.
9. Juchem C, Herman P, Sanganahalli BG, Brown PB, McIntyre S, Nixon TW, Green D, Hyder F, de Graaf RA. DYNAmic Multi-coIl TEchnique (DYNAMITE) shimming of the rat brain at 11.7T. NMR Biomed. 2014;27(8):897-906.
10. Juchem C. B0DETOX - B0 Detoxification Software for Magnetic Field Shimming. Columbia TechVenture (CTV), License CU17326. http://innovation.columbia.edu/technologies/cu17326_b0detox (2017).
11. Marques JP, Bowtell R. Application of a Fourier-Based Method for Rapid Calculation of Field Inhomogeneity Due to Spatial Variation of Magnetic Susceptibility. Concepts Magn Reson, 2005;25B(1):65-78.
12. Salomir R, Denis de Senneville B, Moonen CTW. A Fast Calculation Method for Magnetic Field Inhomogeneity due to an Arbitrary Distribution of Bulk Susceptibility. Concepts Magn Reson, 2003;19B(1):26-34.
13. Schreiber WG, Schmitt M, Kalden P, Mohrs OK, Kreitner KF, Thelen M. Dynamic Contrast-Enhanced Myocardial Perfusion Imaging Using Saturation-Prepared TrueFISP. J Magn Reson Imaging. 2002;16(6):641-652.
Figures
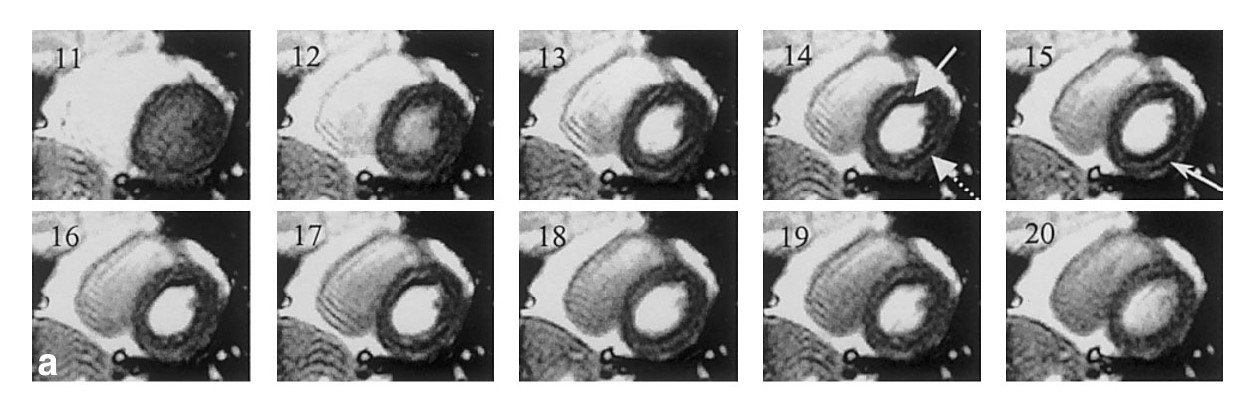
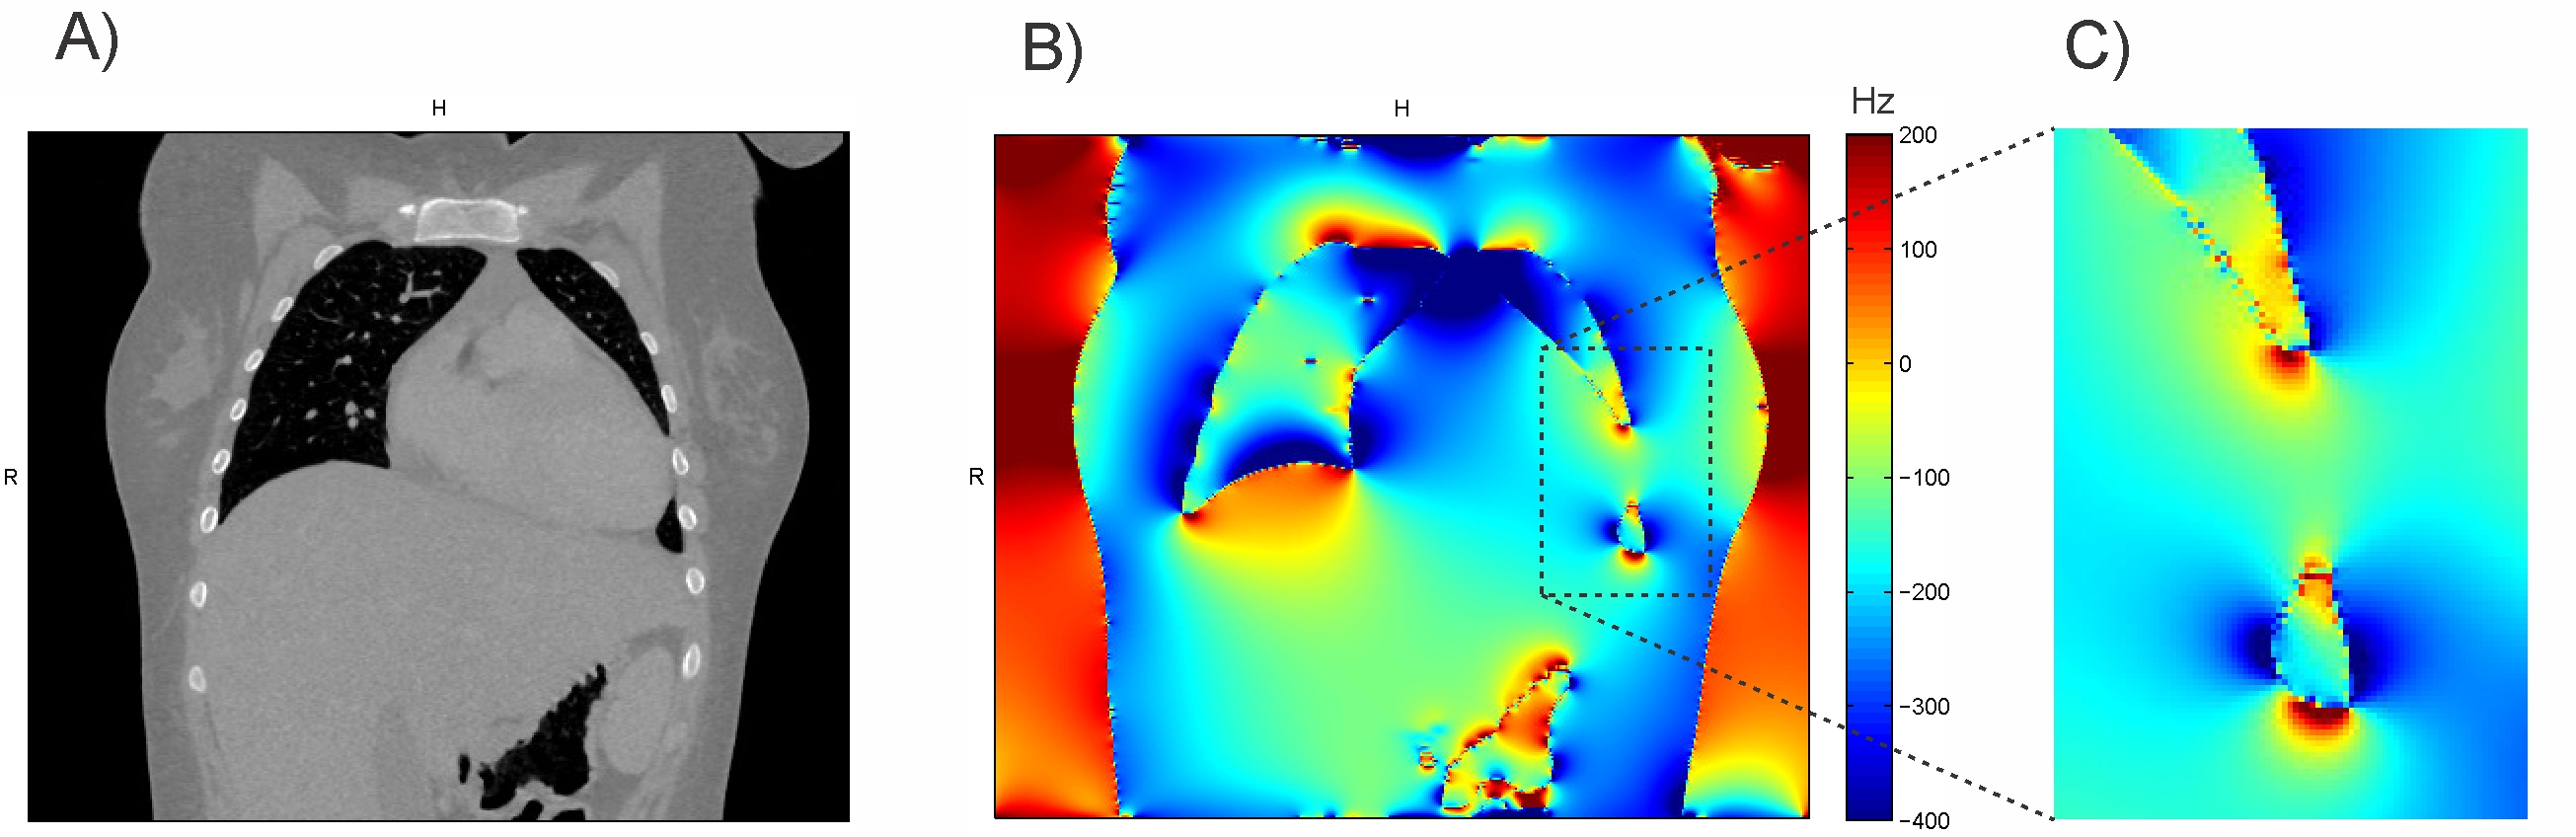
Figure 2. 3D simulation of susceptibility-induced B0 conditions in the human body at 3T. A) Coronal slice of a thoracic CT image. B) Susceptibility differences between air-filled lungs and tissue (including bone) lead to complex B0 variations throughout the body. C) Particularly strong and localized terms are observed at complex-shaped susceptibility boundaries including the tip of the lungs.
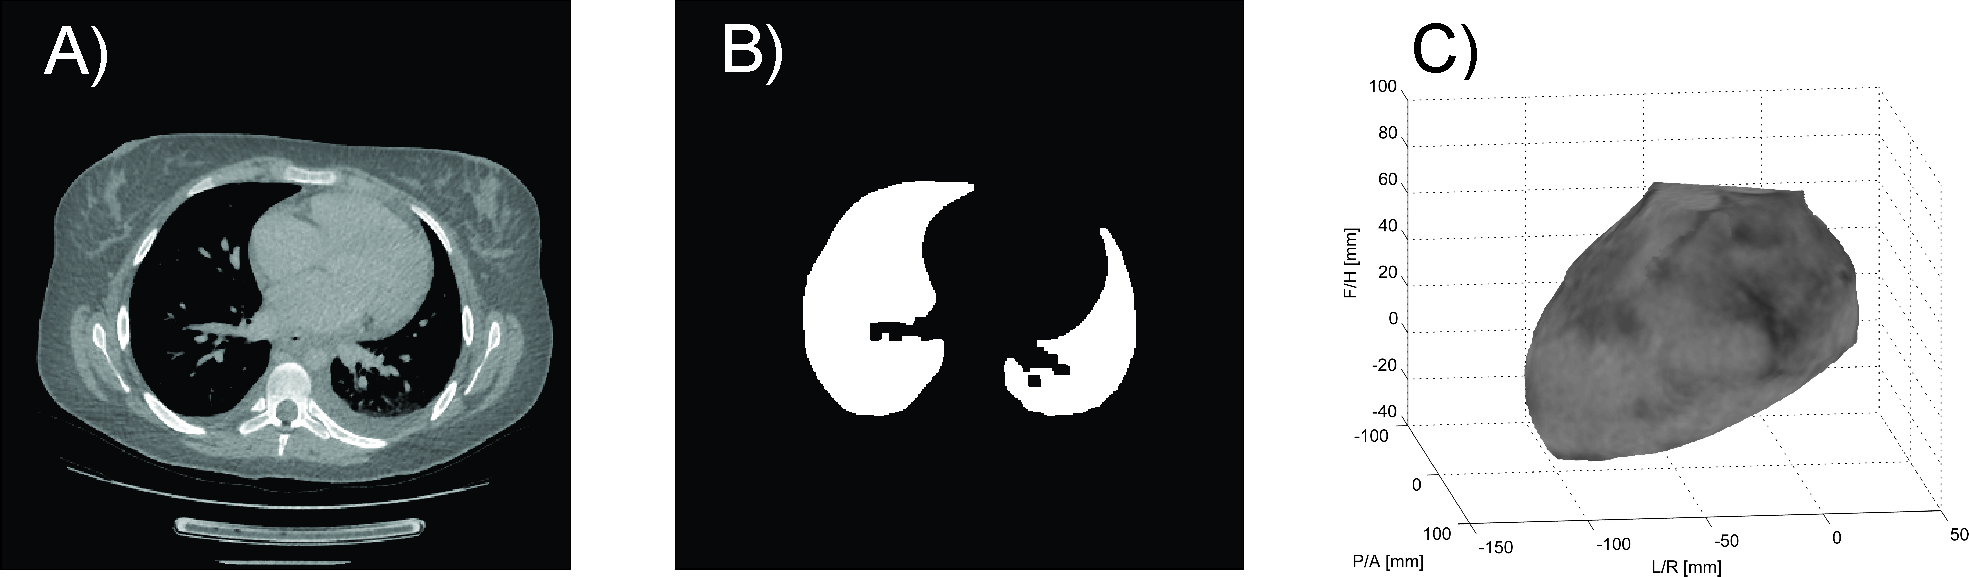
Figure 3. Automated 3D heart segmentation based on standard thoracic CT images. A) Axial slice of the original CT image. B) Segmented lung in the axial orientation. C) Segmented 3D heart as region-of-interest for further analysis (left-front view).