2181
Dual magnetization prepared epicardial fat imaging1Center for Biomedical Imaging Research, Dept. Biomedical Engineering, School of Medicine, Tsinghua University, Beijing, China
Synopsis
Epicardial fat has been more recognized as an endocrine organ and potentially associated with cardiovascular disease and metabolic disorders. High spatial imaging resolution is crucial to identify and quantify epicardial fat. This work proposed an efficient dual magnetization prepared imaging method. Combined with saturation and inversion preparation pulses, desired contrast between fat and surrounding tissues with high spatial resolution in a single breath hold was generated. Both simulation and in vivo experiment were conducted to validate the sequence. In vivo imaging resolution 1.0 by 1.0 by 5 mm3 was achieved, which enabled clearly delineation of epicardial fat successfully.
INTRODUCTION
Epicardial fat, which refers to the mediastinal fat around the heart and covered by the pericardium (Figure 1)1, has been more recognized as an endocrine organ and potentially associated with cardiovascular risk and disease as well as metabolic disorders. The assessment of epicardial fat has gained increased attention in recent years.2,3
However, the assessment of epicardial fat with cardiac MRI is challenging. Many methods including T1-weighted black blood, chemical shift, CINE and multi-echo methods have been tried. Limitations were described such as sensitive to cardiac motion, subjective to field inhomogeneities, multiple-volume acquisition with post processing or confound from bright pericardial fluid. 4-7 The border between the epicardial fat and the myocardium is subject to partial volume effects, which intrinsically requests superior spatial resolution to identify the thin layer of pericardium and good contrast among fat and surrounding tissues.8
This study aims to develop an efficient sequence which is dedicated designed to assess epicardial fat.
METHODS
Pulse Sequence:
As shown in Figure 2, an ECG gated multi-shot spoiled gradient echo (SPGR) was used to acquire data at mid-diastole in a breath hold. Both saturation (SAT) and inversion recovery (IR) pre-pulses were used. IR was applied at the end of systole to achieve full inversion. SAT was used to suppress the magnetization recovery of the long T1 spices, reset signal to obtain the same signal baseline among multi-shots, and further remove the heart rate dependency. The durations among SAT, IR and imaging were kept the same (TD) to suppress myocardium, pericardium and pericardial fluid signal sufficiently in order to achieve desired contrast among tissues.
Simulation:
Available magnetization for imaging was simulated with different TD by varying the heart rate. The end systole and mid diastole was defined according to empirical relationships.9 Contrast ratio (CNR) was calculated as the ratio of available magnetization of tissues with simulated T1 and T2 values at 3T, i.e. 300 and 80 ms for fat, 1500 and 40 ms for myocardium, 2000 and 200 ms for blood, respectively.
In vivo Experiment:
Healthy volunteers (N=12) were imaged with both bSSFP CINE and proposed sequences (Achieva TX 3T, Philips). Representative imaging resolutions for CINE and the proposed sequence were 1.8 by 1.8 by 10 mm3 and 1.0 by 1.0 by 5 mm3, respectively. High resolution CINE (1.0 by 1.25 by 10 mm3) was acquired for anatomy confirmation in subjects with good breath hold compliance. CNR was measured as the ratio of the mean values of signal intensity in ROIs of epicardial fat, myocardium and the multiple samples of pericardium.
RESULTS
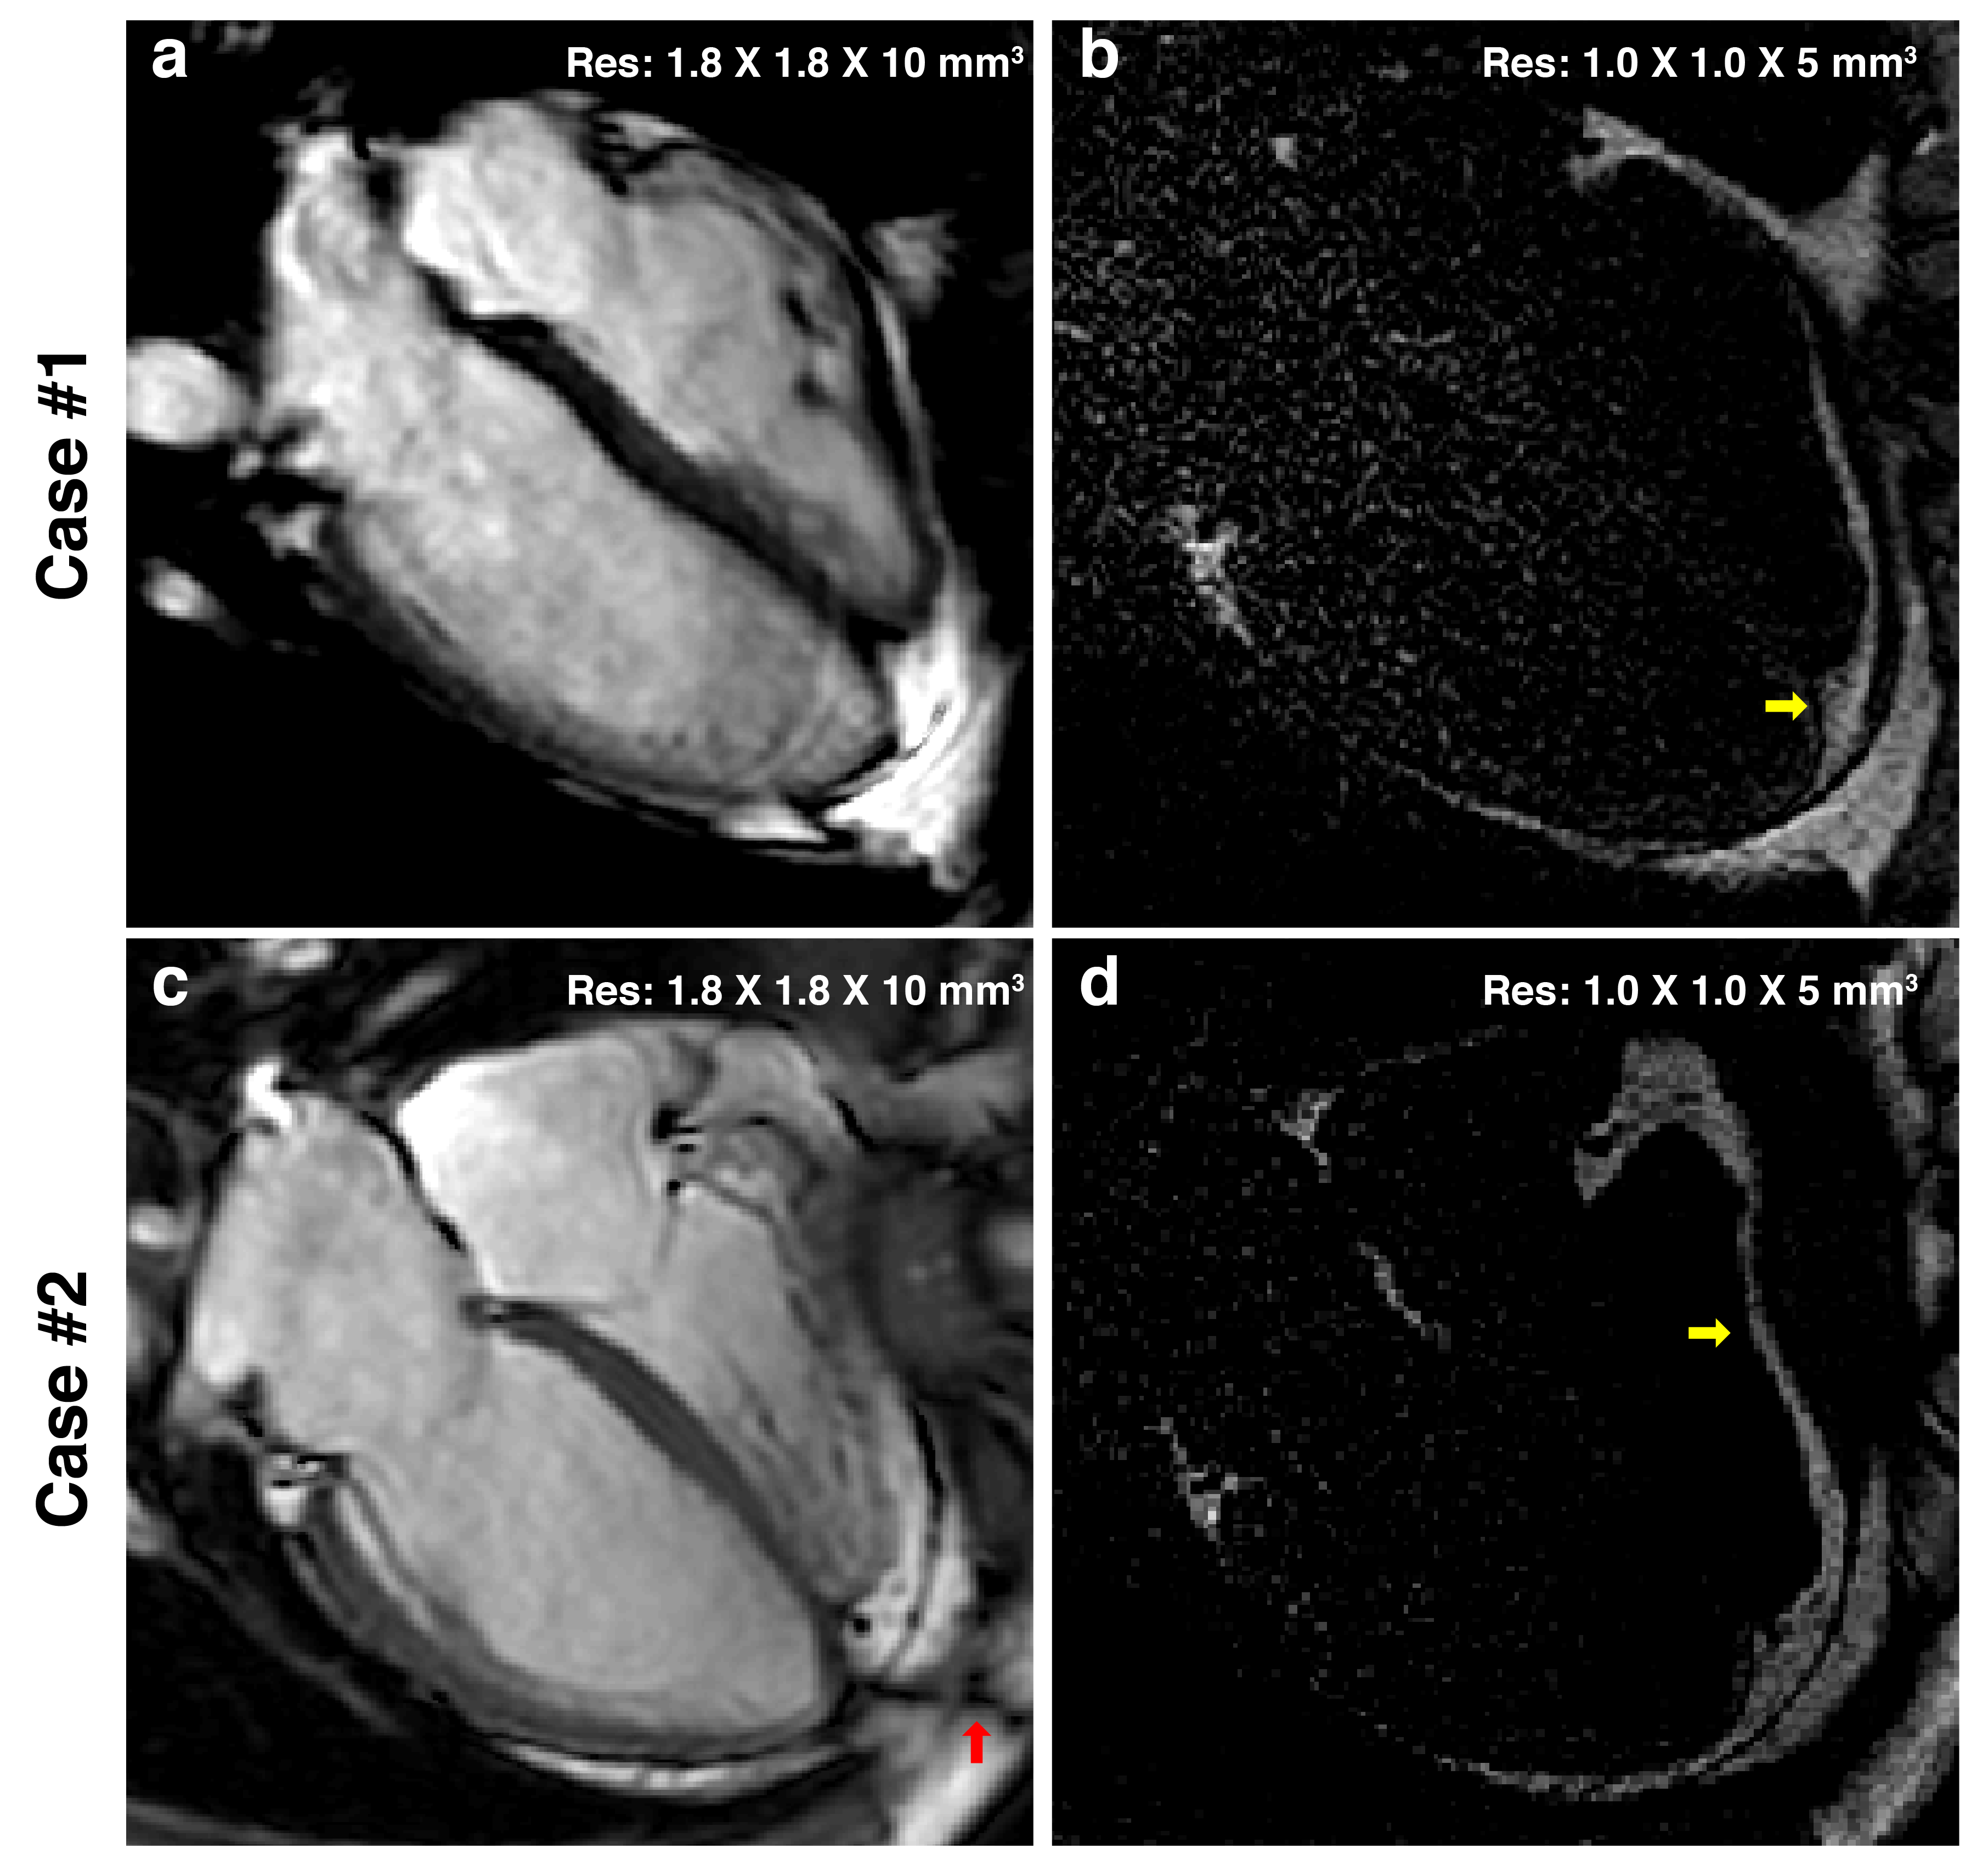
Available magnetization of both myocardium and blood were suppressed sufficiently through the simulated heart rate ranging from 50 to 110 bpm (Figure 3b). Desired CNR among the simulated fat and the adjacent tissues can be achieved (Figure 3c). The pericardium was clearly identified in in-vivo and enabled successful epicardial fat detection, which was confirmed by CINE. Figure 4 showed the representative images where CNRs were 4.8 for epicardial fat-myocardium and 3.3 for epicardial fat-pericardium, respectively. Figure 5 showed another two cases where CINE with routine resolution failed to stratify the epicardial fat at the apical area in Case #1 and fell ambiguity at the free wall of right ventricle in Case #2. As comparison, the proposed sequence depicted the epicardial fat clearly.DISCUSSION
High spatial imaging resolution is crucial for epicardial fat identification and quantification. The proposed method achieved typical resolution 1.0 by 1.0 by 5 mm3 which enabled better depiction of epicardial fat. The proposed sequence presented robust performance for the epicardial fat without confounds normally observed from CINE. With further delineation on the pericardium, the quantitation of the epicardial fat via threshold is potentially feasible. Though the fat signal was positive, the overall signal-to-noise ratio (SNR) was relatively low and made it difficult to push the spatial resolution forward. The proposed sequence scheme can be extended into 3D free breathing acquisition with respiratory navigation, which may result in better SNR and whole heart epicardial fat quantification.CONCLUSION
The proposed sequence is promising to be used to quantify epicardial fat. Further validation is needed.Acknowledgements
This work was funded by National Key R&D Program of China 2016YFC0104700.References
- Russo R, Di Iorio B, Di Lullo L, Russo D, Epicardial adipose tissue: new parameter for cardiovascular risk assessment in high risk populations, J Nephrol. 2018 (Epub ahead of print).
- Douglass E, Greif S, Frishman WH, Epicardial fat pathophysiology and clinical significance, Cardiol Rev. 2017;25(5):230-235.
- Ng ACT, Strudwick M, van der Geest RJ, et al., Impact of Epicardial Adipose Tissue, Left Ventricular Myocardial Fat Content, and Interstitial Fibrosis on Myocardial Contractile Function, Circ Cardiovasc Imaging. 2018;11(8):e007372.
- Wong CX, Abed HS, Molaee P, et al., Pericardial fat is associated with atrial fibrillation severity and ablation outcome, J Am Coll Cardiol. 2011;57(17):1745-51.
- Nakamori S, Nezafat M, Ngo LH, et al., Left atrial epicardial fat volume is associated with atrial fibrillation: A prospective cardiovascular magnetic resonance 3D Dixon study, J Am Heart Assoc. 2018;7:e008232.
- Homsi R, Meier-Schroers M, Gieseke J, et al., 3D-Dixon MRI based volumetry of peri- and epicardial fat, Int J Cardiovasc Imaging. 2016;32(2):291–299.
- Burke AP, Farb A, Tashko G, Virmani R, Arrhythmogenic right ventricular cardiomyopathy and fatty replacement of the right ventricular myocardium: are they different diseases? Circulation. 1998;97(16):1571-80.
- Kellman P, Hernando D, Arai AE, Myocardial Fat Imaging, Curr Cardiovasc Imaging Rep. 2010; 3(2):83-91.
- Ashman R, Hull E. The normal human electrocardiogram and changes produced by disease. The T wave, the Q-T interval, and the U wave. In: Essentials of electrocardiography: for the student and practitioner of medicine, 2nd edition. New York: Macmillan; 1945. p162–163.
Figures