2180
Diagnostic value of native T1/T2 map in patients with cardiac involvement in idiopathic inflammatory myopathy1Radiology, Tongji Hospital, Tongji Medical College, Huazhong University of Science and Technology, Wuhan, China, 2Radiology, Leiden University Medical Center, Leiden, Netherlands
Synopsis
Idiopathic inflammatory myopathy (IIM) is a chronic autoimmune systemic disease that involves myocardium. The aim of this study is to evaluate the diagnostic value of histogram analysis of native T1 and T2 maps to identify patients with cardiac involvement in IIM. Fifteen patients with cardiac involvement in IIM and 11 normal controls were enrolled in this study. Native T1 and T2 maps were assessed by histogram analysis. Compared to the controls, the native T1 mean, median, SD and entropy were elevated significantly in IIM patients, while T2 histogram parameters showed no significant difference. A bi-parametric model including native T1 median and SD demonstrated the highest accuracy (AUC=0.93) for detecting cardiac involvement in IIM.
INTRODUCTION
Idiopathic inflammatory myopathy (IIM) is a group of autoimmune diseases that may involve myocardium. Heart failure is the major cause of IIM mortality, but cardiac involvement in IIM is often subclinical1. Early detection of cardiac abnormalities in IIM is essential for early prevention of heart failure. Electrocardiography and echocardiography have low sensitivity and specificity to detect the abnormal cardiac change in IIM2. Native T1 and T2 maps of cardiac magnetic resonance (CMR) are promising techniques to evaluate tissue characteristics quantitatively3, and histogram analysis of native T1 and T2 images can provide relevant information, such as mean, standard deviation (SD), entropy, to assess tissue composition and heterogeneity4. The purpose of this study is to evaluate the diagnostic accuracy of histogram analysis of native T1 and T2 maps to identify patients with cardiac involvement in IIM.METHODS
IIM patients diagnosed by skeletal muscle biopsy and skeletal muscle enzyme level were consecutively enrolled from 2017 to 2018. Patients with elevated ultrasensitive cardiac troponin I were considered as cardiac involvement in IIM3, while patients with known cardiac diseases were excluded. Fifteen patients (5 male, age 43±13 years) with cardiac involvement in IIM (duration of IIM 11±15 months) were recruited and 11 sex and age matched subjects without cardiovascular and systemic diseases were enrolled as the control group. All the subjects underwent CMR on a 3T scanner (Magnetom Skyra, Siemens Healthcare, Erlangen, Germany). The CMR protocol included short-axis steady-state free precession (SSFP) cine imaging, modified Look-locker inversion recovery (MOLLI) T1 maps and 3-point SSFP T2 maps with multi-slice covering left ventricle. Biventricular function and histogram analysis of native T1 and T2 maps were evaluated by the MASS research software (Leiden University Medical Center, Leiden, the Netherlands). The mean, median, SD, minimum, maximum, and entropy of multi-slice native T1 and T2 maps were calculated automatically after tracing the endocardial and epicardial contours. Two independent sample t-test was used to compute the difference of functional and histogram parameters between IIM patients and the controls. Receiver operating characteristic (ROC) curve was used to calculate the power of native T1 and T2 histogram parameters to detect cardiac involvement in IIM.RESULTS
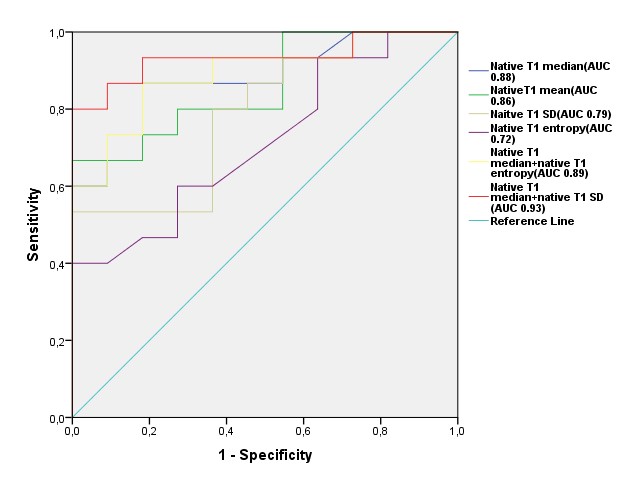
All biventricular functional parameters were not significantly different between IIM patients and controls (P>0.05 for all). Compared to the controls, the mean, median, SD and entropy of native T1 were elevated in IIM patients (P<0.05 for all, Figure1), while the maximum and minimum of native T1 were not significantly different (P=0.155 and P=0.455, respectively). All histogram parameters of T2 of IIM patients did not differ from the control group (P > 0.05 for all,Table 1). The ROC analysis results of native T1 mean, median, SD and entropy to detect cardiac involvement in IIM are shown in Figure 2. The native T1 median was found to be the most sensitive and specific index of all native T1 histogram parameters (AUC=0.88, P=0.001, sensitivity=86.7%, specificity=81.8%, and accuracy=84.6%). The bi-parametric model5 containing both native T1 median and SD had the highest diagnostic performance (AUC=0.93, P<0.001, sensitivity=87.5%, specificity=90.0%, and accuracy=88.5%, Figure 2).DISCUSSION
IIM is a heterogeneous group of chronic autoimmune diseases, and 9%-72% of patients with IIM present with myocardial inflammation and myocardial fibrosis6. Biventricular ejection fraction was preserved in patients with cardiac involvement in IIM in this study, and LVEF is not sensitive to early cardiac involvement in IIM. Previous studies demonstrated that elevated native T1 is observed in cardiac involvement in IIM7,8, in accordance with the results of this study.
Histogram analysis characterizes the distribution of T1/T2 values, providing comprehensive information4. As the T1 distribution within the myocardium in IIM may not follow normality, the median better represents the distribution than the mean. Additionally, the bi-parameter model, which further included SD as a heterogeneity marker9, exhibited higher diagnostic performance compared to a single parameter.
Furthermore, we found that although histogram parameters of T2 maps did not show significant differences between the IIM and the control group, the mean, median, SD and entropy tended to be elevated in IIM. Besides the relatively small number of the subjects that lacks statistical power to detect subtle differences, we further hypothesize that myocardial edema may not the predominant pathological feature in myocardial involvement, and that its duration may also affect T2 change. Further research is warranted to validate our hypothesis.
CONCLUSION
Native T1 histogram parameters are associated with cardiac involvement in IIM patients, while histogram parameters of T2 demonstrated little additional diagnostic value. Native T1 median is the most sensitive and specific marker of all native T1 histogram parameters to discriminate cardiac involvement in IIM from controls, and a bi-parametric model including native T1 median and SD further improves the diagnostic accuracy.Acknowledgements
No acknowledgement found.References
1. Gupta R, Wayangankar SA, Targoff IN, et al. Clinical cardiac involvement in idiopathic inflammatory myopathies: A systematic review. Int J Cardiol. 2011;148(3):261-270.
2. Diederichsen LP, Simonsen JA, Diederichsen ACP, et al. Cardiac abnormalities assessed by non-invasive techniques in patients with newly diagnosed idiopathic inflammatory myopathies. Clin Exp Rheumatol. 2015;33(5):706-714.
3. Huber AT, Bravetti M, Lamy J, et al. Non-invasive differentiation of idiopathic inflammatory myopathy with cardiac involvement from acute viral myocarditis using cardiovascular magnetic resonance imaging T1 and T2 mapping. J Cardiovasc Magn Reson. 2018;20(1):11.
4. Wu CW, Wu R, Shi RY, et al. Histogram Analysis of Native T1Mapping and Its Relationship to Left Ventricular Late Gadolinium Enhancement, Hypertrophy, and Segmental Myocardial Mechanics in Patients With Hypertrophic Cardiomyopathy. J Magn Reson Imaging. August 2018. doi:10.1002/jmri.26272. [Epub ahead of print]
5. Baessler B, Luecke C, Lurz J, et al. Cardiac MRI Texture Analysis of T1 and T2 Maps in Patients with Infarctlike Acute Myocarditis. Radiology. 2018;289(2):357-365.
6. Danieli MG, Gelardi C, Guerra F, et al. Cardiac involvement in polymyositis and dermatomyositis. Autoimmun Rev. 2016;15(5):462-465.
7. Rosenbohm A, Buckert D, Gerischer N, et al. Early diagnosis of cardiac involvement in idiopathic inflammatory myopathy by cardiac magnetic resonance tomography. J Neurol. 2015;262(4):949-956.
8. Yu L, Sun J, Sun J, et al. Early detection of myocardial involvement by T 1 mapping of cardiac MRI in idiopathic inflammatory myopathy. J Magn Reson Imaging. 2018;48(2):415-422.
9. Baeßler B, Treutlein M, Schaarschmidt F, et al. A novel multiparametric imaging approach to acute myocarditis using T2-mapping and CMR feature tracking. J Cardiovasc Magn Reson. 2017;19:71.
Figures