2179
Parametric measurements of acute myocardial infarction in a large preclinical model1MR Research Centre, Department of Clinical Medicine, Aarhus University, Aarhus, Denmark, 8200 Aarhus N, Denmark, 22Department of Cardiology, Aarhus University Hospital Skejby, Aarhus N, Denmark, Aarhus N, Denmark, 3The Department of Cardiothoracic and Vascular Surgery, Aarhus University Hospital, Denmark, Aarhus N, Denmark, 4GE Healthcare, Munich, Germany, Munich, Germany
Synopsis
Hyperpolarized [1-13C]pyruvate was used to evaluate metabolic and perfusion changes in myocardial infarction in the critical acute reperfusion phase. Regional changes was observed by mapping of metabolic ratios of lactate, alanine and bicarbonate. Metabolic exchange rates from hyperpolarized fumarate was calculated using Michael-Menten kinetics. Hyperpolarized measures were compared with standard perfusion MRI and tissue staining evaluating infarction and salvage. The results of this study, draws use of hyperpolarized [1-13C]pyruvate closer to evaluation of myocardial infarction in a human study.
Purpose
Despite advances in diagnostics and treatment, acute myocardial infarction (MI) remains the leading cause of death in Europe [1]. MI diagnostics have benefitted from cardiac MR contrast imaging by the value of late gadolinium enhancement (LGE). Cardiac MR imaging is currently moving towards more parametric imaging methods, such as MR parameter mapping and perfusion measurements [2]. Hyperpolarized 13C imaging has high potential value in measuring real-time cardiac metabolism, and has recently progressed from the preclinical setting to its first human application [3]. Hyperpolarized agents can measure both metabolism and perfusion in the same acquisition. We explore the capabilities of [1-13C] pyruvate as a multi-parametric agent for measuring metabolic and perfusion alterations caused by MI in a large animal model 3 hours post reperfusion.Methods
Three 40 kg fed domestic pigs underwent LAD coronary occlusion following a prior baseline scan, which measured left ventricular function (LVF). After 1 hour of occlusion, the angioplasty balloon was deflated and the LAD reopened for reperfusion. Three hours later, hyperpolarized [1-13C]pyruvate imaging, LVF, gadolinium perfusion and late enhancement images were acquired. Lastly, the heart was excised and stained to measure areas of myocardial infarction and salvage. Pigs were imaged on a 3T clinical MRI scanner (MR750, GE Healthcare) using a customized 1H 8ch flexible coil (GE/Rapid Biomedical) retrofitted with 13C traps in combination with a PulseTeq 13C Helmholtz loop-pair. All scans were ECG-triggered and performed during breath-hold. Apart from LVF, images were acquired in the diastolic phase. LVF images: 2D SSFP with an in-plane resolution 0.7 x 0.7 mm2, 8 mm slices. Hyperpolarized [1-13C]pyruvate images: 2D spectral-spatial excitation (80 Hz bandwidth) with spiral read-out in a saturation recovery approach [4], FA=8° for pyruvate and 90 for metabolites, in-plane resolution 8 x 8 mm2, 20 mm slice, one slice in infarcted myocardium - linked geometry to LVF/First pass/LGE images. First pass perfusion images: 2D SSFP inversion recovery, inversion time 82 ms, fat saturated, in-plane resolution 0.7 x 0.7 mm2, 8 mm slices. LGE images: 2D SSFP inversion recovery, Look-Locker estimated inversion time on average 420 ms, fat saturated, in-plane resolution 0.7 x 0.7 mm2, 8 mm slices. Metabolic-exchange rate images from hyperpolarized [1-13C]pyruvate was calculated in an in-house MATLAB script using Michaelis–Menten kinetics.Results
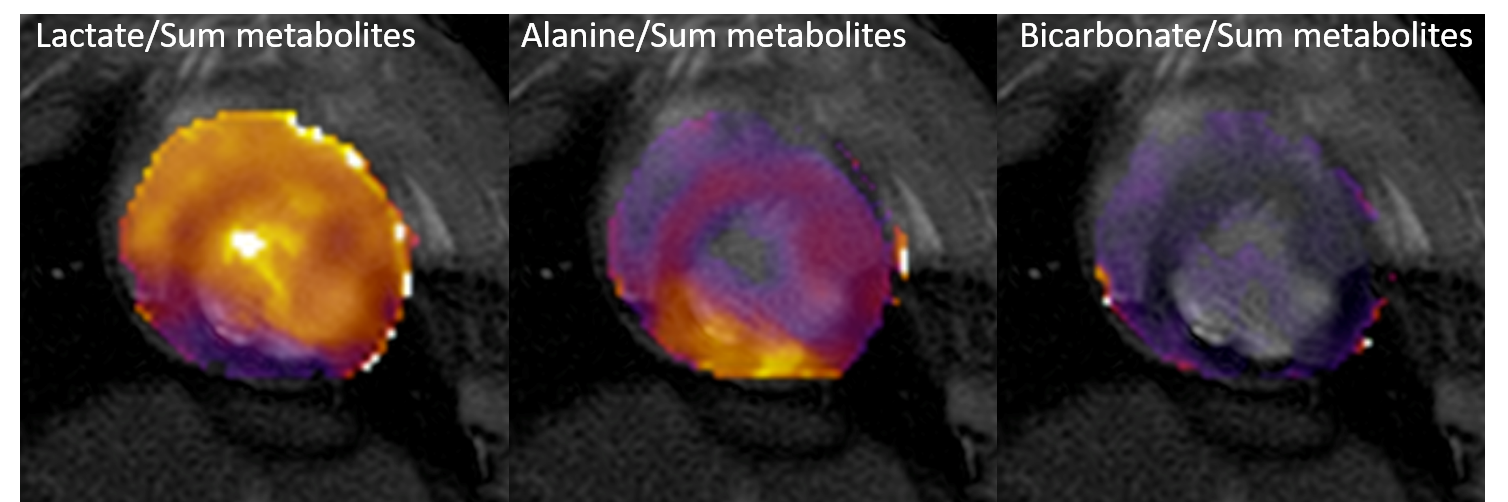
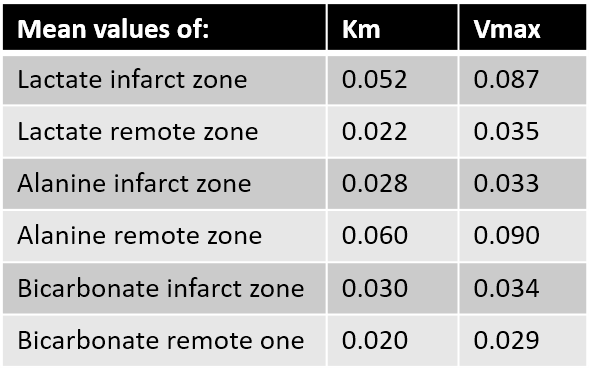
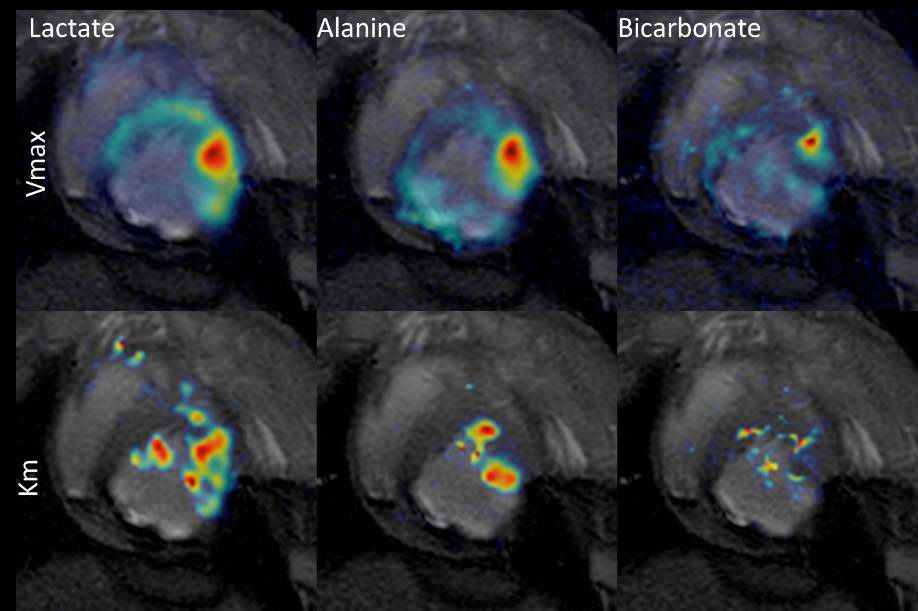
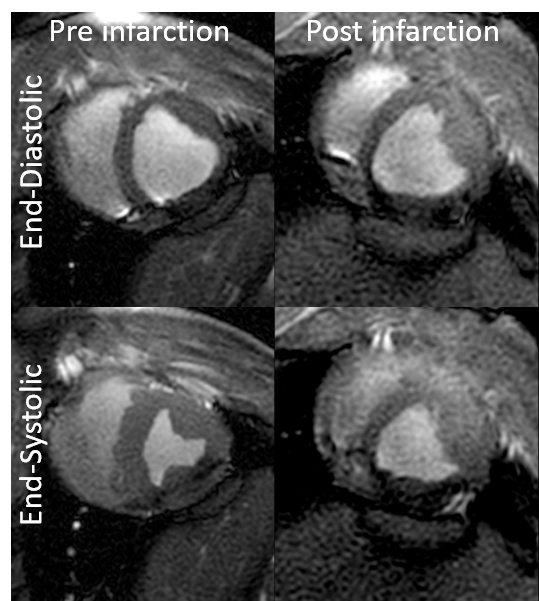
Regional changes in the myocardium caused by ischemia and reperfusion were observed both in LVF, perfusion changes, LGE and metabolic exchange rates. Figure 1 displays an example of the summed metabolic ratios depicting high lactate in the infarcted area, low bicarbonate conversion overall and high alanine conversion in the remote myocardium. Figure 2 shows a table with the mean values of Michaelis-Menten values from infarcted, salvage and remote area of the myocardium. Figure 3 presents an example of the calculated Vmax and Km maps. Figure 4 shows an example of the deterioration in left ventricular function as evaluated by CINE: Ejection fraction decreased from 50% pre MI to 18% post MI.Discussion
MI in a large animal model is quantifiable by Michaelis–Menten kinetics, whichs correlate with standard MR measurements in MI. While Michealis-Menten approximates saturation effects and does not represent a physiological modulation, it allows for utilization of multiple exchange rate maps measured with saturation-recovery. Furthermore, regional changes in the myocardium could be assessed in the present study, providing interesting findings in the early stage of reperfusion injury.Conclusion
Quantifiable measurements of metabolic exchange rates are key to improve the capability of hyperpolarized [1-13C]pyruvate to be used in the clinical setting. This study presents the first utilization of Michaelis–Menten kinetics in MI in a large animal model.Acknowledgements
No acknowledgement found.References
1. Eurostat. Eurostat yearbook. 2016
2. Messroghli DR, Moon JC, Ferreira VM, et al. Clinical recommendations for cardiovascular magnetic resonance mapping of T1, T2, T2* and extracellular volume: A consensus statement … Journal of Cardiovascular Magnetic Resonance 2017;19(1):75.
3. Cunningham CH, Lau JYC, Chen AP, et al. Hyperpolarized (13)C Metabolic MRI of the Human Heart: Initial Experience. Circ Res 2016;119(11):1177-1182.
Figures