2177
Ex Vivo Cardiovascular Model Design and Construction: Preliminary Results1Mechanical Engineering, University of Wisconsin, Madison, WI, United States, 2Biomedical Engineering, University of Wisconsin, Madison, WI, United States, 3Department of Surgery, University of Wisconsin, Madsion, WI, United States, 4Radiology, University of Wisconsin, Madison, WI, United States
Synopsis
Cardiovascular fluid dynamics (CFD) has clinical application and is often studied in vitro, in vivo or using computational simulation. However, inherent assumptions and limitations of these methods limit their clinical translation. Ex vivo modeling, coupled with 4D Flow MRI, can provide physiological time-resolved velocity data, while overcoming limitations of other experimental methods. An ex vivo MRI model of a porcine aorta was designed and assessed for its use in cardiovascular modeling and pulse wave velocity (PWV) measurement validation. Physiologically reasonable flow, produced at the specimen inlet, and preliminary PWV data show potential for future CFD and validation studies.
Introduction
Cardiovascular fluid dynamics (CFD) is crucial for understanding disease, physiology and surgical alterations. Quantitative hemodynamic indices such as wall shear stress, kinetic energy and turbulence have been studied for their relationship with thromboembolic events, prosthetic implants, aneurysms, and other clinically relevant pathologies1–3. Despite evidence that CFD provides valuable information, most studies are performed in vitro or with computational simulation4–6. Although useful, both modeling methods have inherent assumptions about mechanical properties of vascular tissue, blood rheology, peripheral resistance and compliance. In vivo studies have fewer simplifying assumptions, but are limited by their invasive nature, patient availability, cost and data acquisition techniques. Ex vivo cardiovascular modeling substantially reduces the number of assumptions of in vitro modeling and computational simulation, and overcomes many in vivo limitations. Coupling ex vivo modeling with 4D Flow MRI imaging would allow quantification of time-resolved velocity in physiologically realistic models. Applications of such models include, but are not limited to, validation of imaging techniques, tissue biomechanics characterization and surgical planning7. The present study explains the design of an ex vivo cardiovascular MRI model. In addition, the model is assessed as a validation tool for 4D Flow MRI measurement of pulse wave velocity (PWV).Methods
Ex Vivo Model Design
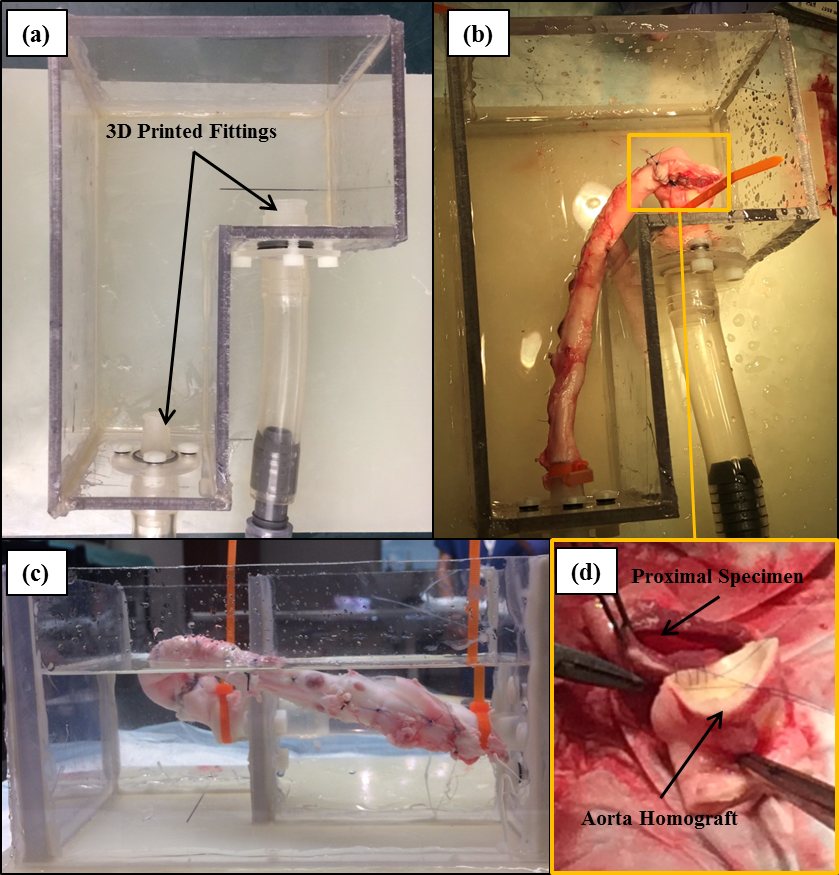
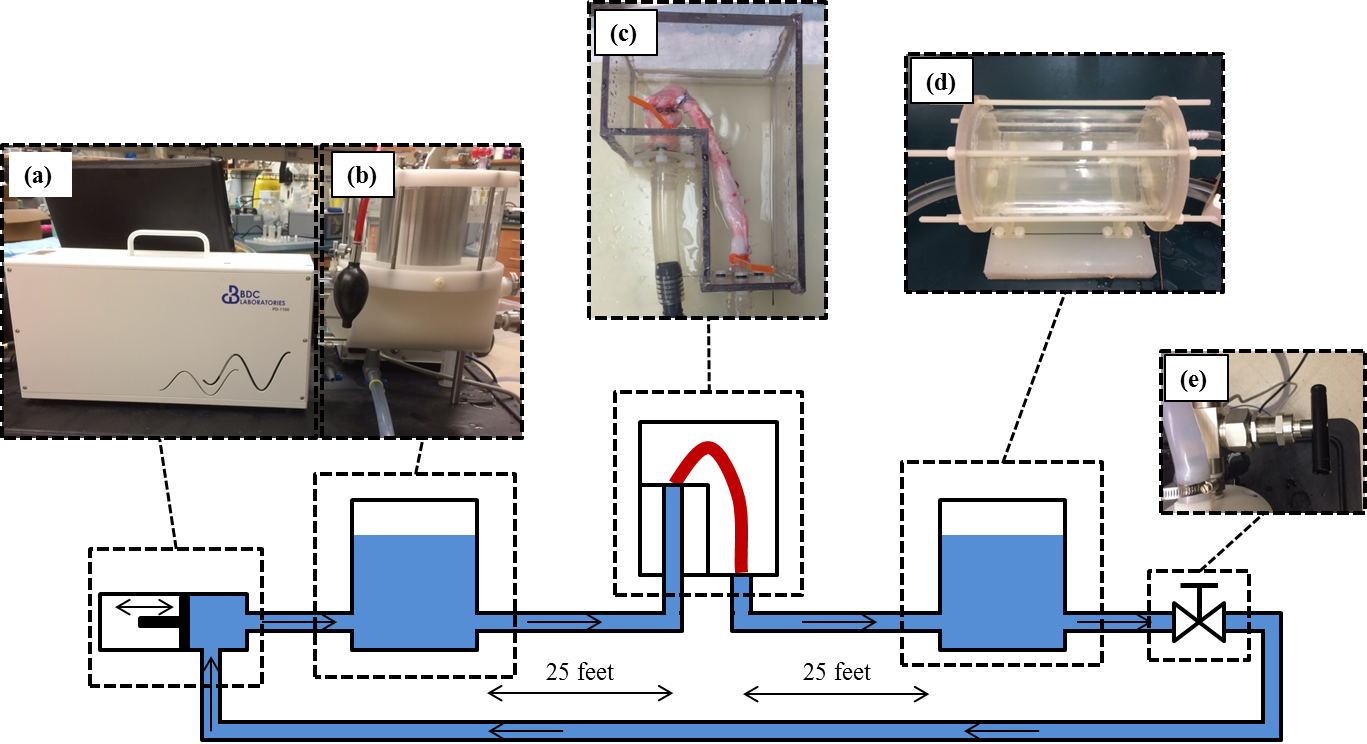
A 5-inch-deep, water-tight container was constructed from ¼ inch acrylic sheet. The container was designed to connect porcine vessels to a pulsatile flow system while submerging them in a preservation solution. The pulsatile flow system (figure 2) consisted of a positive displacement pump (PD-1100, BDC Labs, CO), a proximal compliance chamber to represent arterial stiffness, a distal compliance chamber to represent vascular stiffness, and a peripheral resistance valve to control afterload. Each system component was adjustable for pressure and flow conditioning. An ex vivo specimen was prepared from harvested porcine aorta, allowing for attachment in the ex vivo model flow loop. 25 feet (adequate distance between MRI scanner and control room) of ¾ inch PVC tubing were connected between system components and proximal and distal specimen attachments. Flow was measured at the specimen inlet.
In Vivo and Ex Vivo PWV
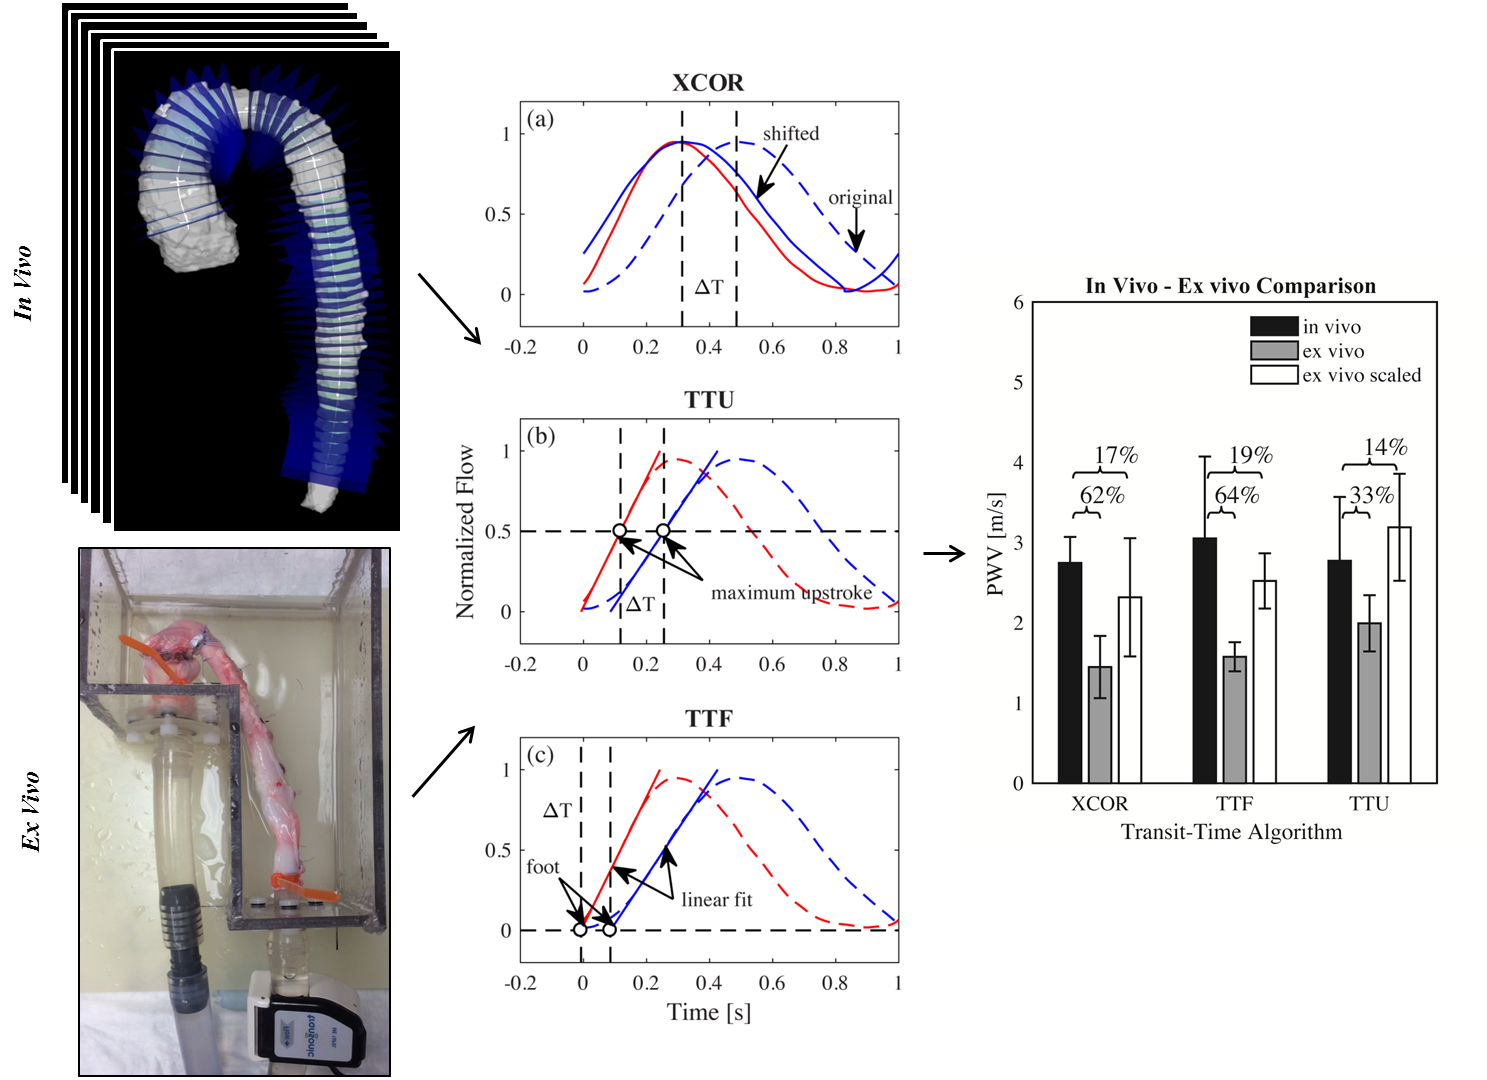
Live pigs (n=6) were scanned at 12 weeks of age for quantification of nominal in vivo PWV measurement on a Clinical 3.0T MRI scanner (MR750, GE Healthcare). Time resolved velocity data was acquired using a 4D Flow MRI sequence called PC-VIPR (Phase Contrast Vastly Under sampled Projection Imaging)8. Data was reconstructed to 20 time frames and flow was quantified in Ensight (CEI, Apex, NC) at planes 5 mm apart, along the aorta. PWV was quantified using cross correlation (XCOR), time-to-foot (TTF) and time-to-maximum-upstroke (TTU) transit time (TT) algorithms, which calculate PWV as the inverse slope of a line fitted to distance vs. TT data (figure 4). PWV was also measured in the aortic specimen using a benchtop experimental procedure, which utilizes transit time ultrasonic flow probes9. In vivo and ex vivo PWV were compared.
Results
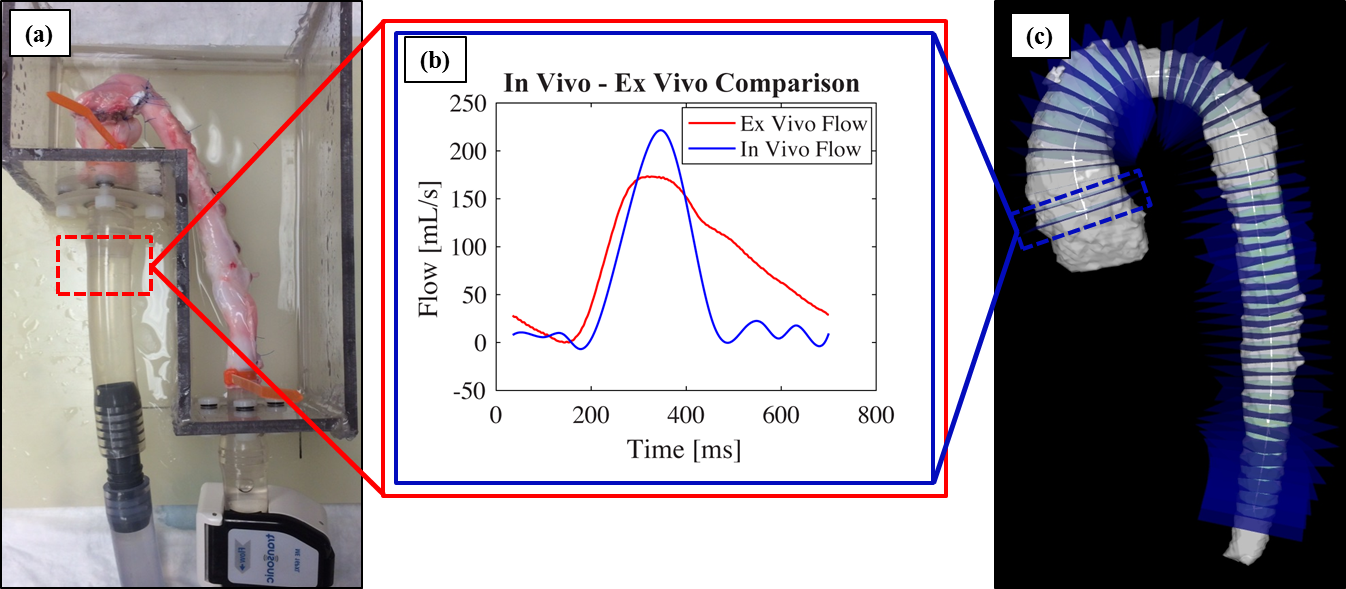
The constructed ex vivo model is shown in figure 1. Physiological flow was successfully created at the specimen inlet, 25 feet from the pump outlet (figure 3). Ex vivo upstroke region and flow amplitude resemble in vivo flow, while diastolic flow is different. Nominal values for PWV measured in vivo from living pigs was 2.75 ± 0.32 m/s for XCOR, 3.05 ± 1.02 m/s for TTF, and 2.77 ± 0.80 m/s for TTU. PWV measured using the Benchtop experiment was 1.45 ± 0.39 m/s for XCOR, 1.58 ± 0.18 m/s for TTF, and 1.99 ± 0.35 m/s for TTU. There is a 62% difference for XCOR PWV, a 64% difference for TTF PWV, and a 31% difference for TTU PWV (figure 4).Discussion
Physiologic waveforms created 25 feet from the pump outlet show the ex vivo model can be used to analyze CFD with MRI. The flow waveform at the specimen inlet shows a physiologic upstroke region and flow amplitude, compared with in vivo waveforms. Refining flow system elements will increase model accuracy and allow for future ex vivo studies. Preliminary PWV validation data shows high percentage differences between in vivo and ex vivo PWV. However, applying a scaling factor for error substantially reduces percent differences for all TT methods, showing that error may be systematic. PWV differences may result from mean pressure, surrounding tissue stiffness, waveform shape, intercostal artery leakage, or compliance differences.Conclusion
Preliminary data at the specimen inlet, and PWV validation experiments show that the ex vivo model presented here has utility for knowledge acquisition, surgery planning and validation. Future work will include refining experimental setups for present and future studies.Acknowledgements
No acknowledgement found.References
1. Bluestein, D., Li, Y. M. & Krukenkamp, I. B. Free emboli formation in the wake of bi-leaflet mechanical heart valves and the effects of implantation techniques. J. Biomech. 35, 1533–1540 (2002).
2. Tabe, R., Ghalichi, F., Hossainpour, S. & Ghasemzadeh, K. Laminar-to-turbulence and relaminarization zones detection by simulation of low Reynolds number turbulent blood flow in large stenosed arteries. Biomed. Mater. Eng. 27, 119–129 (2016).
3. Han, Q. J. et al. Altered right ventricular kinetic energy work density and viscous energy dissipation in patients with pulmonary arterial hypertension: A pilot study using 4D flow MRI. PLoS One 10, 1–14 (2015).
4. Roldán-Alzate, A. et al. Hemodynamic study of TCPC using in vivo and in vitro 4D Flow MRI and numerical simulation. J. Biomech. 48, 1325–1330 (2015).
5. Condemi, F. et al. Fluid- and Biomechanical Analysis of Ascending Thoracic Aorta Aneurysm with Concomitant Aortic Insufficiency. Ann. Biomed. Eng. 45, 2921–2932 (2017).
6. Gunning, P. S., Saikrishnan, N., Mcnamara, L. M. & Yoganathan, A. P. An in vitro evaluation of the impact of eccentric deployment on transcatheter aortic valve hemodynamics. Ann. Biomed. Eng. 42, 1195–1206 (2014).
7. de Beaufort, H. W. et al. Four-dimensional flow cardiovascular magnetic resonance in aortic dissection: Assessment in an ex vivo model and preliminary clinical experience. J. Thorac. Cardiovasc. Surg. 77030, (2018).
8. Johnson, K. M. et al. Improved 3D phase contrast MRI with off-resonance corrected dual echo VIPR. Magn. Reson. Med. 60, 1329–1336 (2008).
9. Ruesink, T., Medero, R., Rutkowski, D. & Roldán-Alzate, A. In Vitro Validation of 4D Flow MRI for Local Pulse Wave Velocity Estimation. Cardiovasc. Eng. Technol. (2018).
Figures