2176
Sex Differences in Local and Regional Aortic Stiffness Assessed by 4D Flow MRI1Mechanical Engineering, University of Wisconsin, Madison, WI, United States, 2Medical Physics, University of Wisconsin, Madison, WI, United States, 3Radiology, University of Wisconsin, Madison, WI, United States, 4Biomedical Engineering, University of Wisconsin, Madison, WI, United States
Synopsis
Differences in occurrence of cardiovascular disease between men and women is thought to be attributable to sex differences in arterial stiffness. However, to understand, diagnose and treat CVD, analysis of how and where arterial stiffness affects men and women differently is required. 4D Flow MRI was used to estimate regional and local aortic stiffness in 19 volunteers (age 20-32, 10 men, 9 women). Women had lower regional stiffness, suggesting they experience a reduced afterload on the heart, lowering disease risk. This study provides non-invasive comprehensive stiffness data, previously inaccessible, that may shed light on sex-specific cardiovascular differences.
Introduction
Cardiovascular disease (CVD) is the leading cause of death in developed countries.1 However, pre-menopausal women experience lower incidence of CVD when compared with age-matched men.2 In post-menopause, there is a disproportionate increase of CVD in women compared with age-matched men.3 Thorough understanding of these differences has implications for sex-specific diagnostic criteria, pathophysiology and appropriate treatment. Of particular interest are differences in arterial stiffness and the resultant sex-specific cardiovascular responses between men and women. Compliant large arteries absorb energy and reduce load on peripheral organs and the heart. When those arteries stiffen, cardiac response often leads to heart failure with preserved ejection fraction (HFpEF), which affects twice as many women as it does men.4 Although associations between artery stiffness and ventricular function exist, a more comprehensive mechanistic analysis is needed to fully understand sex-based arterial stiffness differences.5 4D Flow MRI has recently been investigated for its use in measuring arterial stiffness by estimating pulse wave velocity (PWV).6–8 4D Flow MRI’s advantage over other methods quantifying arterial stiffness is its ability to capture both regional and local pulse wave velocity at specific locations. The purpose of this study was to advance the understanding of sex-based CVD differences by quantifying regional and local aortic stiffness differences between young men and women using 4D Flow MRI.Methods
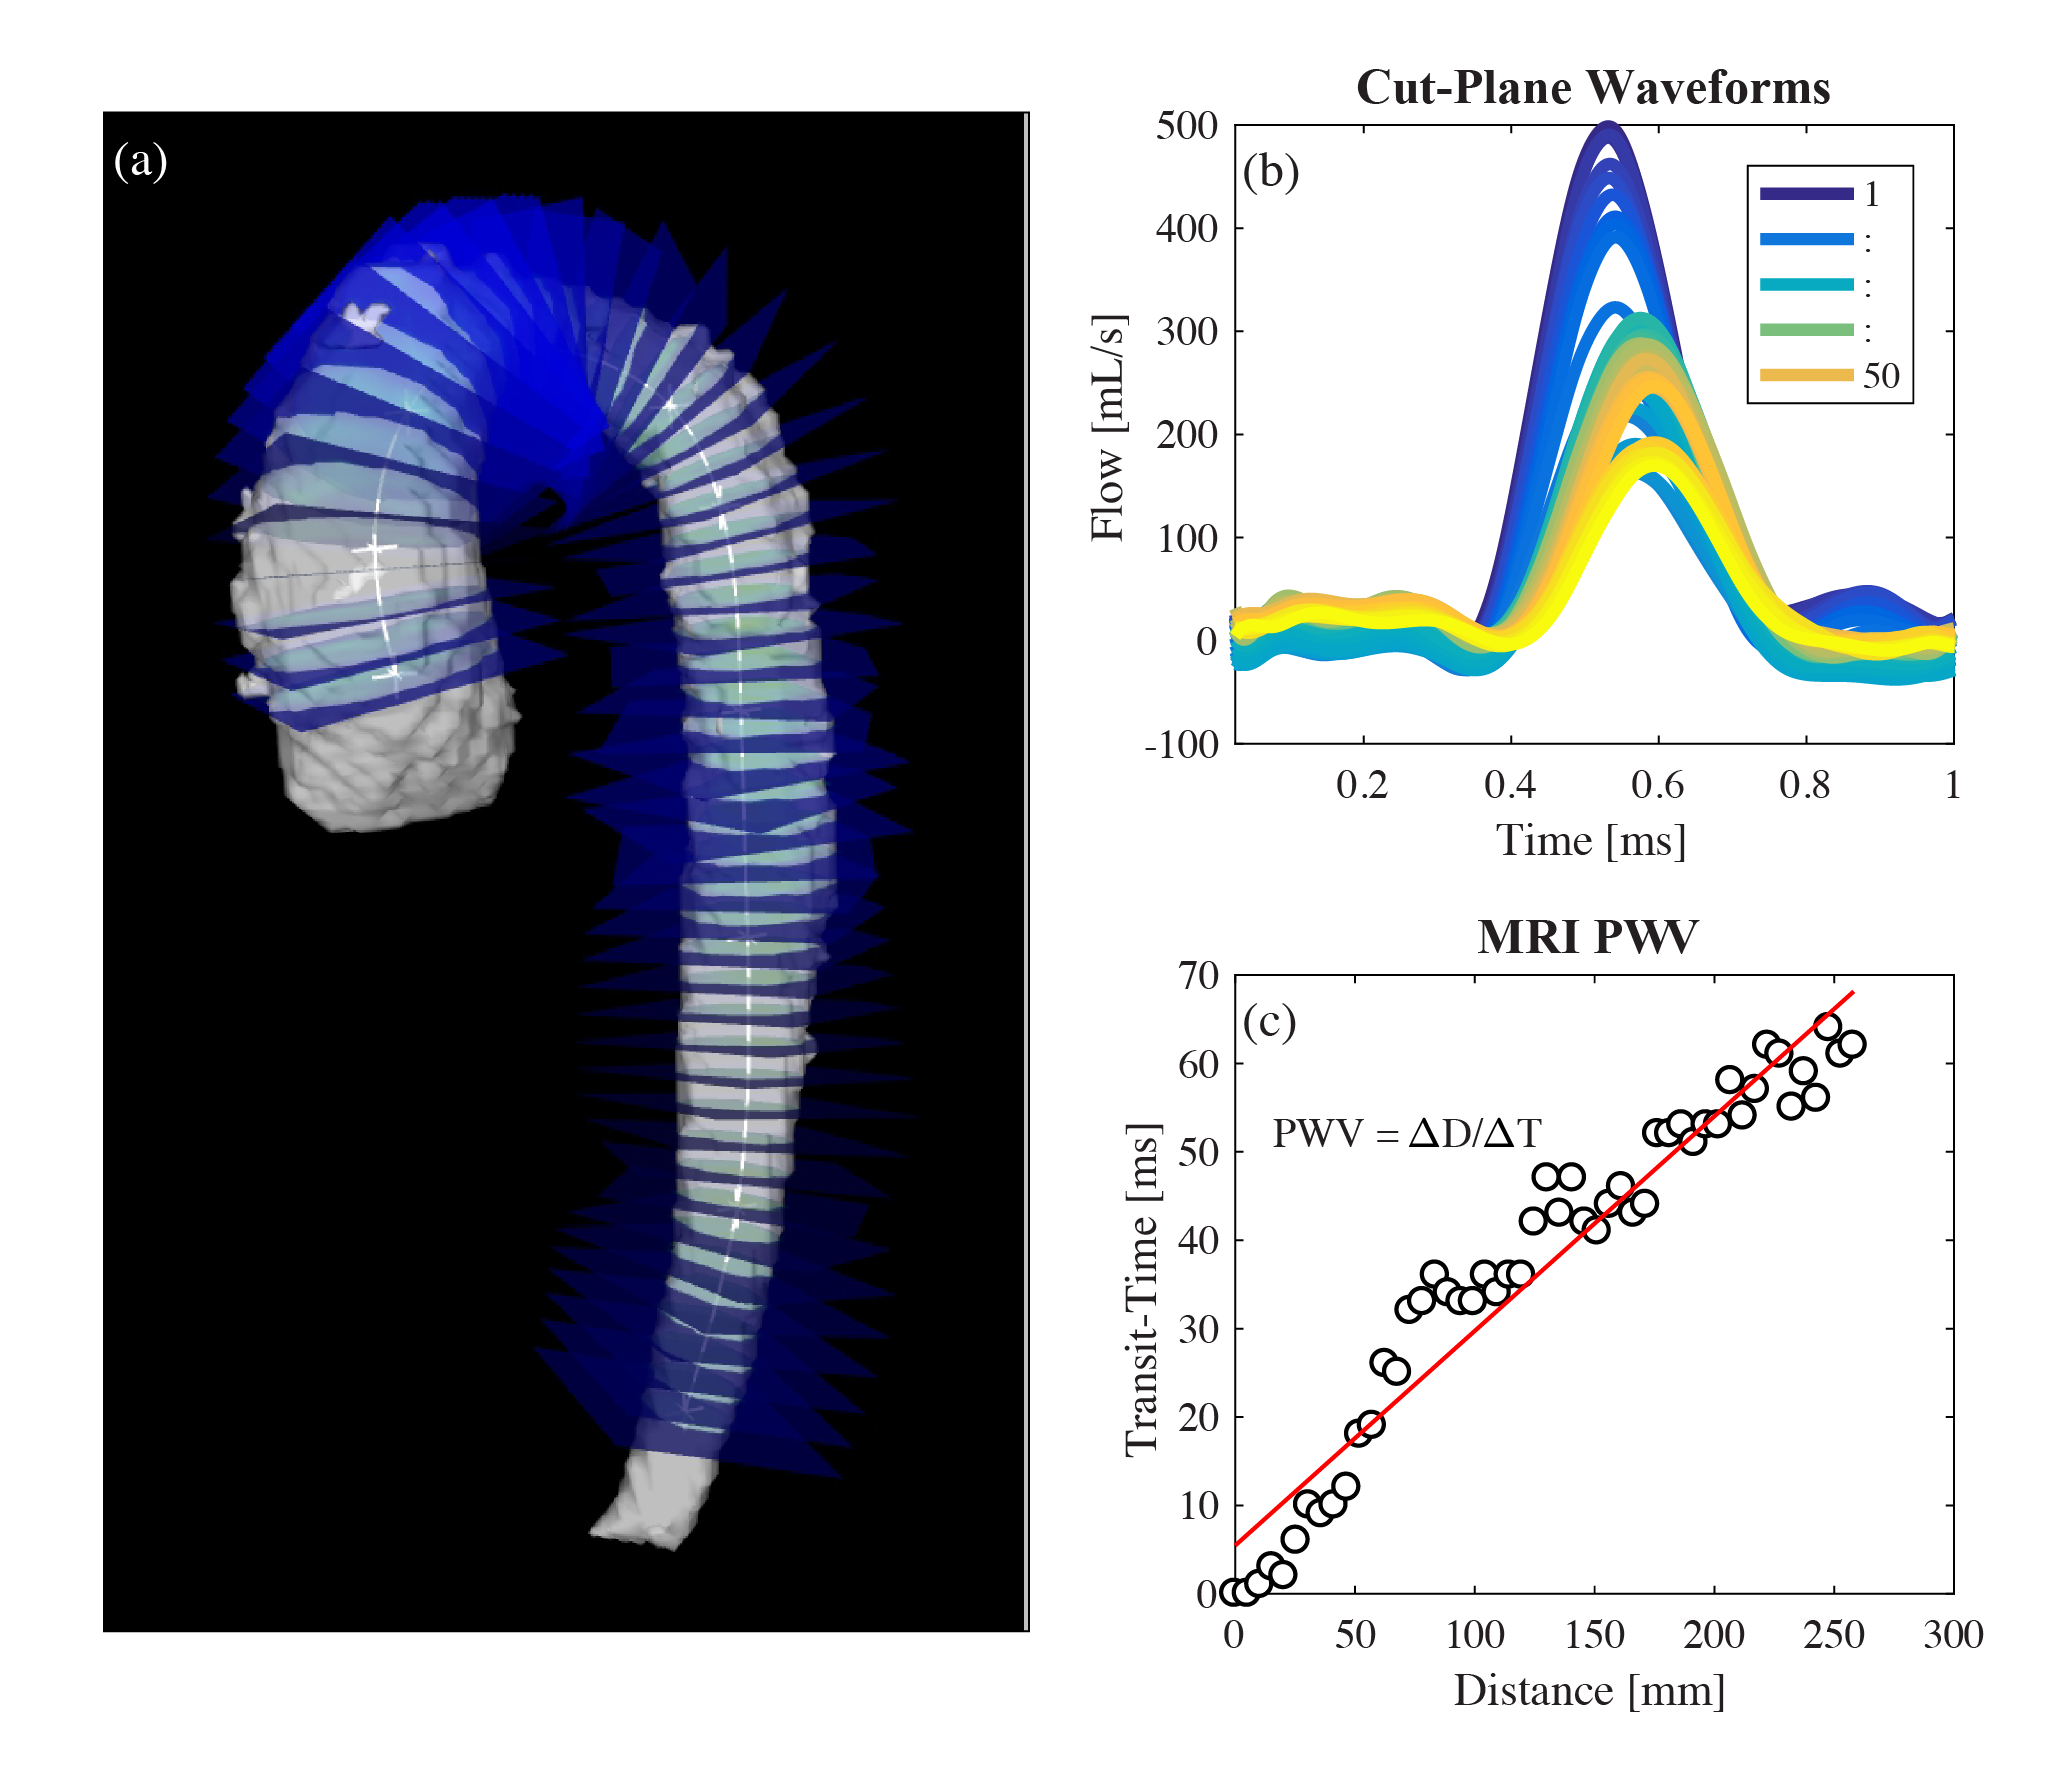
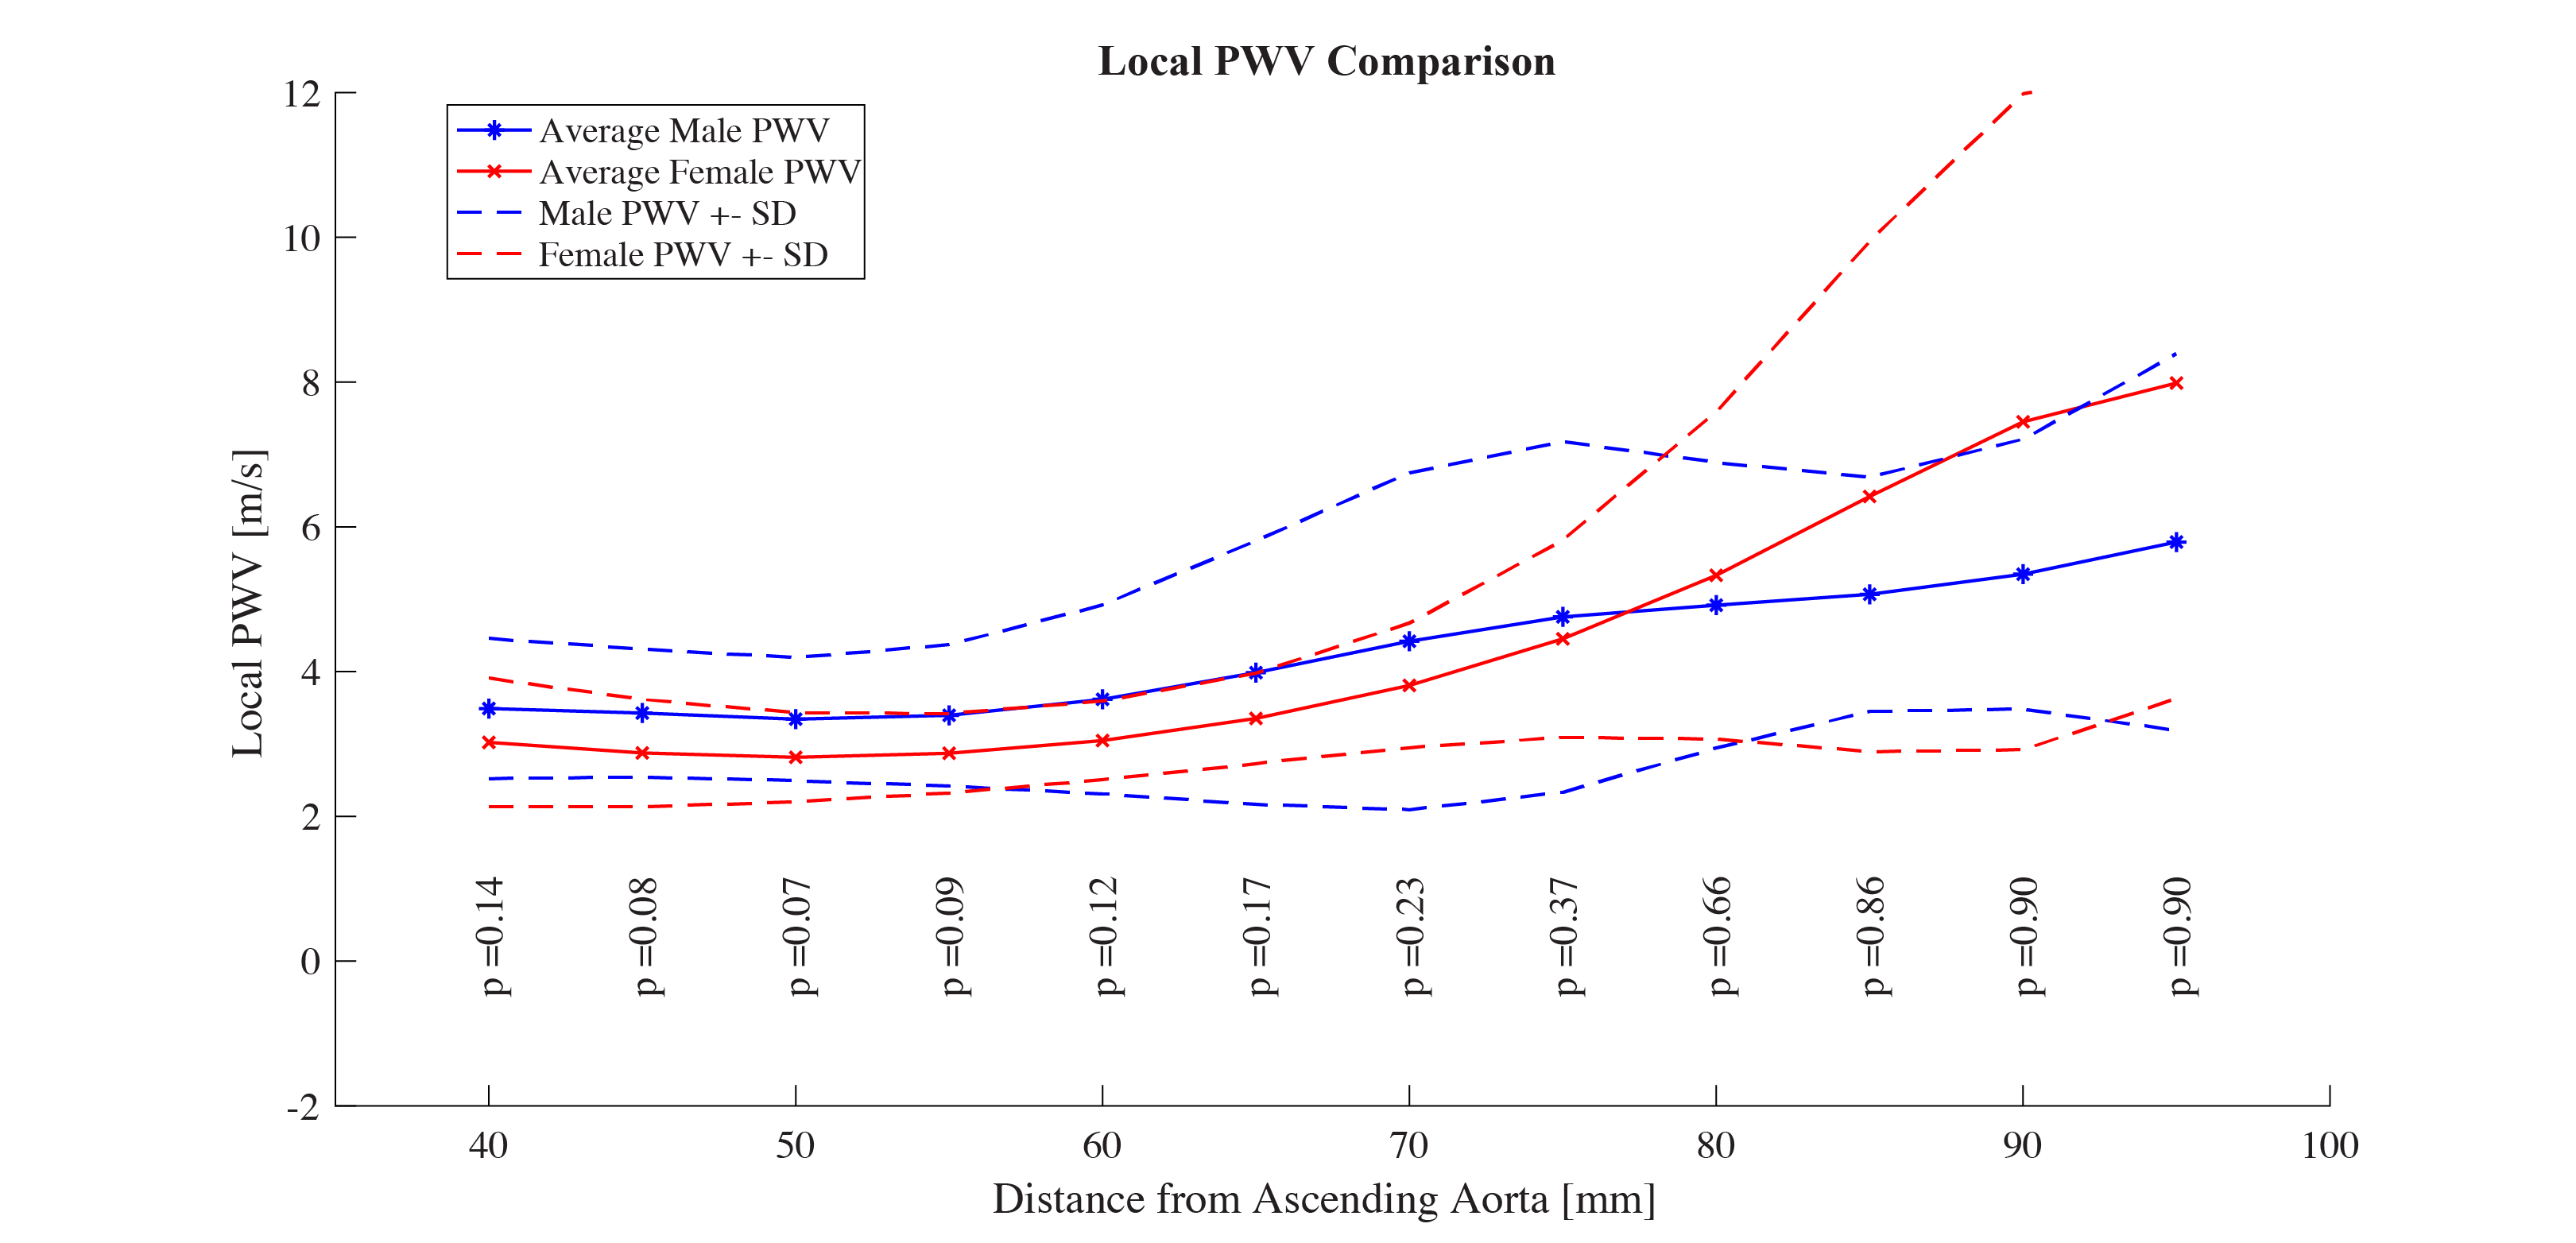
Thirty six healthy volunteers (eighteen men, eighteen women, age 20-32 years) will be enrolled in this ongoing IRB-approved and HIPAA–compliant study. Data from nineteen volunteers is presented here. Subjects were scanned using a clinical 3.0T MRI scanner (MR750, GE Healthcare) with a 32-channel body coil. 3 directional, 3 dimensional, time resolved velocity data was acquired using a 4D Flow MRI sequence called PC-VIPR (Phase Contrast Vastly Under sampled Projection Imaging).9 Data was reconstructed to 40 time frames, allowing for adequate temporal resolution. Flow was quantified in Ensight (CEI, Apex, NC) at planes placed 5 mm apart starting at the ascending aorta and ending at the descending aorta. Regional (whole aorta) PWV was quantified using a custom algorithm, which calculates PWV as the inverse slope of a line fitted to the distance between planes and transit time between flow at each plane (figure 1). Local PWV was calculated at individual planes by taking the inverse slope of a line fitted to distance vs. transit time data 40mm (8 planes) before and after the point of interest (figure 3). Regional and Local PWV were assessed for similarities and differences between male and female subjects.Results
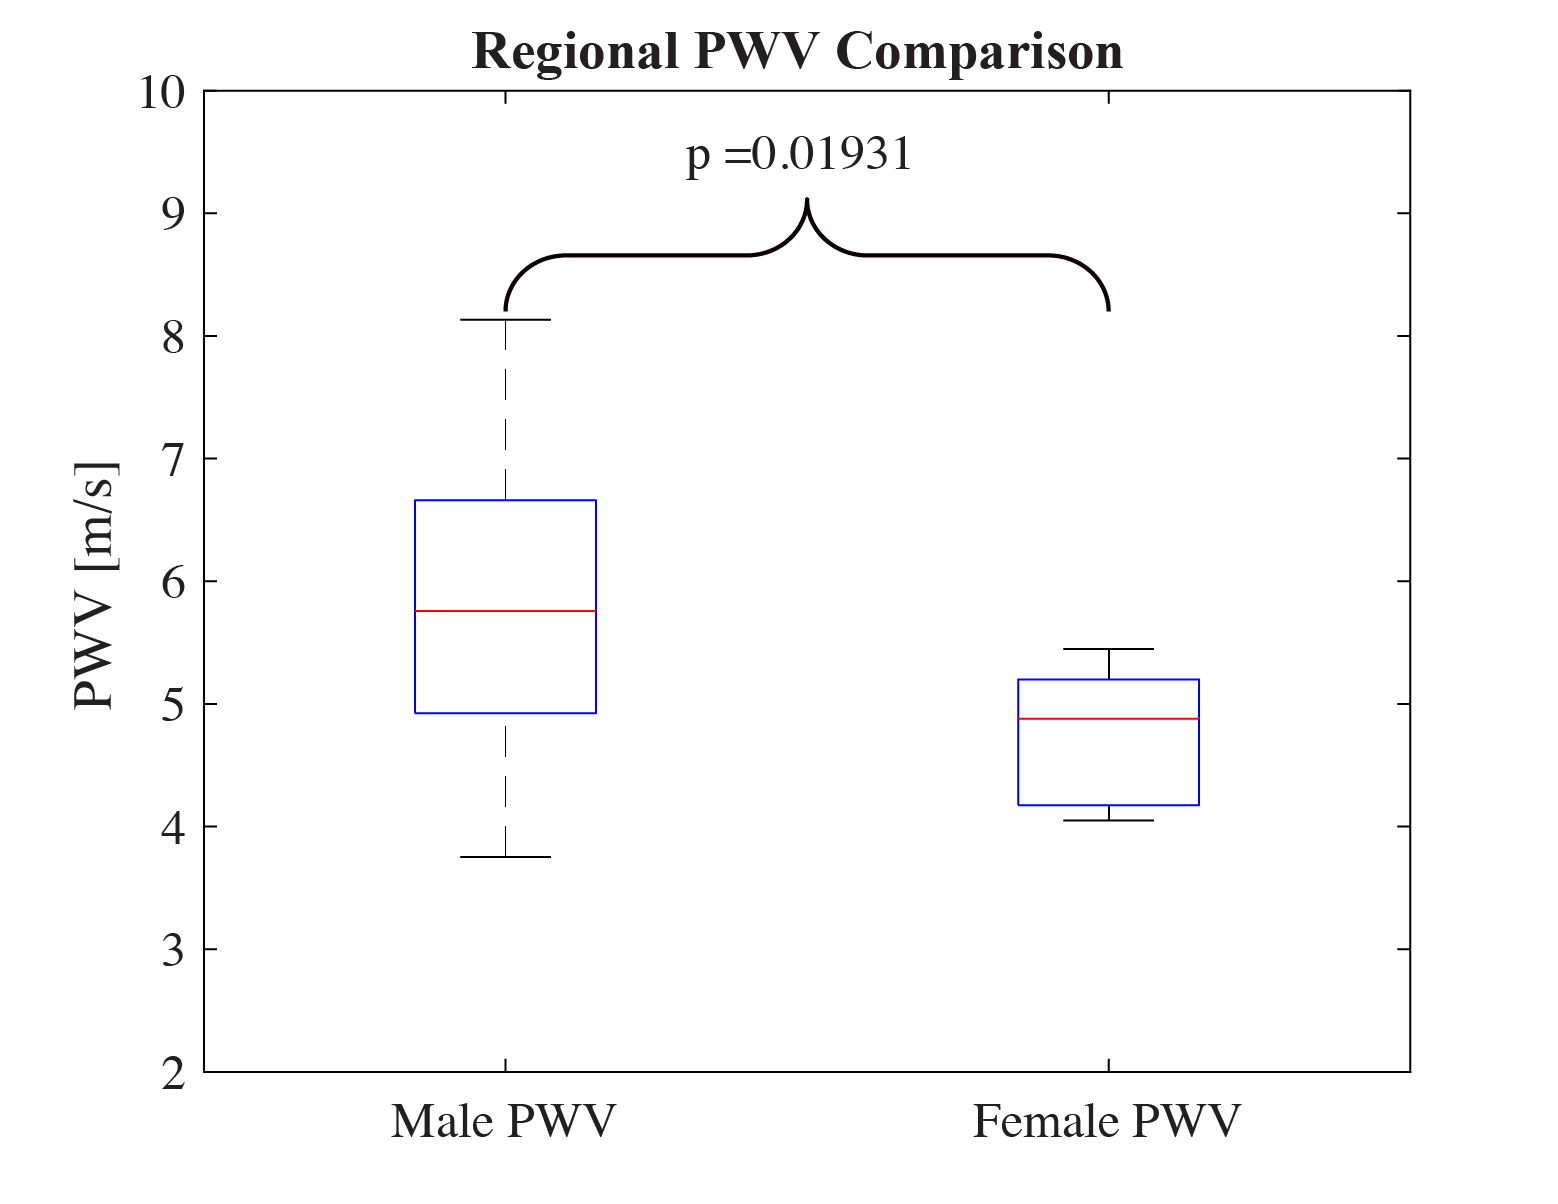
Regional PWV, quantified between the ascending and descending aorta for all subjects, is plotted in figure 2. Regional PWV is significantly higher in men than women (p = 0.018). Local PWV, plotted in figure 4, is evaluated in 5 mm increments starting 40 mm from the central ascending aorta, and ending 95 mm from the central ascending aorta. Results for each location are averaged among subjects. Generally, PWV increases with distance from the ascending aorta in both men and women. However, women experience a sharper increase in PWV further from the ascending aorta. With the present study size, there is no significant difference between local PWV, with a minimum p value occurring at 50 mm (p = 0.07) from the ascending aorta and a maximum p value occurring at 95 mm (p = 0.90).Discussion
Sex-based differences in arterial stiffness can have impact on the occurrence of CVD.2 There is evidence suggesting that estrogen increases production of elastin and decreases deposition of collagen in arteries, thus decreasing stiffness.10 However, this effect has not yet been studied with 4D Flow MRI, which can acquire stiffness information and hemodynamic parameters previously inaccessible with non-invasive techniques. Results, presented here, show that young men have stiffer regional aortic PWV than women. This has been shown to increase load on peripheral organs and the heart, and may play a partial role in the occurrence of CVD. No significant differences between local PWV along the aorta may be attributable to sample size, which will increase as the remaining volunteers are scanned, or relative size of subject aortas. Despite this, initial results show that local PWV may provide unique information on sex-based differences in arterial stiffness, and lead to sex-specific understanding, diagnosis and treatment of CVD.Conclusion
Observed sex-based differences in large artery stiffness may play a partial role in men’s increased CVD occurrence in young and middle aged individuals. In addition, local PWV, measured using 4D Flow MRI, can be used for deeper analysis of cardiovascular differences in the present study of young individuals, and future studies of older individuals.Acknowledgements
No acknowledgement found.References
1. World Health Organization. Cardiovascular diseases. 1–6 (2017). Available at: http://www.who.int/mediacentre/factsheets/fs317/en/. (Accessed: 4th March 2018)
2. Messerli, F. H. et al. Disparate cardiovascular findings in men and women with essential hypertension. Ann. Intern. Med. 107, 158–161 (1987).
3. Barrett-Connor, E. & TL, B. Estrogen and Coronary Hearth Disease in Women. JAMA 265, 1861–1867 (1991).
4. Borlaug, B. a & Paulus, W. J. Heart failure with preserved ejection fraction: pathophysiology, diagnosis, and treatment. Eur. Heart J. 670–679 (2010).
5. Coutinho, T. Arterial stiffness and its clinical implications in women. Can. J. Cardiol. 30, 756–764 (2014).
6. Markl, M. et al. Estimation of global aortic pulse wave velocity by flow-sensitive 4D MRI. Magn. Reson. Med. 63, 1575–1582 (2010).
7. Markl, M. et al. Analysis of pulse wave velocity in the thoracic aorta by flow-sensitive four-dimensional MRI: Reproducibility and correlation with characteristics in patients with aortic atherosclerosis. J. Magn. Reson. Imaging 35, 1162–1168 (2012).
8. Ruesink, T., Medero, R., Rutkowski, D. & Roldán-Alzate, A. In Vitro Validation of 4D Flow MRI for Local Pulse Wave Velocity Estimation. Cardiovasc. Eng. Technol. (2018).
9. Johnson, K. M. et al. Improved 3D phase contrast MRI with off-resonance corrected dual echo VIPR. Magn. Reson. Med. 60, 1329–1336 (2008).
10. Natoli, A. K. et al. Sex steroids modulate human aortic smooth muscle cell matrix protein deposition and matrix metalloproteinase expression. Hypertension 46, 1129–1134 (2005).
Figures