2172
MR-derived both ventricular volumetric analyses with a semi-automatic threshold-based segmentation algorithm in congenital heart diseases: Head-to-head validation in human heart model.1Department of Radiology, Tohoku University Hospital, Sendai, Japan, 2Department of Radiology, National Cerebral and Cardiovascular Center, Suita,Osaka, Japan, 3Division of Pediatric Cardiology, National Cerebral and Cardiovascular Center, Suita,Osaka, Japan
Synopsis
This study aimed to validate cine MRI-derived ventricular volume measurements with a semi-automatic threshold-based segmentation algorithm in a model of congenital heart disease, by comparing it with the standard method of manual tracing MRI and angiocardiography. This novel method allowed more accurate and objective ventricular volumetry in both ventricles of congenital heart diseases and will be of great help for practical use.
INTRODUCTION
Quantification of ventricular volume is important for management and clinical decision-making in congenital heart diseases. Recently, a novel semi-automatic segmentation algorithm has been proposed for faster and more objective MR-derived measurements of cardiac volume.1 The purpose of our study was to validate this new method for volumetric analysis in a model of congenital heart disease, which has a more complex anatomy, by comparing it with the standard method of manual tracing MRI and angiocardiography.METHODS
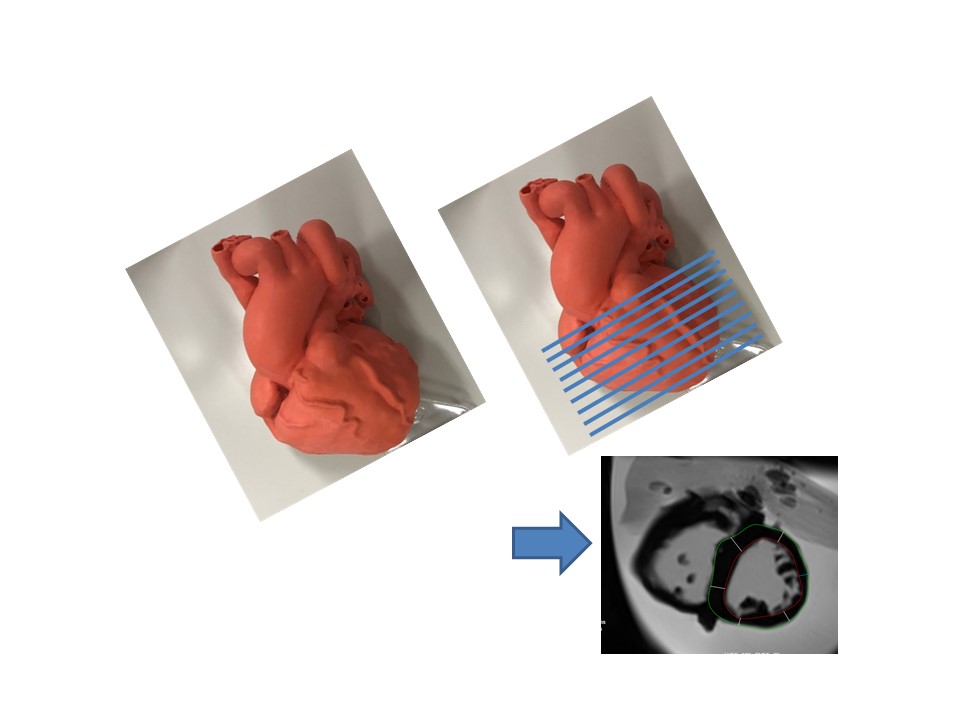
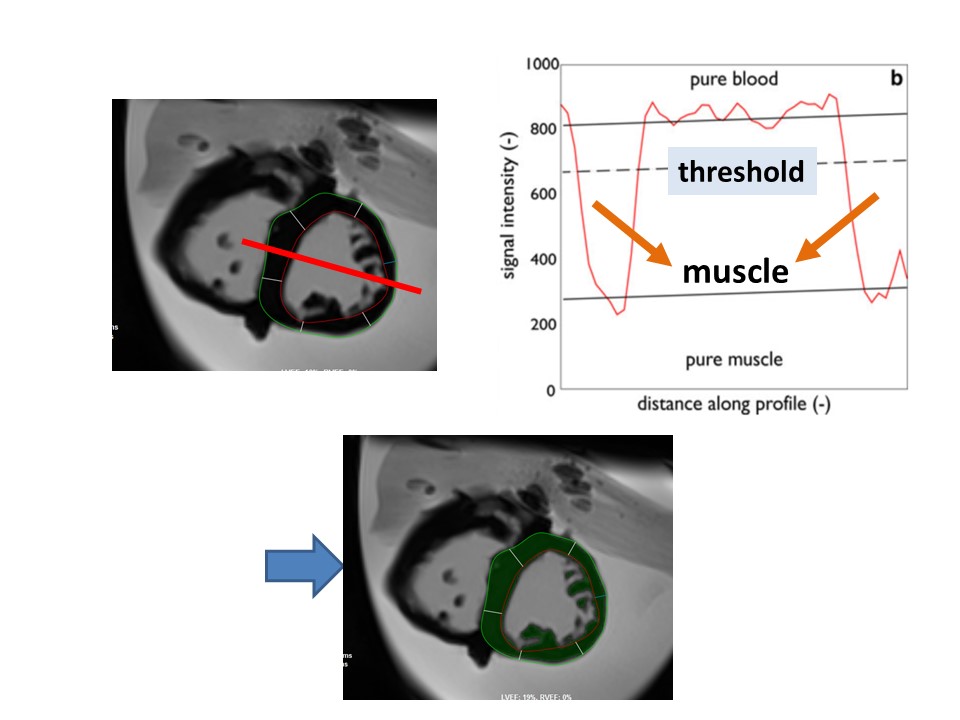
The volumes of left ventricle (LV) and right ventricle (RV) were measured with MRI and angiocardiography in 8 cardiac models based on contrast-enhanced CT data of congenital heart disease (Figure 1). True-FISP cine was used to acquire the multi-slice short axis images of the heart with simulated ECG triggering. LV and RV volume were measured by two observers via manual and semi-automatic methods. For manual method, volume was analyzed via Simpson method by manually tracing the epicardial and endocardial borders. For semi-automatic method, a novel threshold-based segmentation algorithm (Qmass, Medis) classified as blood (ventricular volume) and muscle (including papillary muscle and trabeculae) based on their signal intensity (Figure 2). Angiocardiographic volume was measured with Child method for LV and Graham method for RV. These volumetric techniques were compared to the heart phantom’s true ventricular volume. Intra-and inter-observer agreement coefficients (ACintra and ACinter) were also calculated.RESULTS
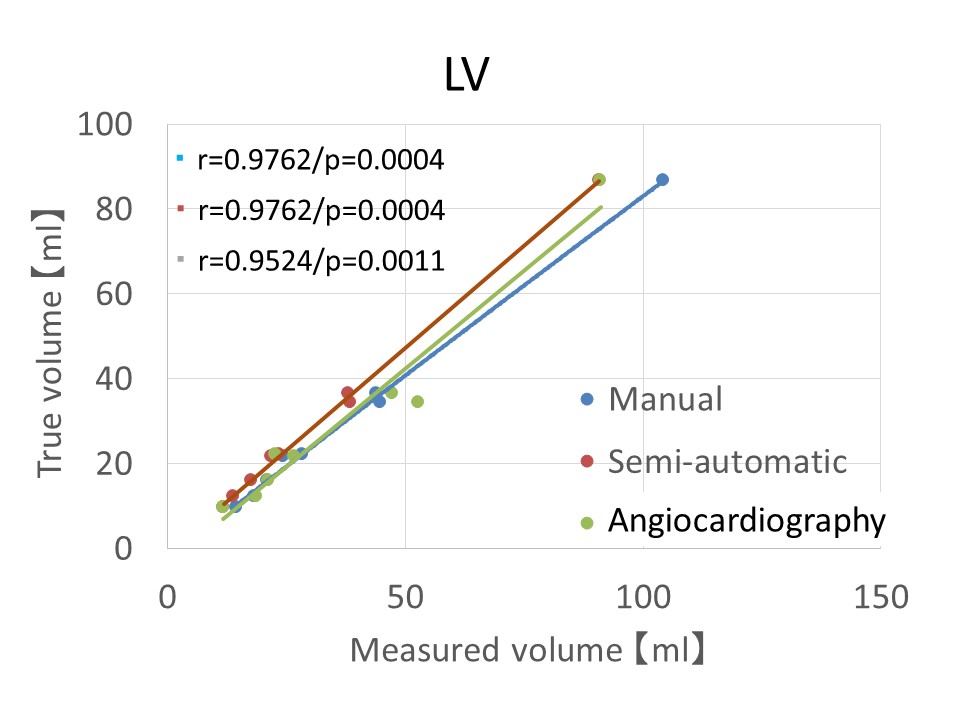
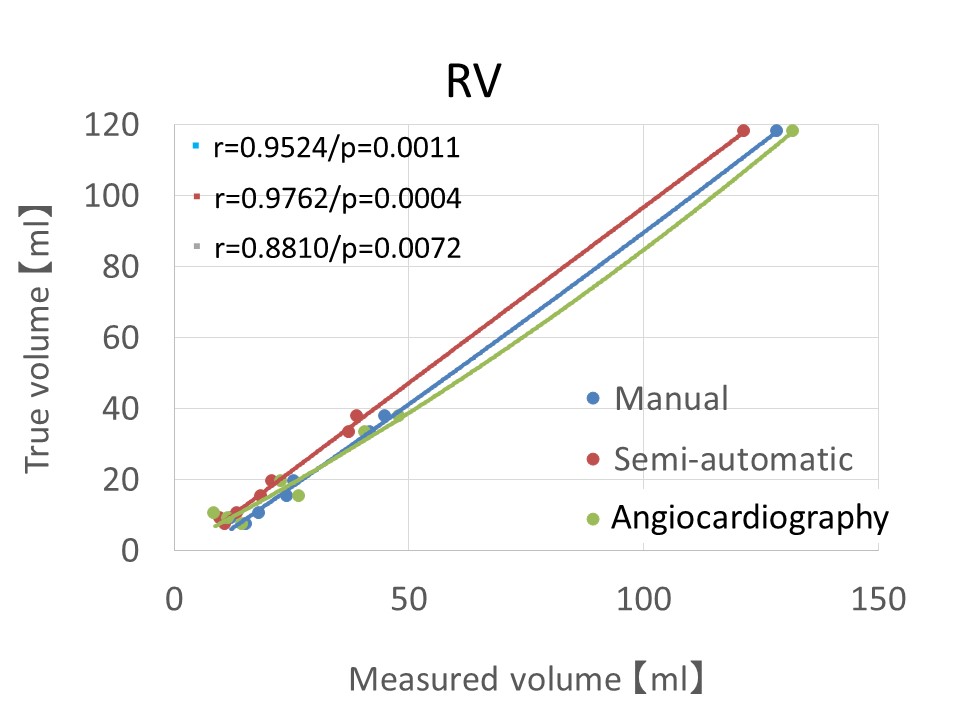
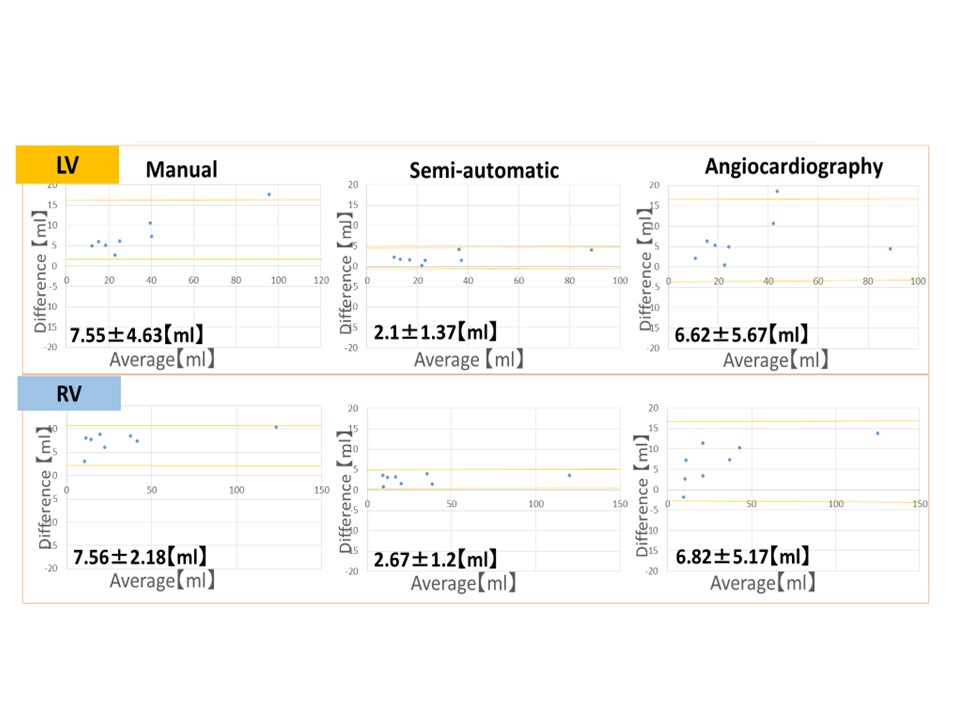
In both ventricles, MRI-derived volume showed good correlation with the true volume, compared to angiocardiography (LV: semi-automatic r=0.9762/p=0.0004, manual r=0.9762/p=0.0004, angiocardiography r=0.9524/p=0.0011, RV: semi-automatic r=0.9762/p=0.0004, manual r=0.9524/p=0.0011, angiocardiography r=0.8810/p=0.0072) (Figure 3 and 4). The systematic error was very small for MRI measured by semi-automatic method. In the mean with semi-automatic MRI, LV was overestimated by 2.1±1.4ml/8.3±5.7% RV by 2.7±1.2ml/13.4±10.5%, with a narrower distribution than other methods (Figure 5). Intra-and inter-observer agreements were sufficiently high in all methods and particularly overall improved with the semi-automatic MRI (ACinter 95%, ACintra 98% for observer 1 and 96% for observer 2).DISCUSSION
Angiocardiography is traditionally performed for volume measurements in congenital heart disease using estimated formula to exclude the trabecula and papillary muscles,2 however it is an invasive procedure and not well suited for screening and frequent follow up. Recently, cine MRI is considered the standard modality for noninvasive and reproducible assessment of ventricular volume and function. The standard method of manual tracing, which include the trabecula and papillary muscles in the blood volume, introduces a considerable bias in the measured volumes.3 Furthermore, to manually draw epicardial and endocardial contours in congenital heart disease which has a geometrically more complex ventricles is time consuming. The semi-automatic method could exclude endoluminal muscular structures from the blood volume with more precise volumetry and improved reproducibility. This novel method provide faster and more objective analysis, and will be of great help for practical use.CONCLUSION
Cine MRI with the semi-automatic method yielded the most precise volumetry of congenital heart disease with a smaller difference from the true volume and improved the reproducibility in cardiac volume measurements, compared to conventional methods using MRI and angiocardiography.Acknowledgements
No acknowledgement found.References
1. Jaspers K, Freling HG, van Wijk K, et al. Improving the reproducibility of MR-derived left ventricular volume and function measurements with a semi-automatic threshold-based segmentation algorithm. Int J Cardiovasc Imaging. 2013;29(3):617-23
2. Graham TP Jr, Jarmakani JM, Atwood GF, et al. Right ventricular volume determinations in children. Normal values and observations with volume or pressure overload. Circulation. 1973 ;47(1):144-53.
3. Sievers B, Kirchberg S, Bakan A, et al. Impact of papillary muscles in ventricular volume and ejection fraction assessment by cardiovascular magnetic resonance. J Cardiovasc Magn Reson 2004: 6(1):9–16
Figures