2171
An Harmonic Phase Interpolation Method for the Estimation of Motion from Tagged MR Images1Biomedical Imaging Center, Pontificia Universidad Católica de Chile, Santiago, Chile, 2Millennium Nucleus for Cardiovascular Magnetic Resonance, Santiago, Chile, 3Department of Electrical Engineering, Pontificia Universidad Católica de Chile, Santiago, Chile, 4Department of Radiology, School of Medicine, Pontificia Universidad Católica de Chile, Santiago, Chile, 5Institute for Biological and Medical Enginnering, Schools of Engineering, Medicine, and Biological Sciences, Pontificia Universidad Católica de Chile, Santiago, Chile
Synopsis
Tagging MR is still considered the gold standard for motion quantification in the heart walls. Although there are several methods for postprocessing this kind of images, harmonic phase methods such as HARP and SinMod has been widely used because of its simplicity and reliable results. In this work, we present a novel Harmonic Phase Interpolation (HARP-I) for the estimation of motion, which has low noise sensitivity, performs better than HARP and SinMod, and does not depend on temporal resolution.
Introduction
Tagged Magnetic Resonance (TMR) is the most common MR technique for the assessment of the myocardial motion and is available in most of the research and clinical scanners. In this technique, a magnetization grid is generated over the tissue at the beginning of the cardiac cycle, which moves consequently with the cardiac motion.
TMR images are commonly post-processed using semi-automated techniques as Harmonic Phase (HARP) and Sine-Modeling analysis (SinMod). Both of them use bandpass filters to isolate the harmonic phase of the image, but HARP estimates motion using local approximations of the phase gradient1, whereas SinMod does it using power spectrums2. However, both techniques share the same dependency on temporal resolution and in consequence can suffer from large post-processing times when the analysis of later cardiac phases is needed.
In this work, we propose a novel method for the estimation of motion using TMR images called HARP-I (Harmonic Phase Interpolations), which performs better than SinMod and HARP and does not depend on temporal resolution.
Methods
The motion of a continuum body $$$\boldsymbol{B}$$$ can be described using the deformation mapping $$$\boldsymbol{\varphi}(\boldsymbol{X},t)$$$, which maps material coordinates $$$\boldsymbol{X}\in\boldsymbol{B}$$$ onto spatial coordinates $$$\boldsymbol{x}\in\boldsymbol{B}_t$$$ (see Fig. 1). Here $$$\boldsymbol{B}_t$$$ represents the position of $$$\boldsymbol{B}$$$ at time $$$t$$$. Assuming that the relation $$$\boldsymbol{\phi}(\boldsymbol{X})=\boldsymbol{\phi}(\boldsymbol{x}(t))$$$ holds for every $$$t$$$ [4,5], we can define a new coordinate system based on the harmonic phase, defined by
$$\boldsymbol{\varphi}^{-1}(\boldsymbol{x},t)=\boldsymbol{\phi}(\boldsymbol{x},t)$$
which maps every spatial position $$$\boldsymbol{x}$$$ of the tissue to the reference phase $$$\boldsymbol{\phi}_0$$$. Using this information, spatial coordinates were mapped into material coordinates using an a Radial Basis Function interpolation scheme defined by:
$$\boldsymbol{g}(\boldsymbol{y})=\sum_{i=1}^{\text{N}^o\text{ of pixels}}\omega_i\cdot \psi(\lVert\boldsymbol{y}-\boldsymbol{\phi}(\boldsymbol{x}_i,t)\rVert) $$
where $$$g(\boldsymbol{y})$$$ denotes the interpolated function at the point $$$\boldsymbol{y}$$$, $$$\psi(\lVert\boldsymbol{y}-\boldsymbol{\phi}(\boldsymbol{x}_i,t)\rVert)$$$ is an interpolation function centered at $$$\boldsymbol{\phi}(\boldsymbol{x}_i,t)$$$ and evaluated at $$$\boldsymbol{y}$$$, and $$$\omega_i$$$ is the $$$i$$$-th basis function weighting factor. This interpolator is chosen to satisfy $$$\boldsymbol{g}(\boldsymbol{\phi}(\boldsymbol{x}_i,t))=\boldsymbol{x}_i$$$, which means that when is evaluated at $$$\boldsymbol{\phi}(\boldsymbol{X})$$$, interpolates the spatial position of the tissue into its material description. The previous interpolation scheme was relaxed to incorporate the presence of noise in the same way as it was done Gilliam3. Finally, displacement fields are estimated using:
$$\boldsymbol{U}(\boldsymbol{X},t)=\boldsymbol{x}-\boldsymbol{X}$$
With this last relation, two-dimensional strain metrics can be estimated using the relations
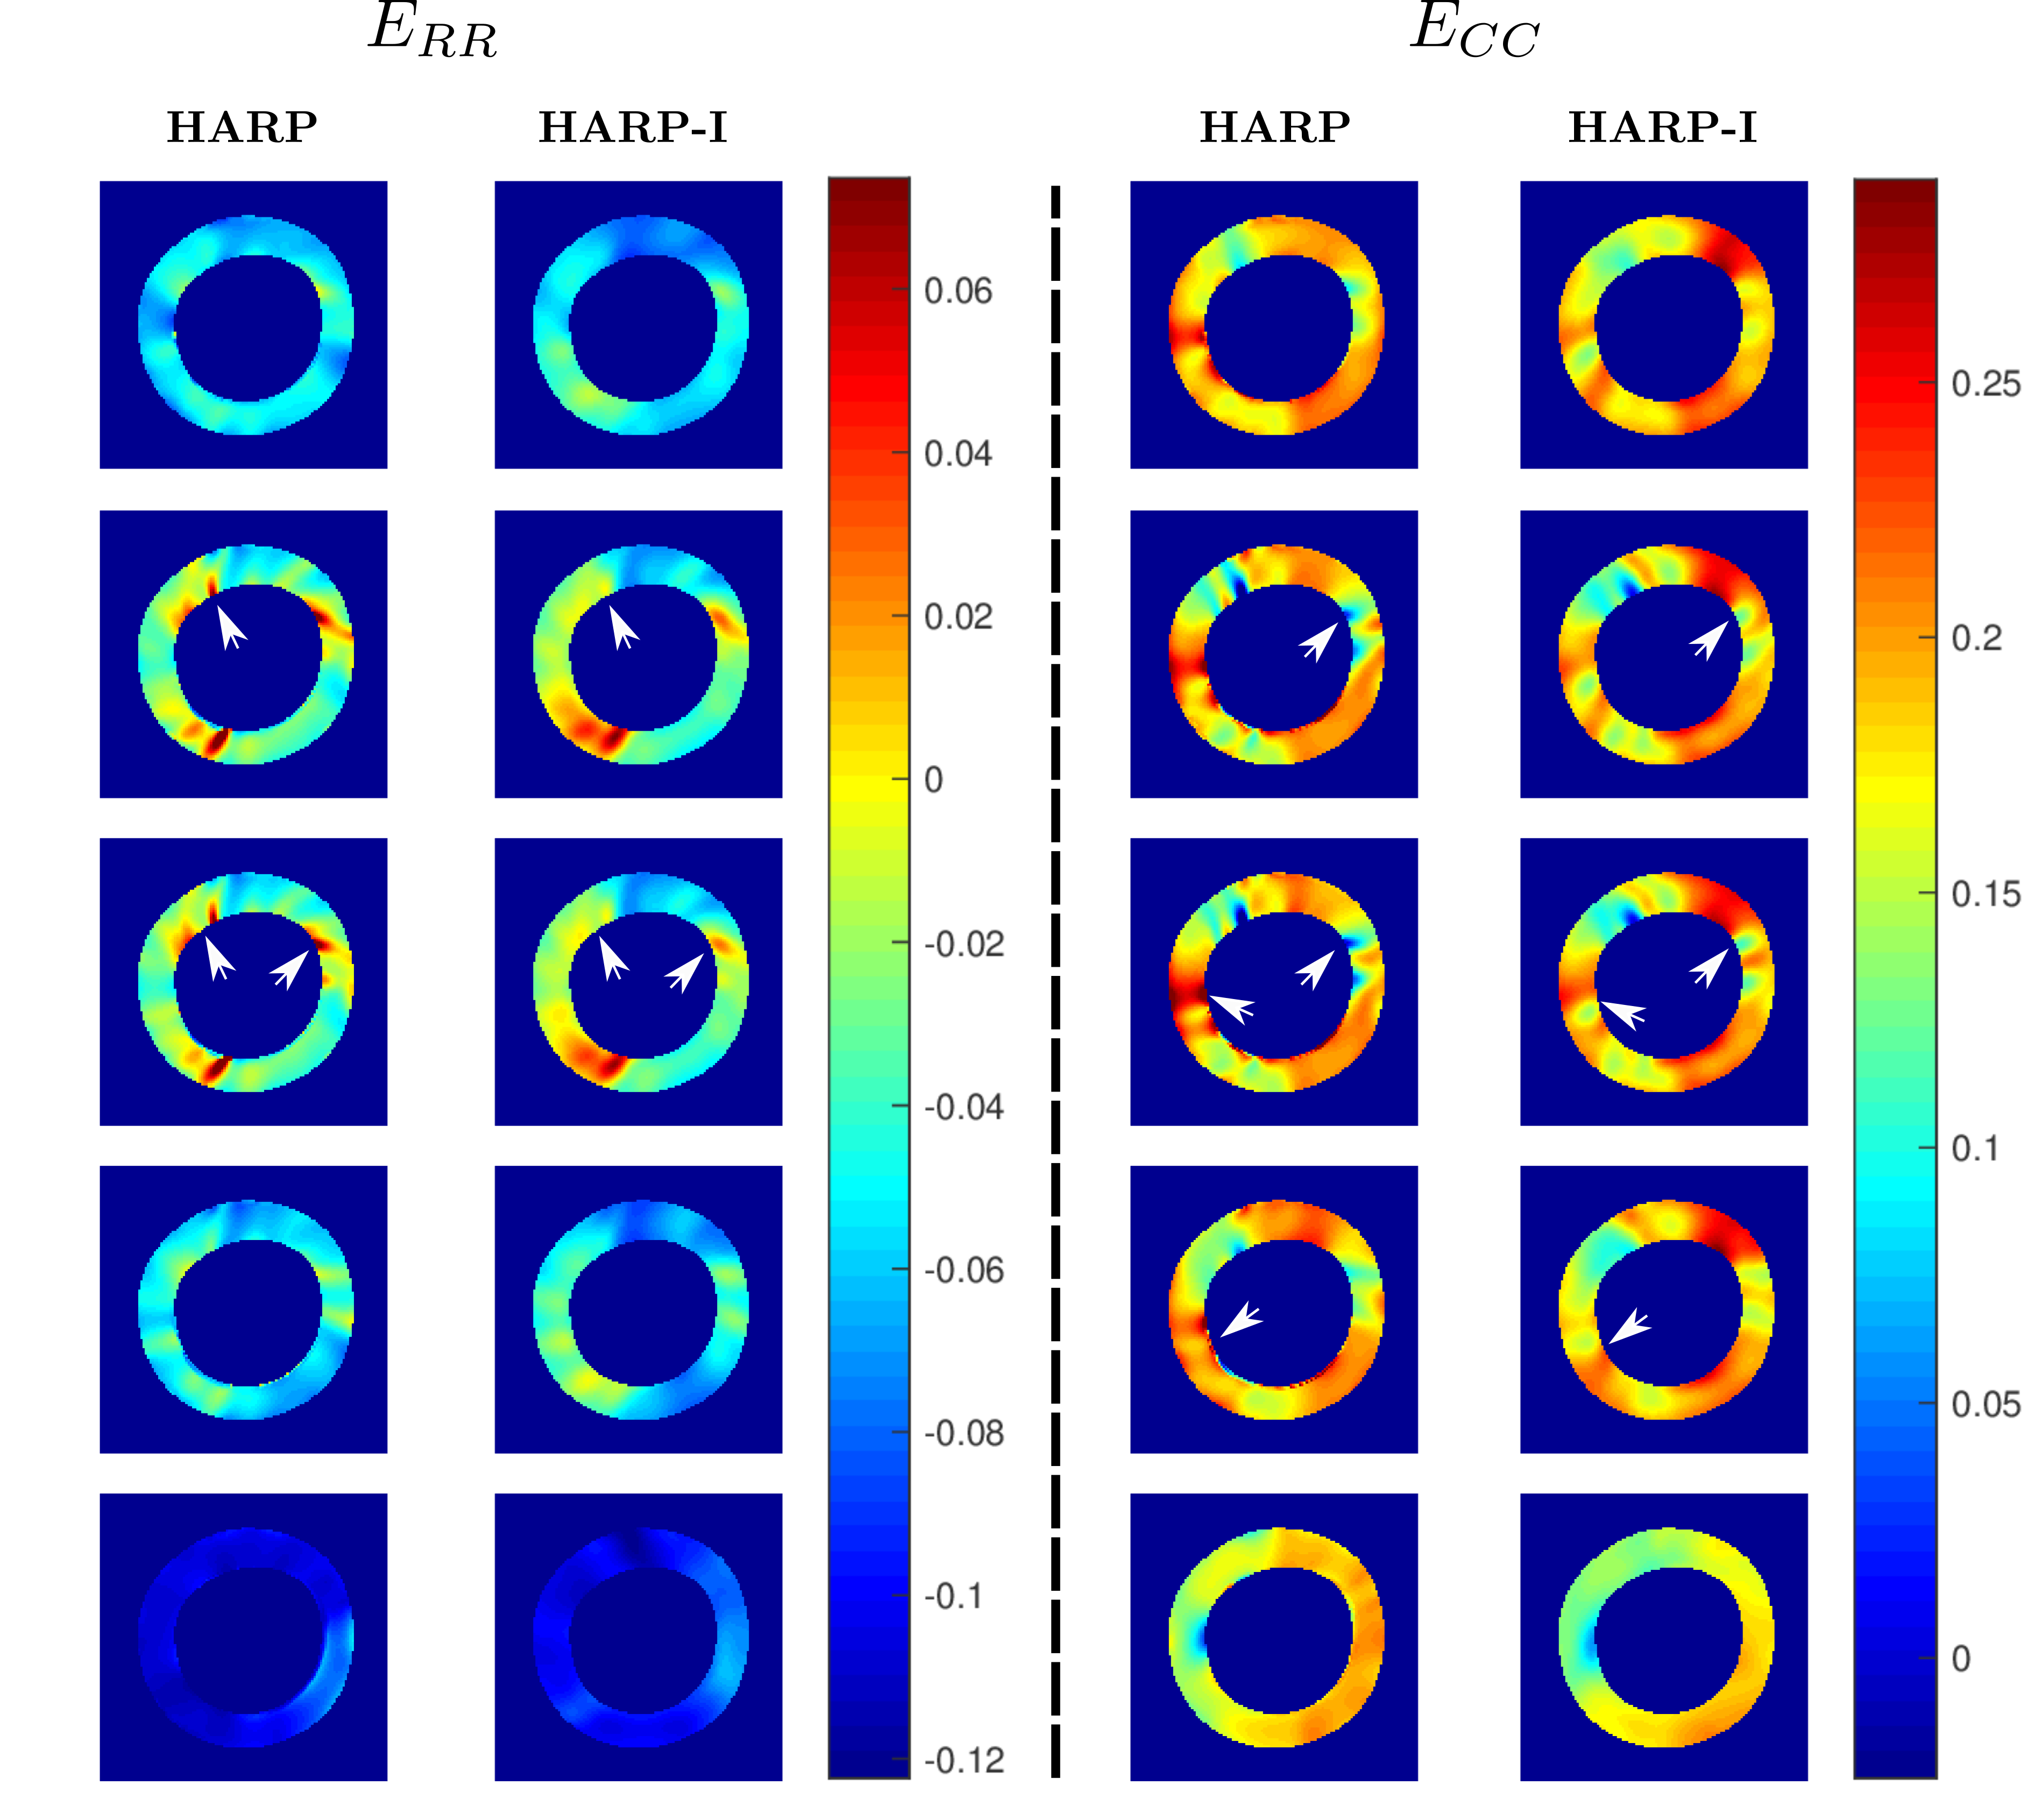
$$E_{RR}=\hat{\boldsymbol{\lambda}}_{RR}\cdot \textbf{E}\hat{\boldsymbol{\lambda}}_{RR}$$ $$E_{CC}=\hat{\boldsymbol{\lambda}}_{CC}\cdot \textbf{E}\hat{\boldsymbol{\lambda}}_{CC}$$
where $$$\textbf{E}$$$ represents the Lagrangian strain tensor, and $$$E_{RR}$$$ and $$$E_{CC}$$$ are the radial and circumferential components respectively. The unitary vectors $$$\hat{\boldsymbol{\lambda}}_{RR}$$$ and $$$\hat{\boldsymbol{\lambda}}_{CC}$$$ are pointing to the radial and circumferential directions, respectively.
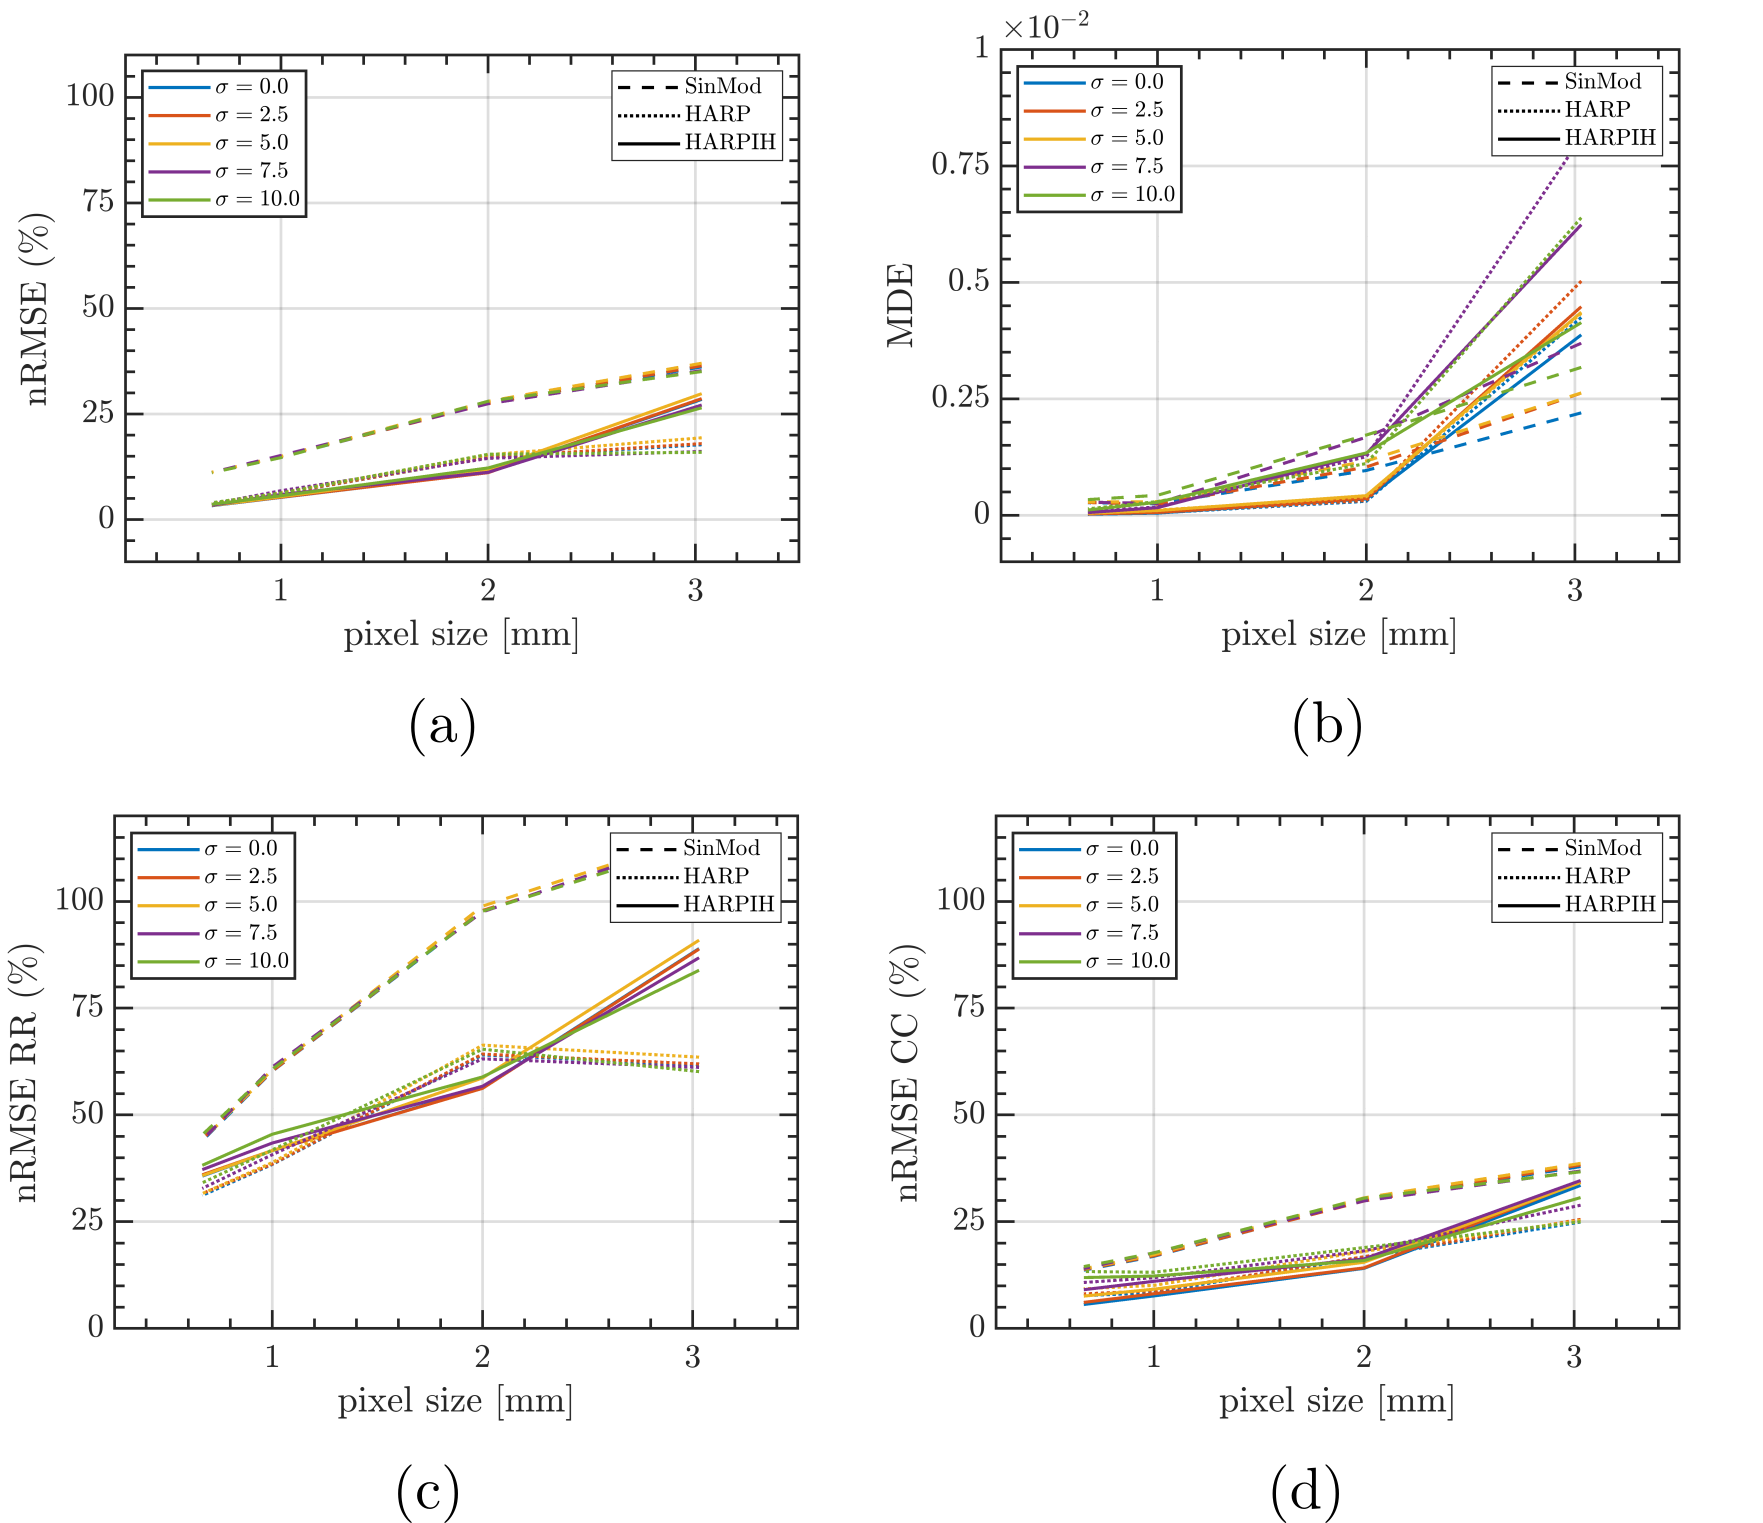
To test the performance of HARP-I, 20 simulated two-dimensional C-SPAMM images were generated using a homemade library. Each image was created using a different set of geometric and physiologic conditions, and considering six resolution and five noise levels. Results were compared against exact values, HARP, and SinMod techniques, and error was measured using the Normalized Root Square Error (nRMSE) and Directional Error (DE), defined as:
$$nRMSE_a=\sqrt{\frac{\sum_{i=1}^{N} (\lvert a(x)\rvert -\lvert a_e(x)\rvert)^2 }{\sum_{i=1}^{N} \lvert a_e(x)\rvert}}$$
$$nRMSE_{\boldsymbol{u}}=\sqrt{\frac{\sum_{i=1}^{N}(\lVert\boldsymbol{u}(x)\rVert_2-\lVert\boldsymbol{u}_e(x)\rVert_2)^2 }{\sum_{i=1}^{N} \lVert\boldsymbol{u}_e(x)\rVert_2}}$$
$$MDE=\frac{1}{N} \sum_{i=1}^{N}\left(1-\frac{|\boldsymbol{u}(x)\cdot \boldsymbol{u}_e(x)|}{\lVert\boldsymbol{u}(x)\rVert_2\lVert\boldsymbol{u}_e(x)\rVert_2}\right)$$
where $$$N$$$ represents the number of analyzed pixels in the image and $$$nRMSE_a$$$ (resp. $$$nRMSE_{\boldsymbol{u}}$$$), the $$$nRMSE$$$$ for a scalar (resp. vectorial) quantity and subscript $$$()_e$$$ denote the exact value.
Also, in-vitro data from the Motion Tracking Challenge4, which consisted of PVA model deformed using an MR-compatible actuator, was analyzed using HARP-I and results were contrasted against HARP (SinMod was not tested due to the presence of high-frequency harmonics in the tagged MR images).
Results and discussion
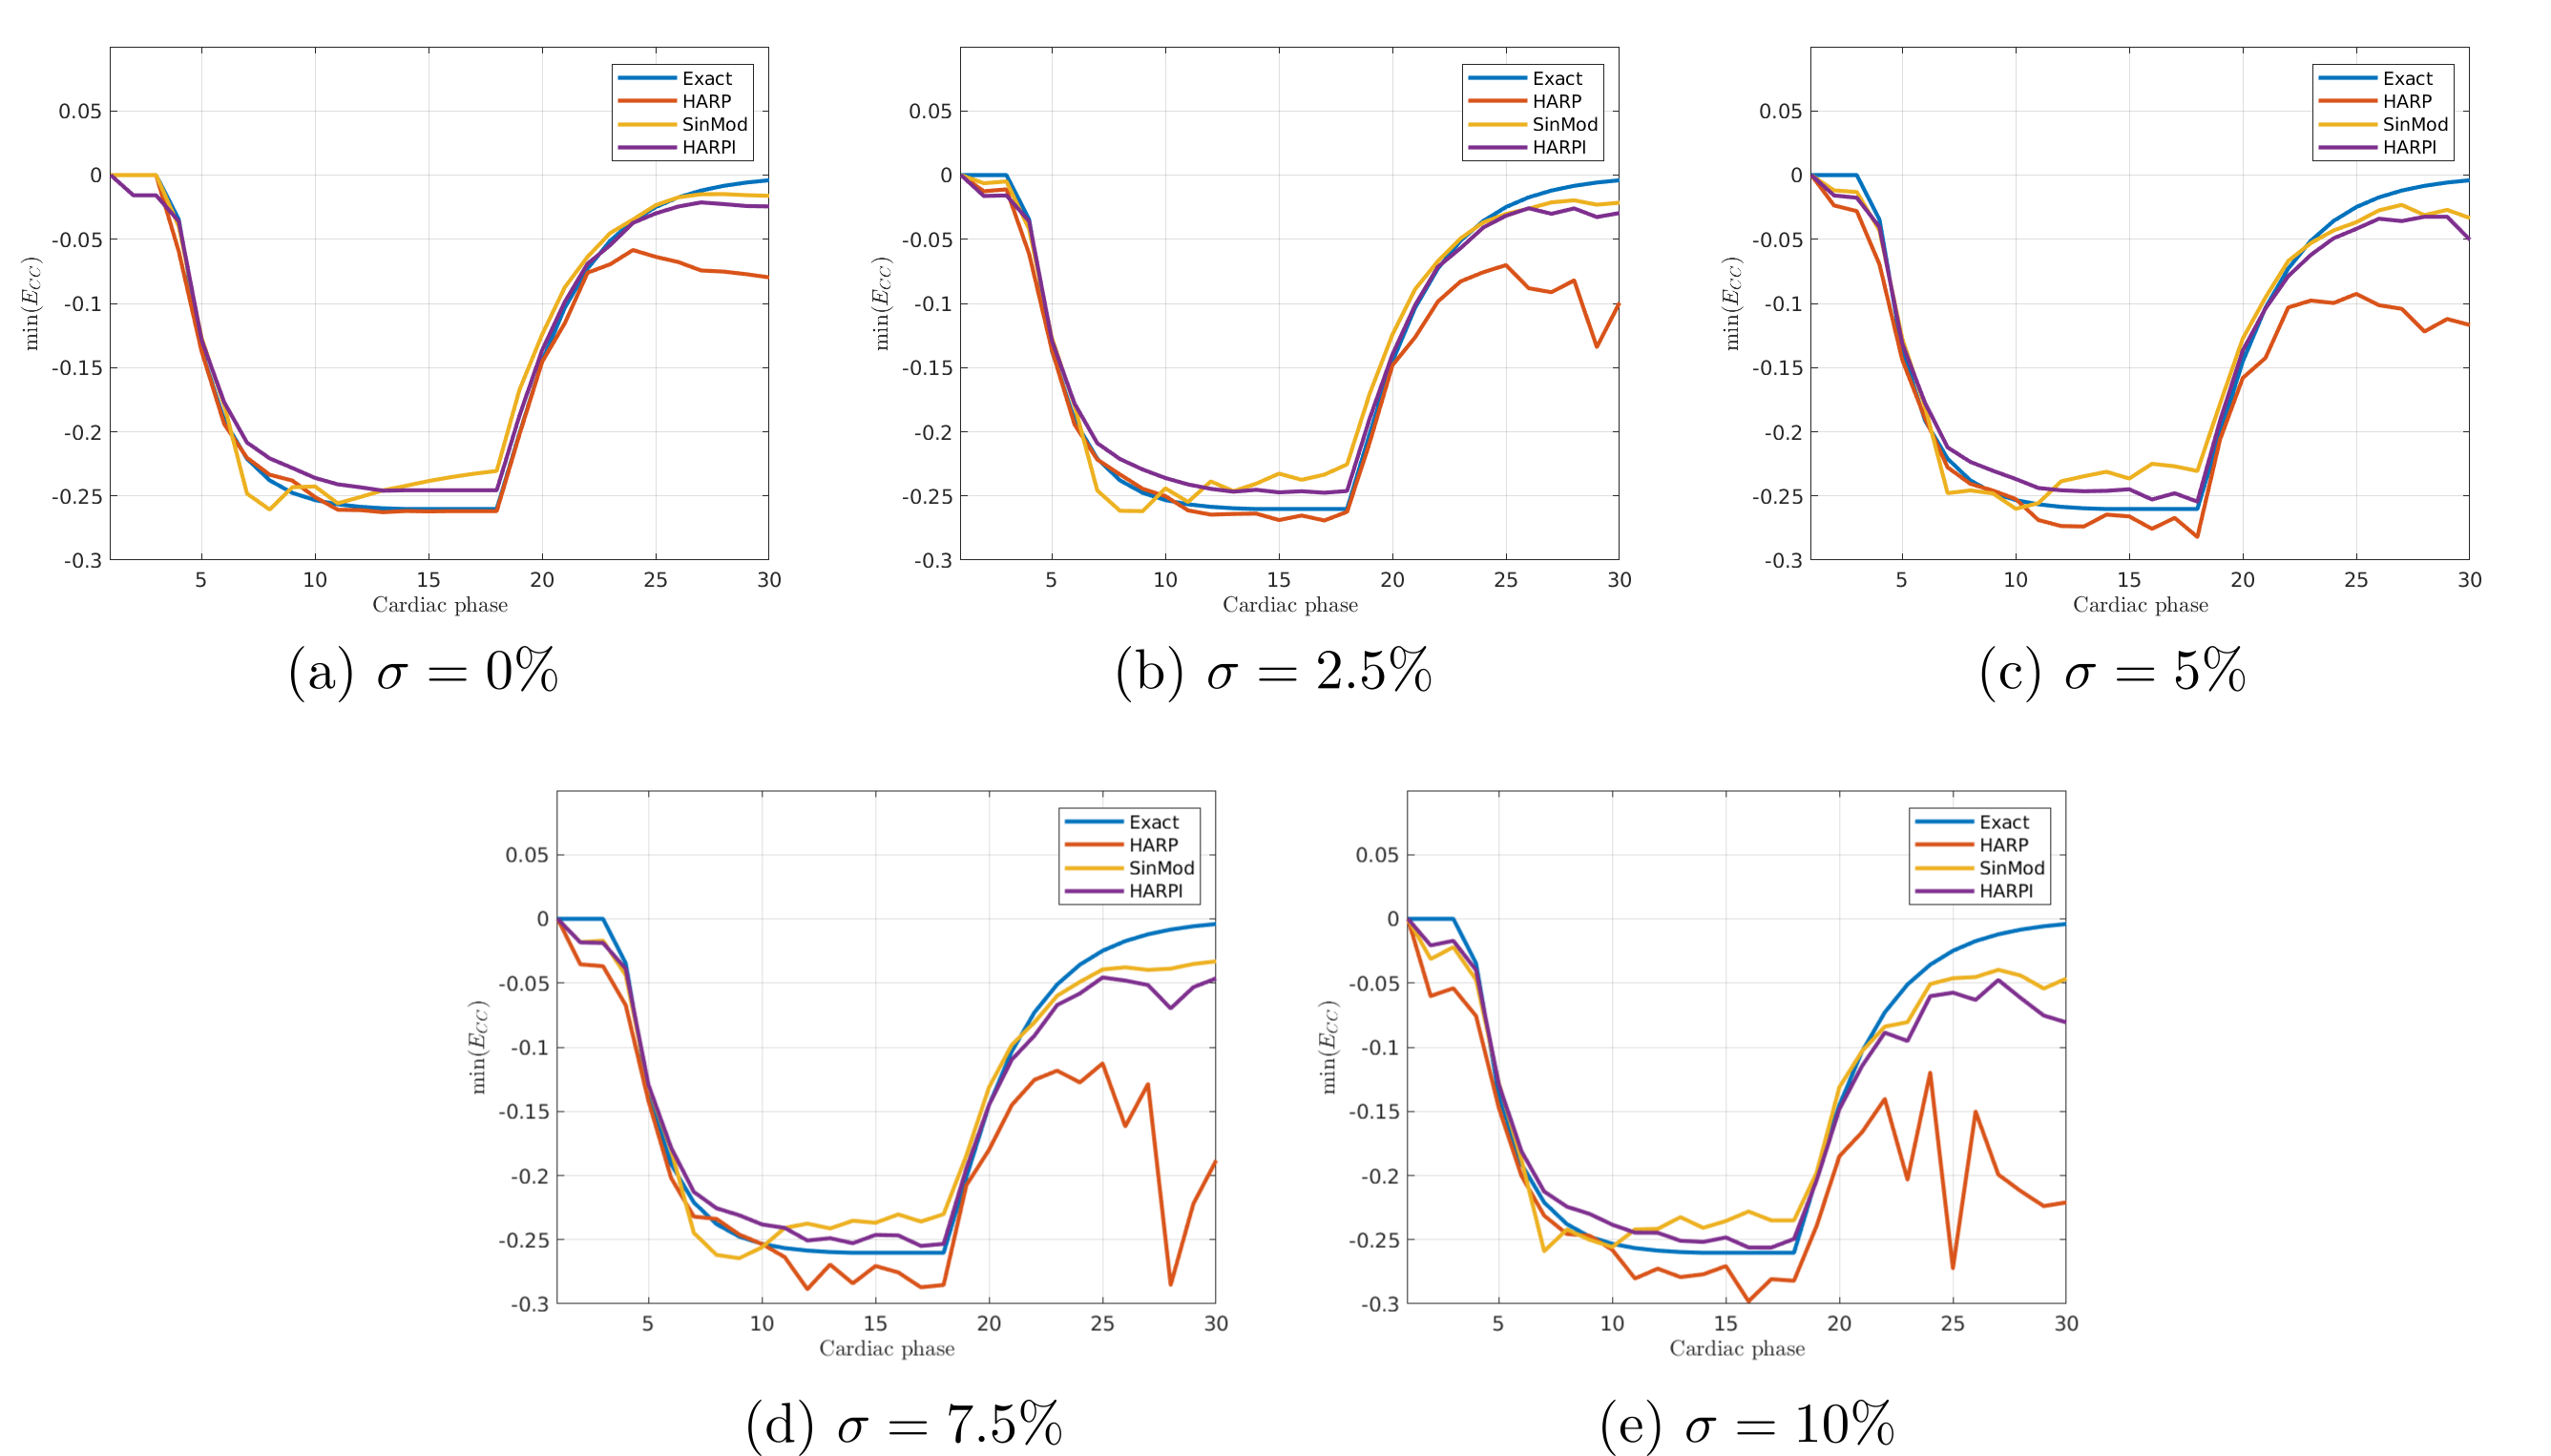
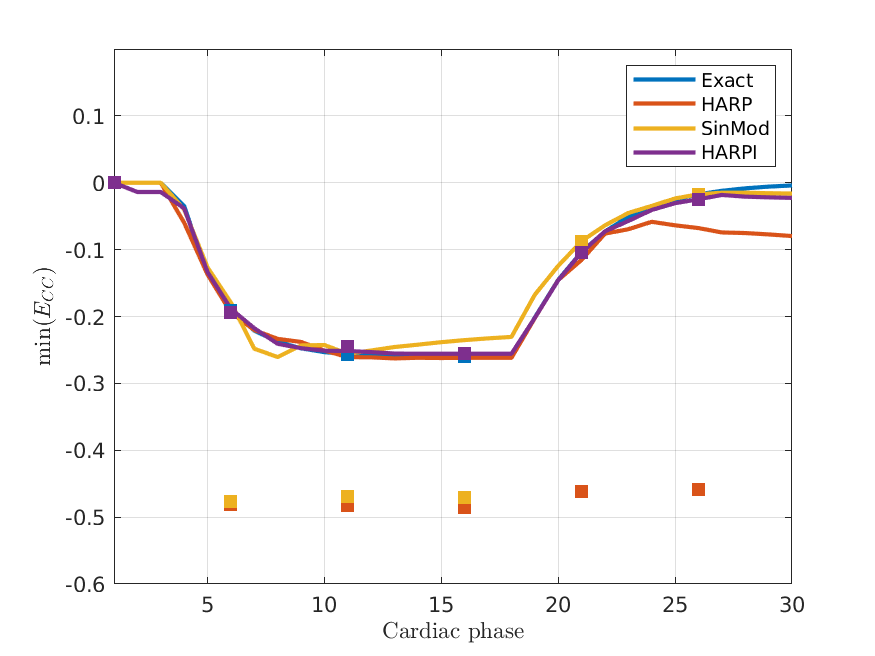
Figures 2 and 3 show the results of HARP-I, HARP, and SinMod on the synthetic data. In Figs. 2a and 2b, the mean nRMSE and DE errors, estimated across the whole synthetic dataset are shown. Figure 3 contains the minimum $$$E_{CC}$$$ for one synthetic data with a fixed resolution, for different noise levels, and for every cardiac phase, whereas in Fig. 4 the same analysis was done with images undersampled in time and without considering noise.
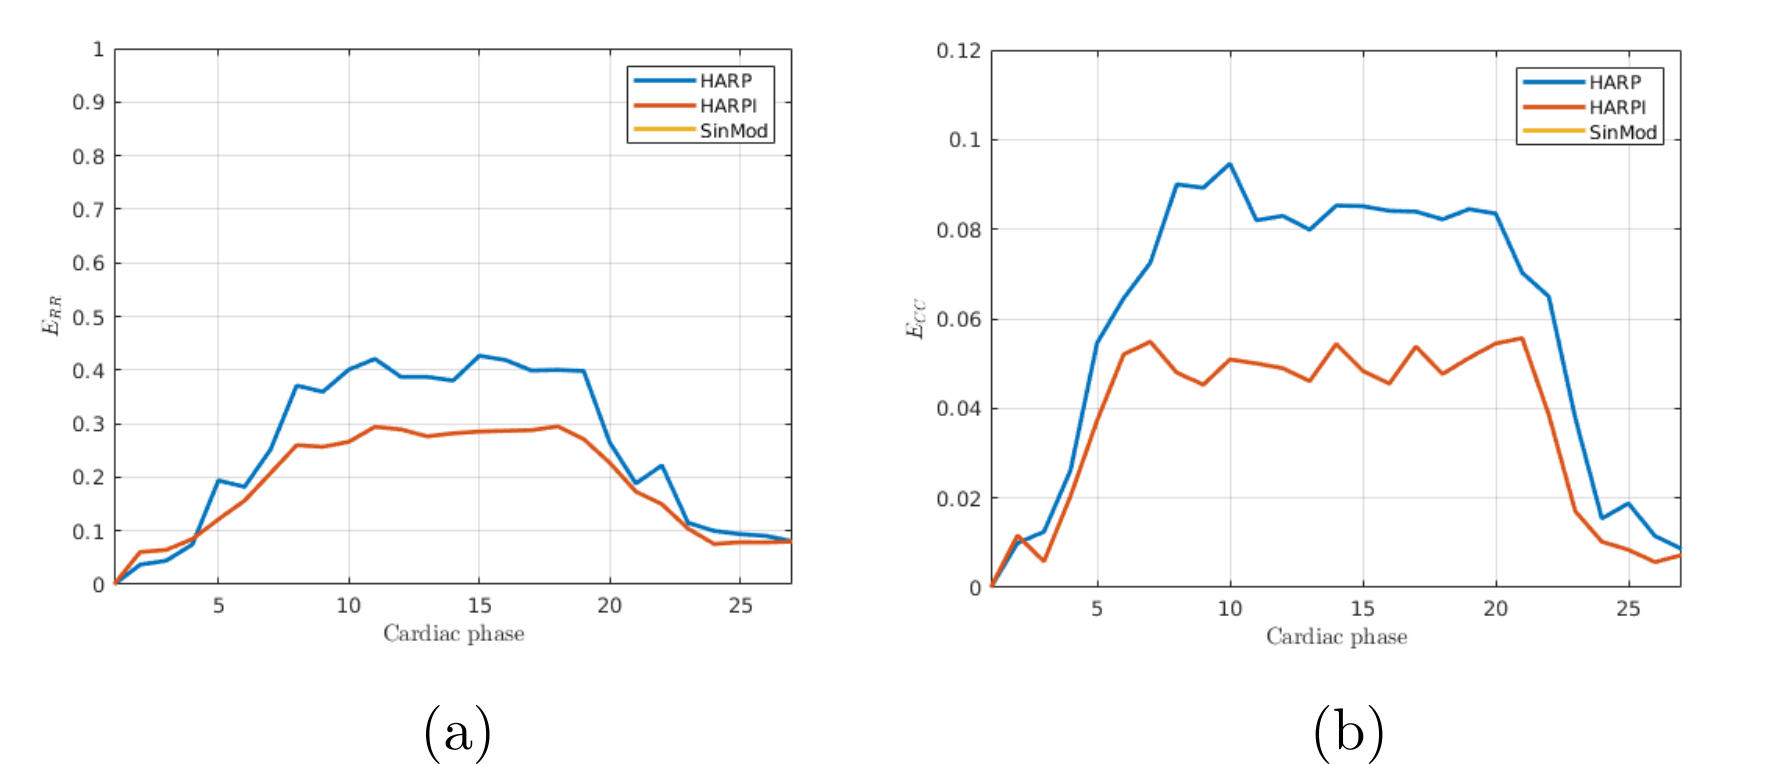
The radial and circumferential components of strain, estimated from the in-vitro are shown in figures 5 and 6.
Under the range of resolutions between 1 and 2 millimeters, HARP-I performs better than HARP and SinMod, with a low sensitivity to noise (Fig. 2). HARP-I does not over-estimates the circumferential component of strain at end-systole5 (Fig. 3), and reduces the high spatial variability (Fig. 5). By construction, our proposal does not depend on temporal resolution, and accurate results are found even with temporal undersampling.
Conclusion
We developed a harmonic phase method for the estimation of motion based on continuum mechanics principles. Our method seems to be reliable under several noise and resolution levels, and was tested on in-vitro data. However, further studies must be performed to validate our framework in volunteers and patients.Acknowledgements
This work has received funding from the projects FONDECYT #1181057 and CONICYT PIA-ACT1416, and the Millenium Science Initiative of the Ministry of Economy, Development, and Tourism, grant Nucleus for Cardiovascular Magnetic Resonance. Mella H. acknowledges the CONICYT scholarship #21170592 for doctoral studies. Sotelo J. thanks to FONDECYT Postdoctorado 2017 #3170737.
References
[1] N. F. Osman, E. R. McVeigh, and J. L. Prince, “Imaging heart motion using harmonic phase MRI,” IEEETransactions on Medical Imaging, vol. 19, no. 3, pp. 186–202, 2000.
[2] T. Arts, F. W. Prinzen, T. Delhaas, J. R. Milles, A. C. Rossi, and P. Clarysse, “Mapping displacement and deformation of the heart with local sine-wave modeling,” IEEE Transactions on Medical Imaging, vol. 29, no. 5, pp. 1114–1123, may 2010.
[3] A. D. Gilliam and F. H. Epstein, “Automated motion estimation for 2-D cine DENSE MRI,” IEEE Transactions on Medical Imaging, vol. 31, no. 9, pp. 1669–1681, 2012.
[4] C. Tobon-Gomez, M. De Craene, K. McLeod, L. Tautz, W. Shi, A. Hennemuth, A. Prakosa, H. Wang, G. Carr-White, S. Kapetanakis, A. Lutz, V. Rasche, T. Schaeffter, C. Butakoff, O. Friman, T. Mansi, M. Sermesant, X. Zhuang, S. Ourselin, H. O. Peitgen, X. Pennec, R. Razavi, D. Rueckert, A. F. Frangi, and K. S. Rhode, “Benchmarking framework for myocardial tracking and deformation algorithms: An open access database, ”Medical Image Analysis, vol. 17, no. 6, pp. 632–648, aug 2013
Figures