2165
Strain and Torsion Analysis of Left Ventricular Using Tissue Tracking to Evaluate Deterioration of Ventricular Function as MR Marker in Patients with Repaired Fontan1Shanghai children's medical center, Shanghai, China
Synopsis
At present, cardiovascular magnetic resonance (CMR) has emerged as the gold standard for the quantification of ventricular volume and ejection fraction in repaired Fontan patients [1]. However, left ventricle ejection fraction (LVEF) reflects the geometric change of LV, but not the contractile function of the myocardium [2]. Strain and torsion are new MRI markers to detect myocardial deformation using balanced steady state free precession (b-SSFP) cine imaging in CMR. Myocardial Strain has been shown as an earlier marker of contractile dysfunction than EF and a subclinical sign of heart muscle cells [3,4]. Torsion as a measurement of myocardial afterload, wall and fiber stresses is an important determinant of ventricular function and hypertrophy. Ventricular twist mechanics hold promise for better understanding mechanisms of ventricular dysfunction [5]. To best our acknowledge, There were much fewer data about the comparison between the prognostic value of perioperative NT-proBNP levels and MRI quantitative indexes in children after surgical repair of CHD. The study is to compare cardiac strains and torsion among the repaired Fontan patients with normal and abnormal NT- proBNP levels as well as healthy controls. We hypothesized that the global ventricular strain and torsion could be as MRI quantitative indexes for evaluation of deterioration of ventricular function in patients with repaired Fontan.
Purpose
The aim of the study is to evaluate the global left ventricular strain and torsion would deterioration of ventricular function as MR marker in patients with repaired Fontan.Methods
Continuous 28 repaired Fontan patients with suspected chronic heart failure (male/female 16/12) were retrospectively enrolled from June 2015 through October 2017 for the study. Patients need blood biochemical indexes (NT-proBNP) during a month of MRI examination. The exclusion criteria included: 1) Patients had interventional surgical in last six months were enlisted. 2) the presence of other diseases influencing NT-proBNP, such as abnormalities in glomerular filtration, pulmonary hypertension, valvular stenosis and so on. 3) Patients with inadequate image quality for imaging analysis and the morphologic right ventricle supports the systemic circulation were also excluded from this work. Thus, a total of 19 (male/female 13/6) participants were included in this study. Cardiac MR imaging was also performed in 17 (male/female 10/7) age- and sex-matched healthy volunteers who were no of cardiovascular disease by echocardiography.
All subjects underwent a routine clinical protocol performed with a 1.5T and scanner (Achieva, Philips Healthcare, Best, the Netherlands) that included steady-state free precession short-axis views and two- and four-chamber views covering left ventricle. The following MR imaging parameters were used: repetition time msec/echo time msec, 3.1/1.5; acquisition matrix, 288-320 * 288-320; flip angle, 60°; interslice gap 0 mm; section thickness, 6-7 mm. 20-23 phases per cardiac cycle were reconstructed.
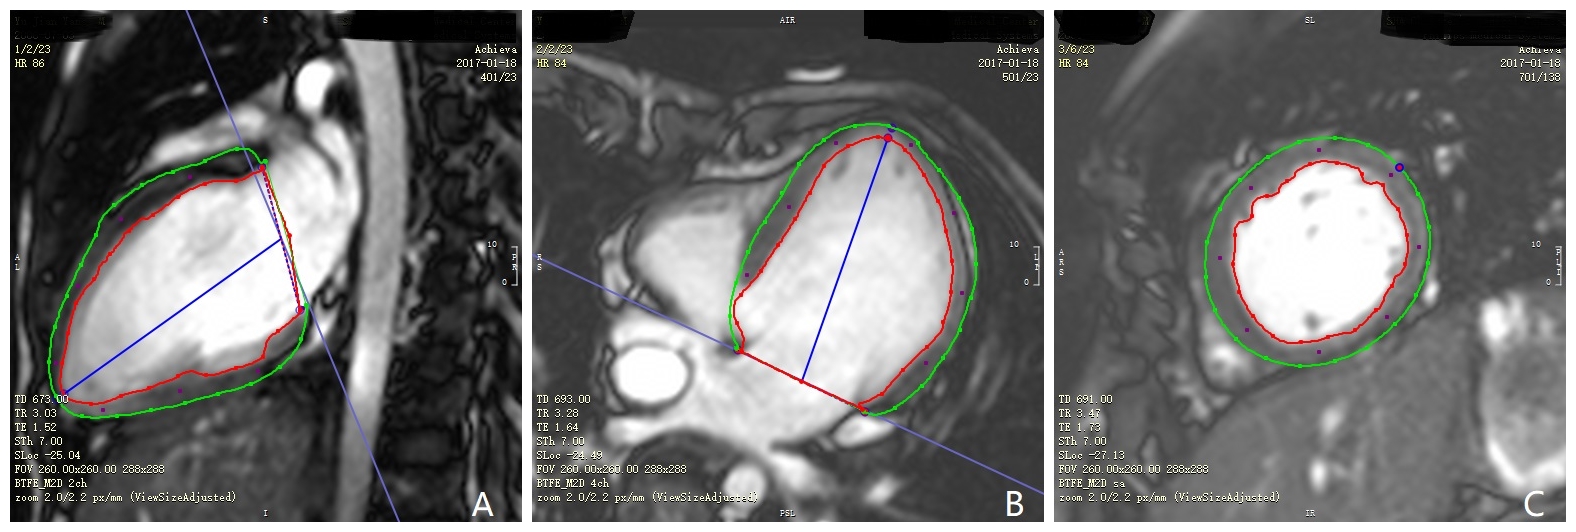
Global strains and global strains rate of the left ventricle were measured using a CMR-Tissue tracking(TT) with the same software. For short-axis image, endocardial and epicardial contours were manually drawn at end-diastolic and software automatically propagated the contours through another frames. For the two-chamber and four-chamber image, endocardial and epicardial contours were manually drawn at end-diastolic (Figure 1). Global strains were derived from the 1D Lagrangian strain calculation. We define torsion that basal clockwise rotation and apical clockwise rotation divided by the distance between apical and basal slices. We define torsion rate that basal rotational velocity and apical clockwise rotational velocity divided by the distance between apical and basal slices. Torsion and torsion rate were calculated by CVI42 software (Circle Cardiovascular Imaging, Calgary, Canada)[6].
Results
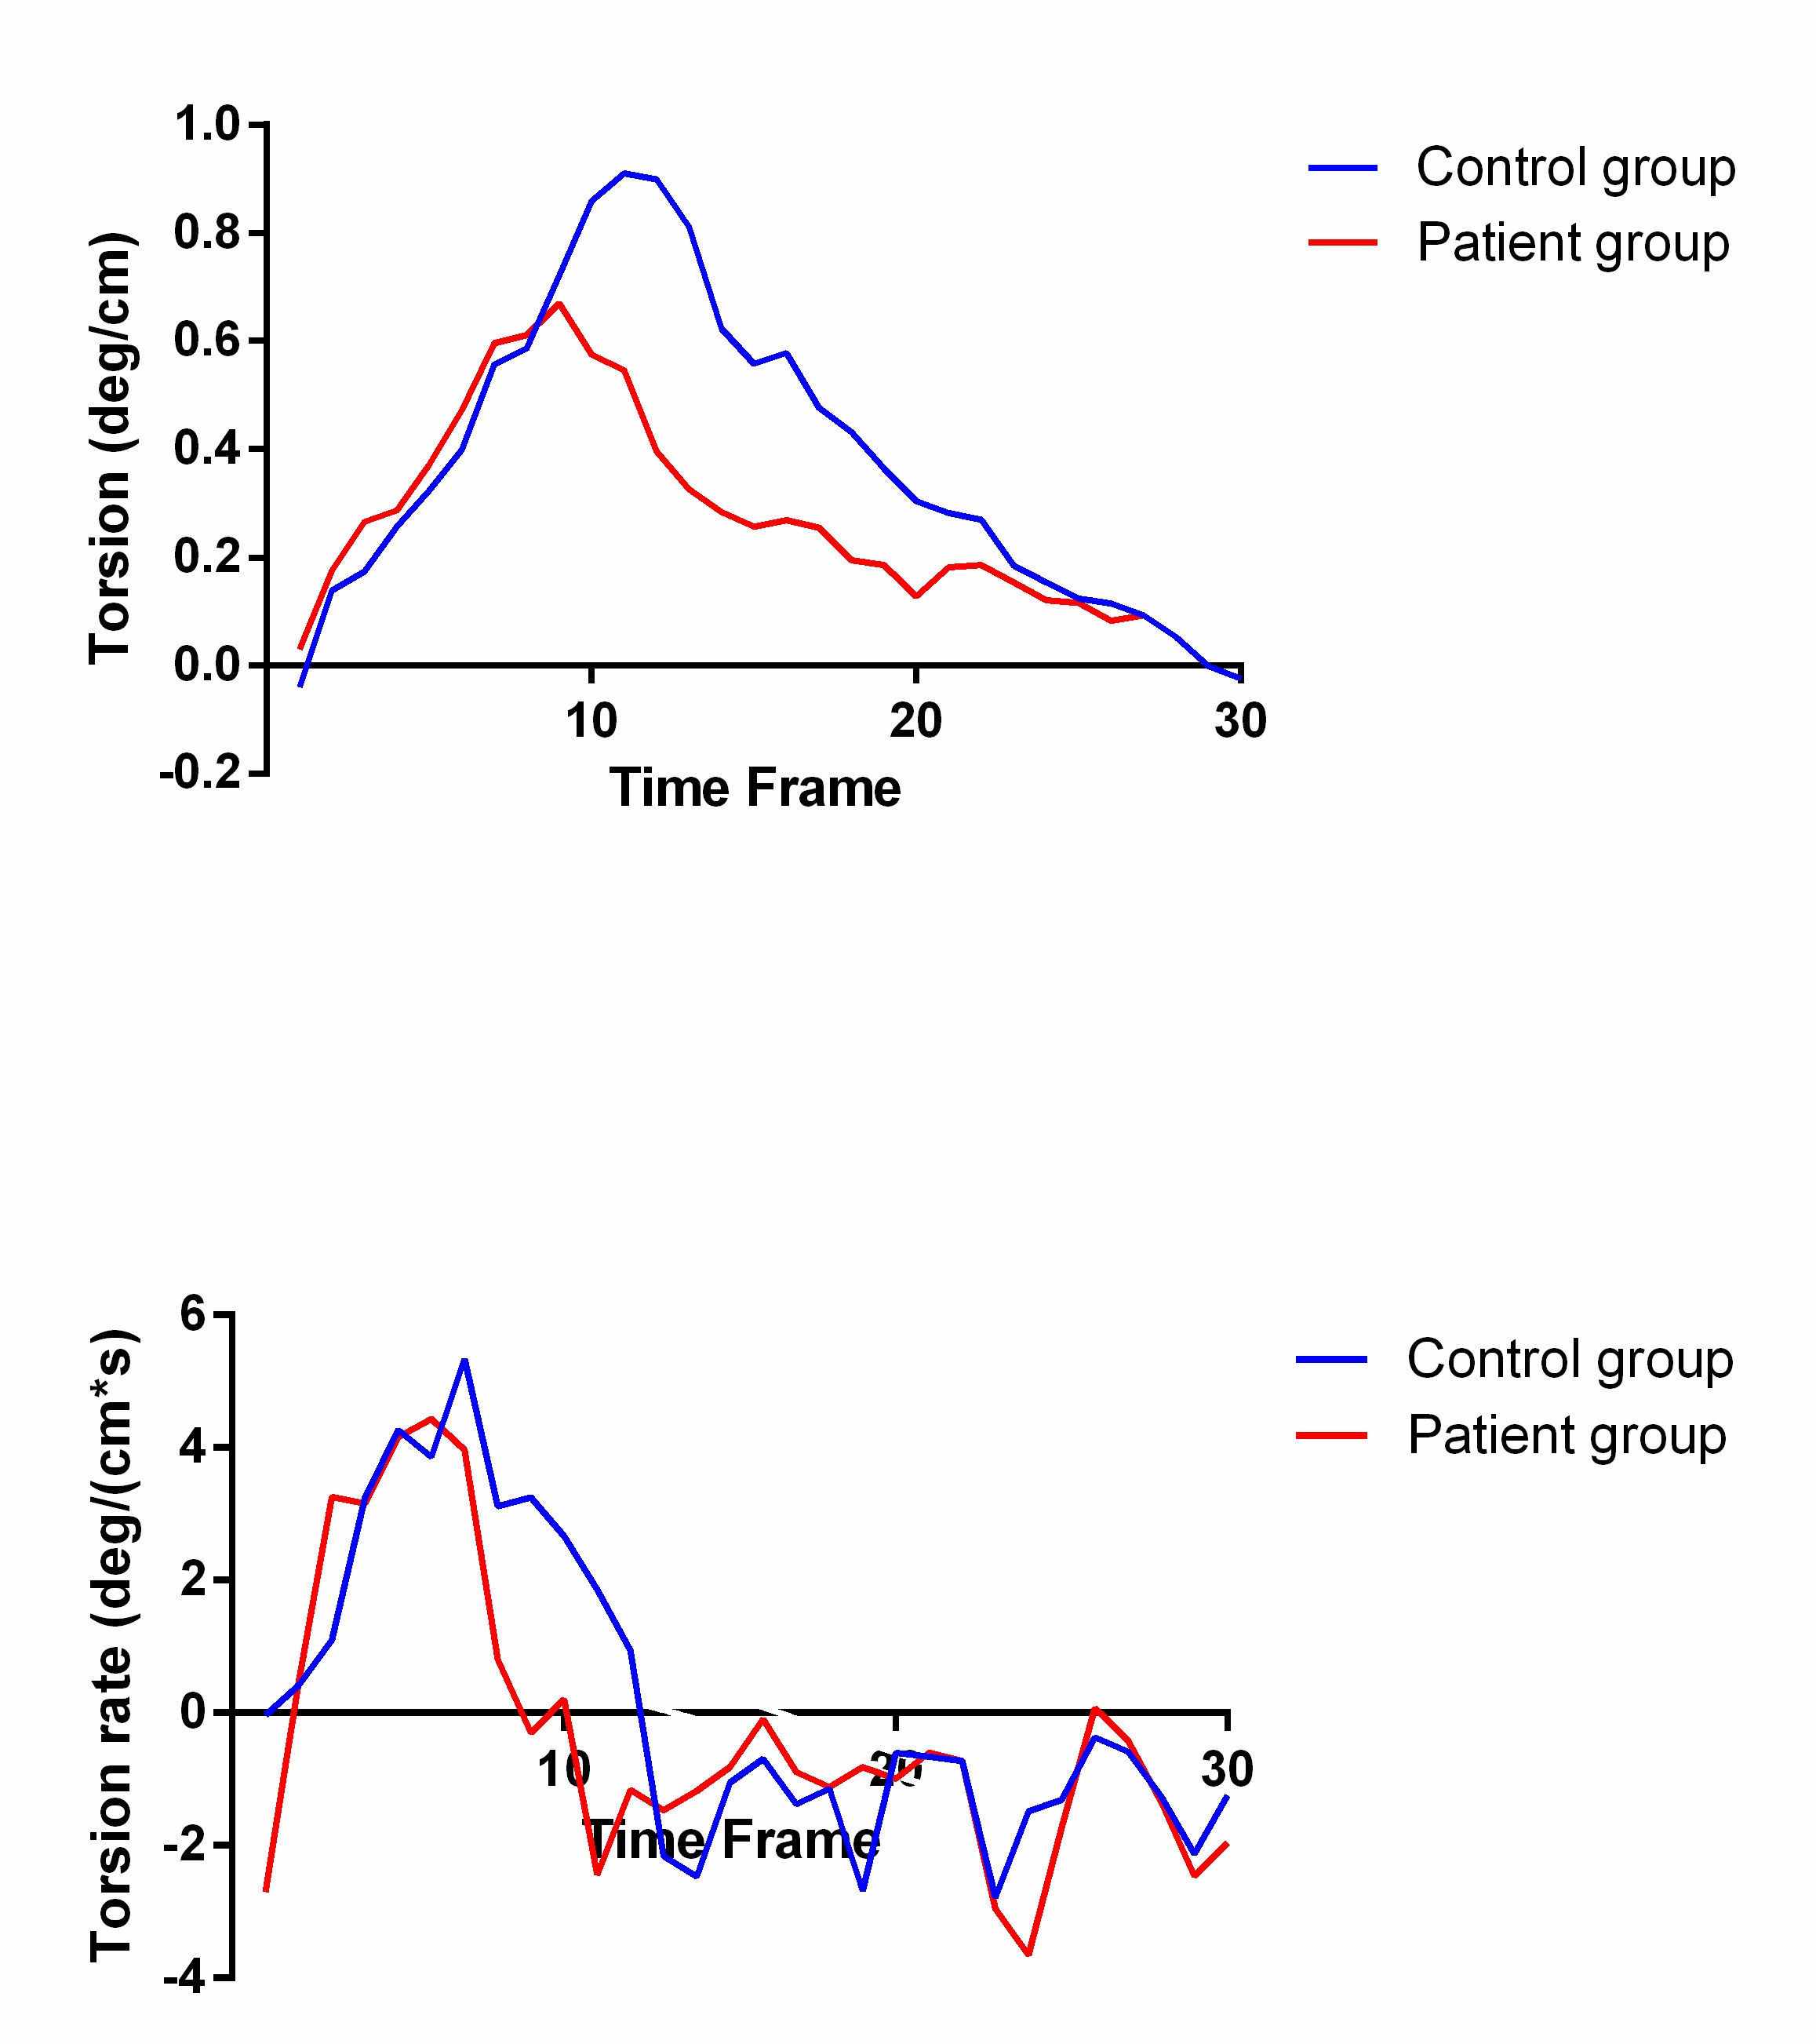
Global longitudinal strain (GLS) was significantly lower in repaired Fontan group than control group(-15.47±3.05 vs. -19.97±1.7; P<0.001). Global radial strain (GRS) was significantly lower in repaired Fontan group than control group(32.05±8.05 vs. 37.88±6.99; P=0.017). Peak systolic longitudinal strain rate and circumferential peak systolic circumferential strain rate were significantly lower in repaired Fontan group than control group. Peak systolic radial strain rate was significantly higher in repaired Fontan group than control group (Table 1). Peak systolic torsion and peak systolic torsion rate were lower in repaired Fontan group than control group(0.76±0.39 vs. 1.07±0.36, P=0.023; 7.87±3.28 vs. 9.85±2.61, P=0.044). The average peak systolic torsion of repaired Fontan patients was 0.66 deg/cm, compared with 0.91 deg/cm in the control group. The average peak torsion rate of repaired Fontan patients was still lower 4.22 deg/(cm*s) than 5.34 deg/(cm*s) in the control group (Figure 2).
The difference between repaired Fontan patients with abnormal NT-proBNP levels and healthy controls yields significance for the peak torsion (0.81±0.32 vs. 1.07±0.36; P<0.05). Global longitudinal strains differed significantly between three groups(-15.86±2.87 vs. -14.92±3.4 vs. -19.97±1.7; P<0.001). Global circumferential strains no differed significantly between three groups(-17.96±2.57 vs. -15.19±3.89 vs. -17.88±2.26; P>0.05)(Figure 3).
Conclusions
Acknowledgements
The authors appreciate Haitao You and Tongtong Han at the Circle Imaging Systems, Circle CVI Corporation Canada for the technical assistanceReferences
1. Schuster A, Hor K N, Kowallick J T, et al. Circulation Cardiovascular Imaging, 2016, 9(4):e004077.
2. Lamata P, Hussain S T, Kutty S, et al. Journal of Cardiovascular Magnetic Resonance, 2014, 16(1):1-2.
3. Truong U T, Li X, Broberg C S, et al. American Journal of Cardiology, 2010, 105(10):1465.
4. Sengupta P P, Tajik A J, Chandrasekaran K, et al. Jacc Cardiovascular Imaging, 2008, 1(3):366.
5. Yoneyama K, Venkatesh B A, Wu C O, et al. Journal of Cardiovascular Magnetic Resonance, 2018, 20(1):53.
6. Deal B J, Jacobs M L. Heart, 2012, 98(14):1098-104.
Figures