2162
Real-time strain encoding using echo planar imaging with centric reordering and parallel imaging1Davis Heart and Lung Research Institute, The Ohio State University, Columbus, OH, United States, 2Siemens Healthineers, Columbus, OH, United States
Synopsis
We developed a realtime strain encoding technique using EPI readout with centric reordering and parallel imaging acceleration. This technique was tested in a strain phantom and normal volunteers to measure through-plane left ventricular strain. Quantified strains correlated well with fully sampled k-space acquisitions. The proposed technique allows larger field-of-view (FOV) and provides superior coverage of both left (LV) and right ventricles (RV) while maintaining equivalent temporal and spatial resolution as the fully sampled sequence.
Introduction
Strain
encoding (SENC) is a method to directly measure myocardial contractility by
tagging through-plane and detecting contraction and stretching over the cardiac
cycle1. In real-time SENC,
temporal resolution limits the number of k-space lines that can be be acquired,
limiting phase encoding (PE) FOV and/or spatial resolution. Furthermore, spatial
aliasing causes uniquely problematic artifacts in SENC2. A selective
tagging pulse can be used to avoid wrap. However, the imperfect profile of the
selective tagging pulse requires acquisition of a larger PE FOV than the
selective tag width to avoid residual wrap; this results in significant outer
portions of the FOV being unusable due to signal loss. As a consequence, it may
be impossible to cover both cardiac ventricles while maintaining adequate
spatial and temporal resolution in a real-time acquisition. In this work, we
propose a real-time SENC technique that uses a two-echo-train EPI readout with
centric reordering combined with parallel imaging to accelerate image
acquisition. The goal is to use the increased scan efficiency to expand the PE FOV
without sacrificing temporal or spatial resolution, enabling sufficient
coverage of the anatomical structures of interest.Methods
A prototype real-time SENC pulse sequence was implemented on a 1.5T clinical scanner using EPI readout with centric reordering (MAGNETOM Avanto, Siemens Healthineers, Germany). Two echo trains each with echo-train-length 17 (total 34 acquired k-lines) were used to acquire each frame (Figure 1). GRAPPA acceleration with 16 integrated reference lines was combined with EPI readout to accelerate data acquisition. In each echo train, the first 8 lines in central k-space are fully sampled for kernel estimation; the remaining 9 outer k-lines are 2x under-sampled. As a result, 34 acquired lines are used to reconstruct 52 lines, for an effective acceleration rate of ~1.6. For comparison, fully sampled SENC images were also acquired with common scanning parameters including: temporal resolution 29 ms, voxel size 4.7x4.7x12 mm, FA 120, fat saturation, EPI factor 17, two shots, and receiver bandwidth 1929 Hz/pix. GRAPPA acceleration was used to increase the imaging matrix (96x52) and PE FOV (450x243 mm2) by ~1.6 times compared to fully sampled SENC acquisition (imaging matrix 96x34 and FOV 450x160 mm2) without sacrificing spatial or temporal resolution. The FOV was positioned for full coverage of the LV in both scans for comparison purposes.
A silicone strain phantom compressed by a pneumatic pump was used to assess the GRAPPA accelerated EPI SENC technique. Additionally, five healthy volunteers were scanned in six cardiac views (2CH, 3CH, and 4CH long axis views, and apical, mid-ventricular, and basal short axis). Images with fully sampled centric EPI trajectory were collected at the same location for comparison. All images were analyzed using MyoStrain 5.0 (MyoCardial Solutions, NC, USA) software to calculate global and segmental peak strain values.
Results
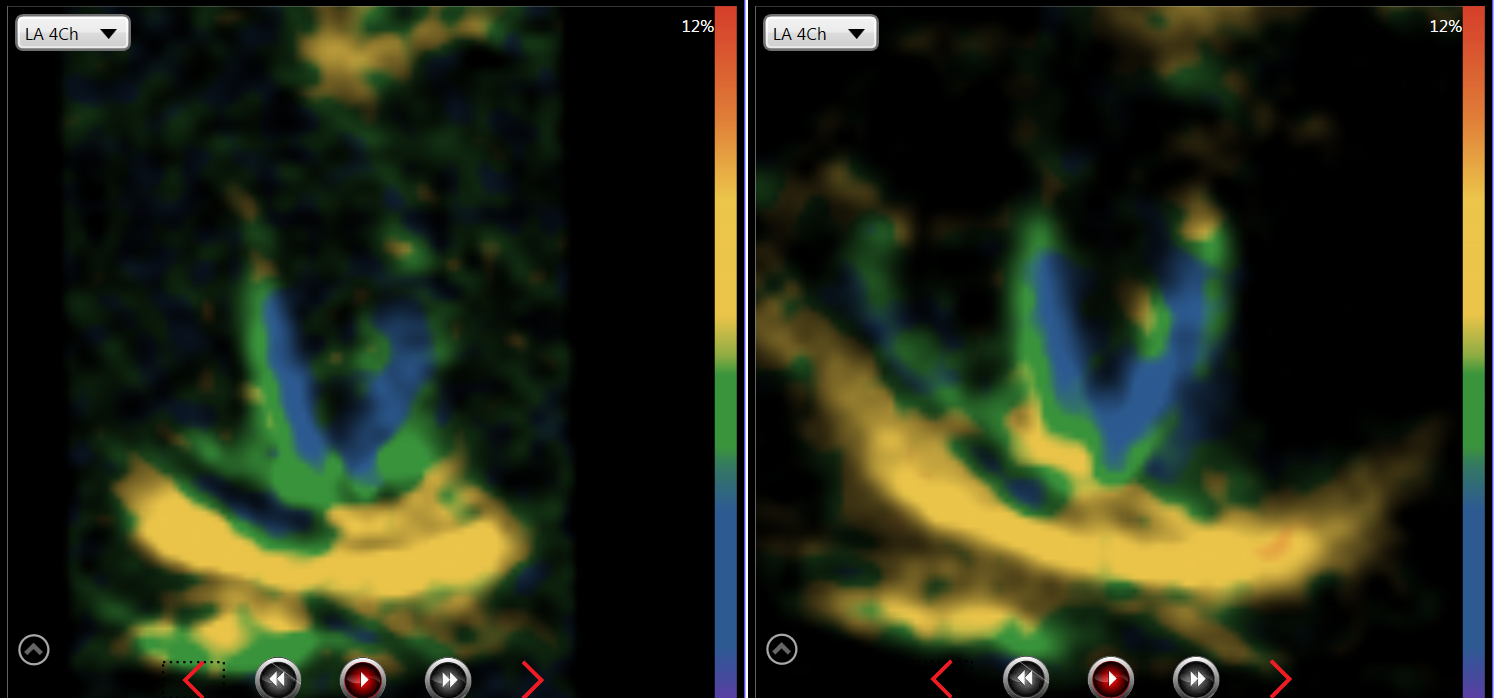
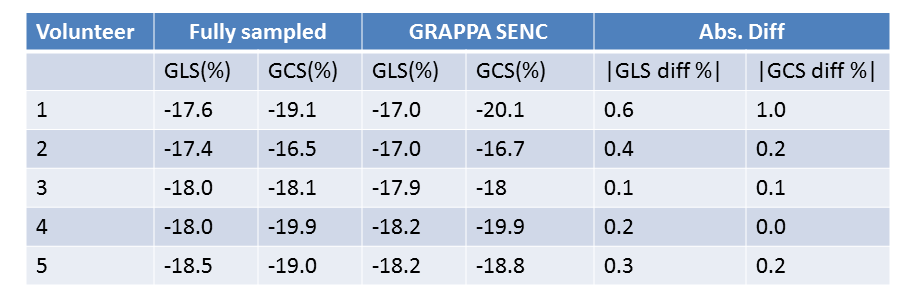
GRAPPA accelerated and fully sampled EPI SENC measured peak strains of -19.7% and -21.4% respectively in the phantom with known strain of -20.0%. Figure 2 shows the need for expanding FOV in a 4-chamber view to cover both the right and left ventricles. GLS and GCS measured in 5 volunteers with GRAPPA SENC are shown in Figure 3 and compared with fully sampled SENC. Linear regression and Bland-Altman plots of segmental strains (16 longitudinal segments and 21 circumferential segments in each volunteer) are shown in Figures 4 and 5.
Across the five volunteers, global longitudinal (GLS) and global circumferential strains (GCS) demonstrated reasonable agreement between the two techniques without significant bias. Maximum absolute strain difference was 1.0%; mean GLS difference was 0.2% and mean GCS difference 0.2%. Segmental strain showed good correlation as well, with regression coefficients of 1.07 for longitudinal and 0.97 for circumferential strain, respectively. Although the mean difference was near zero (0.02% and 0.24%), segmental strains showed greater variation than the global strains, with 1.96 SD being at 5.0% and -5.1% circumferentially, and 3.0% and -2.5% longitudinally.
Discussion
The centric EPI trajectory synergistically combines with parallel
imaging to provide a k-space trajectory that rivals segmented-spiral in
efficiency. Compared to fully sampled SENC imaging, GRAPPA acceleration
supports an expanded PE FOV and ensures sufficient coverage of both the left and
right ventricles. Segmental strain measurements show greater disparity, possibly
due to variability in fiducial point selection (RV insertion points) and endo-
and epi-cardial contours that are required for strain quantification.Further
study is required to determine the impact on RV strain quantification, which
may be important in pulmonary hypertension and other diseases.Conclusions
Real-time GRAPPA EPI-SENC can measure the global strain
accurately with expanded FOV, without sacrificing temporal and spatial
resolution.Acknowledgements
No acknowledgement found.References
1. Osman, Nael F., et al. "Imaging longitudinal cardiac strain on short‐axis images using strain‐encoded MRI." Magnetic Resonance in Medicine: An Official Journal of the International Society for Magnetic Resonance in Medicine 46.2 (2001): 324-334.
2. Pan, Li, et al. "Real‐time imaging of regional myocardial function using fast‐SENC." Magnetic Resonance in Medicine: An Official Journal of the International Society for Magnetic Resonance in Medicine 55.2 (2006): 386-395.
Figures