2153
Incremental value of cardiac deformation analysis in Fulminant Myocarditis: a cardiovascular magnetic resonance imaging study1Radiology, Tongji Hospital, Tongji Medical College, Huazhong University of Science and Technology, Wuhan, China, Wuhan, China, 2Tongji Hospital, Tongji Medical College, Huazhong University of Science and Technology, Wuhan, China, Wuhan, China
Synopsis
Newer quantitative myocardial T1 and T2 mapping and feature-tracking (FT) myocardial strain analysis might add additional diagnostic information and further broaden the diagnostic targets. This study demonstrate that the assessment of cardiac strains applying FT on standard cine images is feasible in patients with fulminant myocarditis. And Cardiac strains parameters, especially, global peak systolic circumferential and longitudinal strain are significantly impaired in patients with FM. Myocardial strain metrics can sufficiently discriminate between FM and NFAM patients and show basic associations with the extent of myocardial inflammation.
Introduction
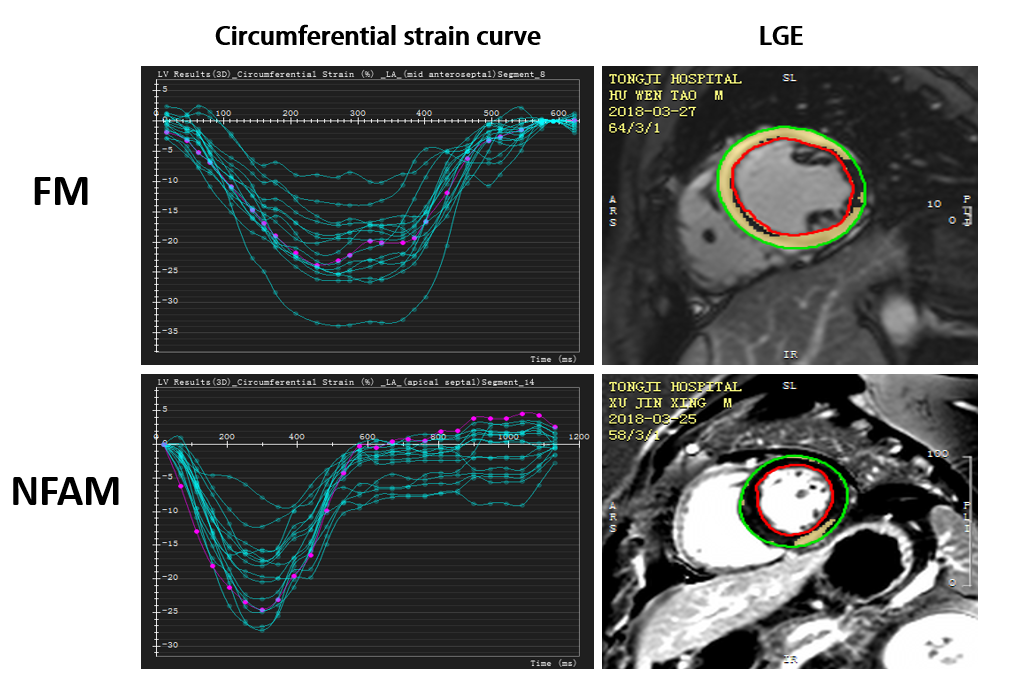
Fulminant myocarditis is an inflammatory process that progresses dramatically from a febrile respiratory syndrome to cardiogenic shock. Few studies have reported the CMR presentation of fulminant myocarditis.1 Newer quantitative myocardial T1 and T2 mapping can assess diffuse myocardial inflammation and FT technique allows for quantitative segmental and global myocardial strain analysis (Fig. 1) based on routinely acquired cine CMR images.2 Such functional markers might add additional diagnostic information and further broaden the diagnostic targets. The purpose of this study was to evaluate the diagnostic value of cardiac magnetic resonance (CMR) feature-tracking (FT) myocardial strain analysis in patients with fulminant myocarditis and its association with myocardial edema.Materials and Methods
A total of 18 patients with Fulminant Myocarditis(FM)and 19 patients with non- Fulminant acute Myocarditis(NFAM)underwent a comprehensive CMR protocol at 3.0T MR. Cardiac MR imaging approaches included late gadolinium enhancement, native T1 mapping, T2 mapping and extracellular volume fraction. FT CMR analysis of systolic longitudinal (LS), circumferential (CS) and radial strain (RS) was performed. Receiver operating characteristic analysis was performed to compare diagnostic performance.Results
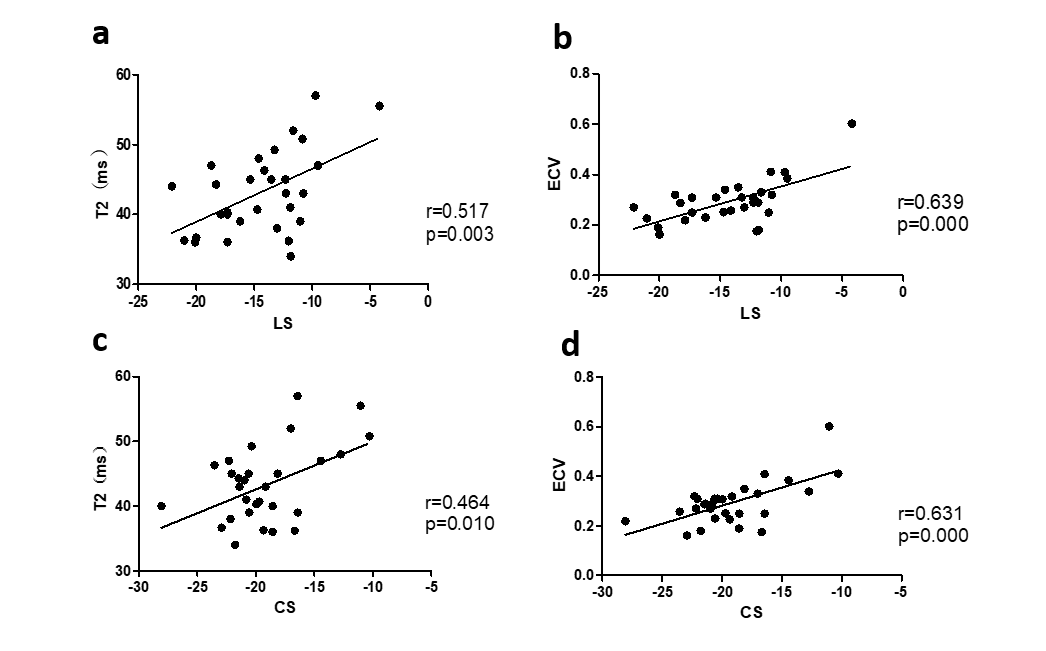
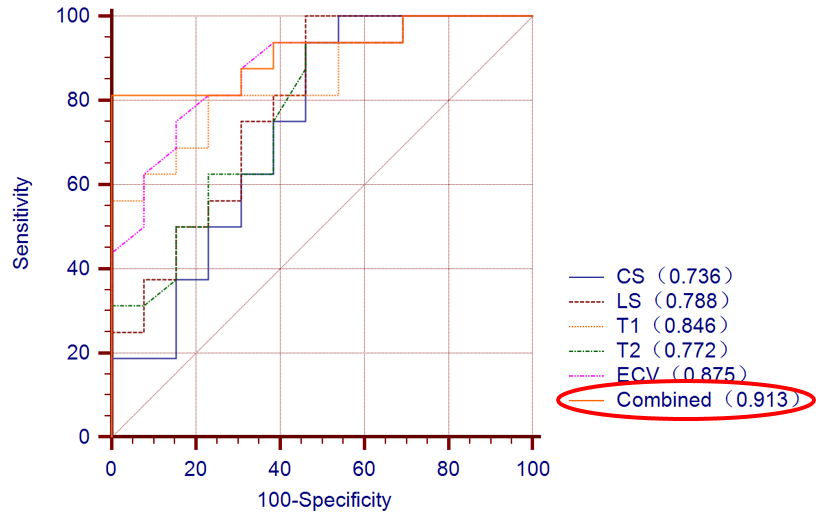
When compared with NFAM, FM patients demonstrated reduced CS and LS values (LS: -12.23 ± 3.74% vs. -16.11 ± .44%, CS: -17.24 ± 4.14% vs. -20.71 ±2.62%, P < 0.05, respectively). LS (ECV: r = 0.639, P < 0.001; T2: r = 0.517, P < 0.05) and CS (ECV: r = 0.631, P < 0.001; T2: r = 0.464, P < 0.05) showed the strongest correlations with ECV and T2 relaxations times (Fig. 2). The extent of LGE in patients did not correlate to their respective strains. Regarding the differentiation between FM and NFAM patients, the addition of global strain parameters to native T1, ECV and T2 enhanced the diagnostic performance in such patients (AUC=0.913) (Fig. 3).Discussion and conclusion
In this study, the preliminary data from our study demonstrate that the assessment of cardiac strains applying FT on standard cine images is feasible in patients with fulminant myocarditis. And Cardiac strains parameters, especially, global peak systolic circumferential and longitudinal strain are significantly impaired in patients with FM. Myocardial strain metrics can sufficiently discriminate between FM and NFAM patients and show basic associations with the extent of myocardial inflammation.Acknowledgements
No acknowledgement found.References
1 Takeuchi I, Imaki R, Inomata T, Soma K, Izumi T. MRI is useful for diagnosis of H1N1 fulminant myocarditis. CIRC J. 2010; 74: 2758-2759.
2 Luetkens JA, Homsi R, Sprinkart AM, et al.. Incremental value of quantitative CMR including parametric mapping for the diagnosis of acute myocarditis. Eur Heart J Cardiovasc Imaging. 2016; 17: 154-161.
Figures