2148
Inline Myocardial Perfusion flow mapping and Analysis: Powered by Gadgetron Inline AI1National Heart, Lung and Blood Institute, National Institutes of Health, Bethesda, MD, United States, 2National Amyloidosis Centre, RoyalFree Hospital, London, United Kingdom, 3Barts Heart Centre, London, United Kingdom
Synopsis
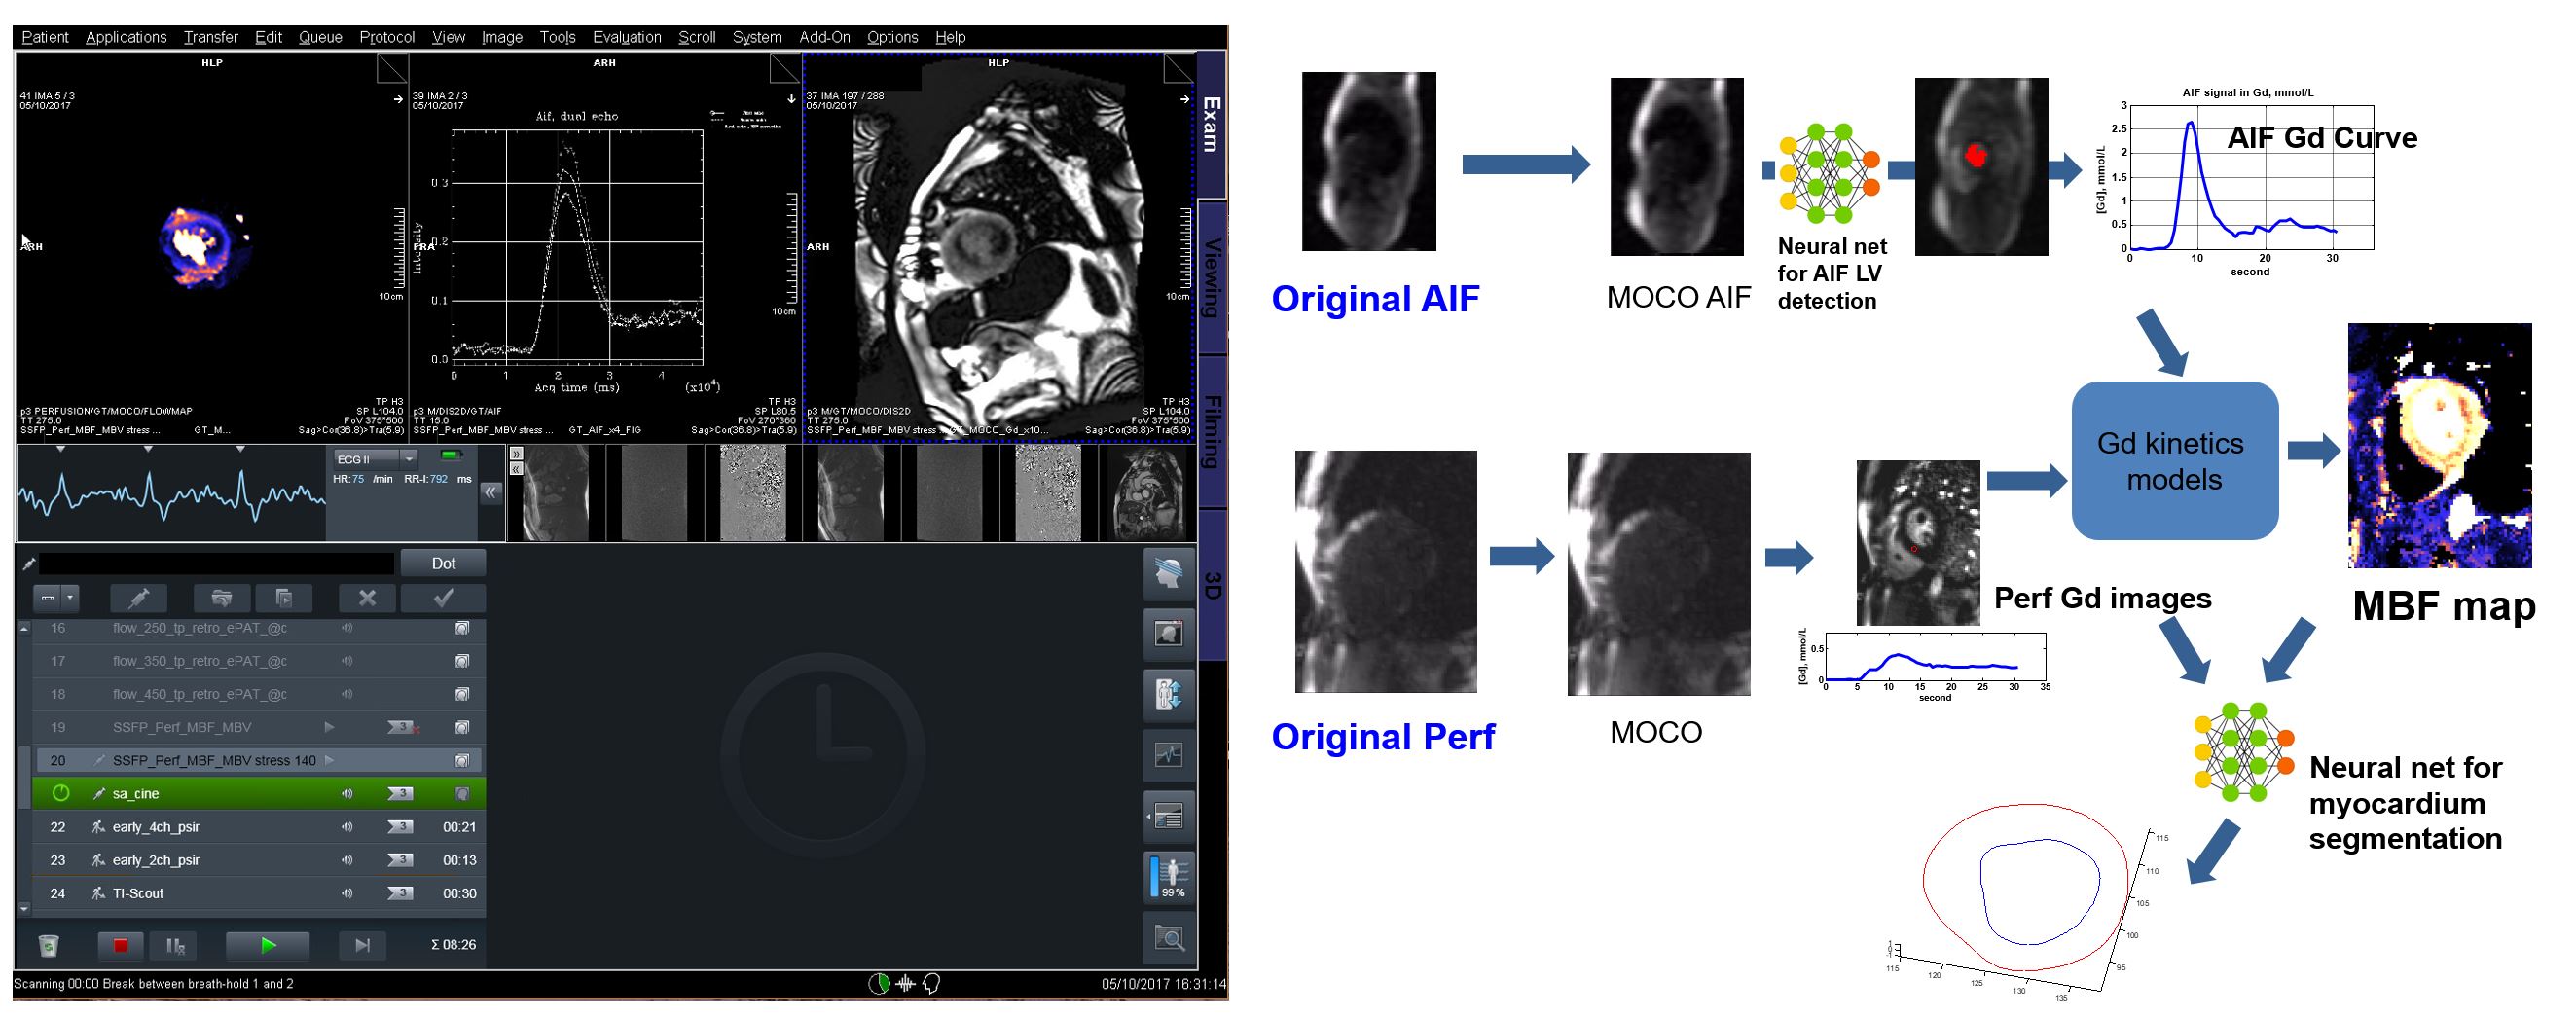
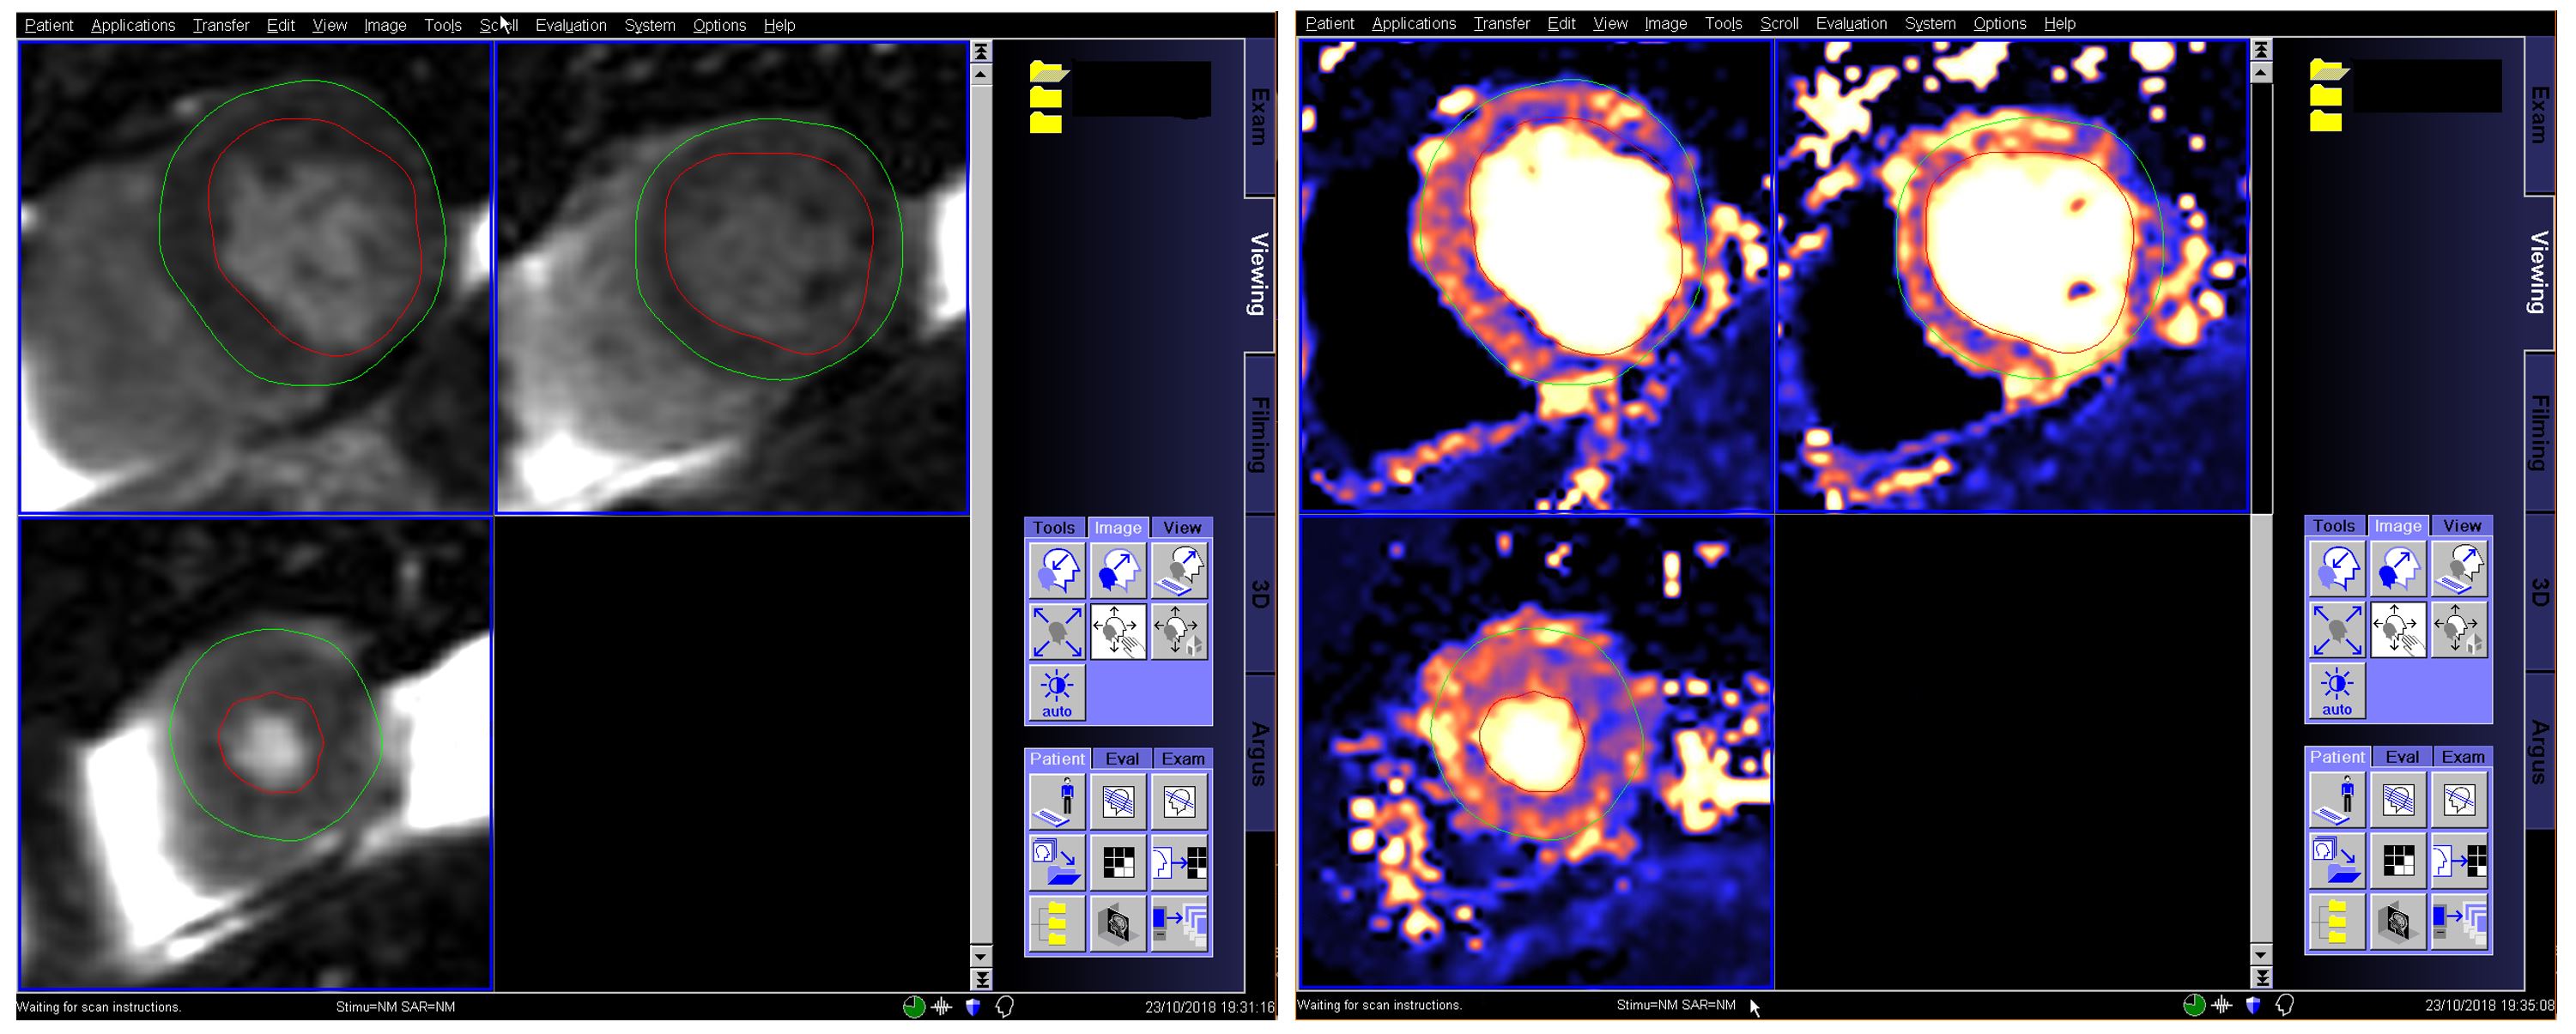
This abstract presents an AI powered system to perform automated quantitative perfusion flow mapping and analysis on the MR scanner. The key components consist of deep neural network models to a) detect LV on AIF image series and b) segment myocardium to generate AHA bull's eye plot. This solution was implemented in Gadgetron framework and has been deployed to clinical MR scanners. As a result, pixel-wise perfusion flow maps with segmentation of myocardium is automatically generated and available on the MR scanner shortly after the end of data acquisition.
Purpose
Quantitative myocardial perfusion flow mapping shows great potential to improve diagnosis of ischemic coronary disease for being objective and more sensitive to detection global flow reduction. Our recent in-line perfusion flow mapping [1] allows free-breathing acquisition and automatically computes pixel-wise perfusion flow maps. This solution was implemented in Gadgetron framework [2,3] and has been deployed to clinical MR scanners. With the Artificial intelligence, especially deep-learning based algorithms, showing great potential for imaging computing and analysis, we further strength the inline perfusion mapping workflow by incorporating AI models to: a) improve LV detection to measure arterial input function (AIF) and b) enable myocardium segmentation and detection of RV insertion point. As a result, AHA bull's eye plot can be automatically generated and sent back to scanner host for pixel-wise myocardial flow mapping.Method
ResUnet [4] architecture was modified to allow flexible number of ResNet modules and different output layers. It was implemented using PyTorch [5] for perfusion analysis. For the AIF detection, one model was trained on N=15725 perfusion scans [6] from St. Bartholomew Hospital (6957 patients), and Royal Free Hospital (1290 patients), London, UK. Since only LV is required for AIF measurement, the neural network was constrained for binary segmentation. The labelled data was first generated using an ad-hoc LV segmentation algorithm [1] and further manually corrected if needed. For the perfusion myocardium segmentation, the second model was trained for hybrid detection of LV, myocardium, and RV insertion point. The model was trained on N=426 perfusion scans from Royal Free Hospital London, UK. An expert manually delineated endo and epi boundary of myocardium and labelled RV insertion points. Both models received perfusion time series as input after motion correction. Both trained neural net models were integrated into Gadgetron inline perfusion flow mapping solution. To deploy these models on MR scanners, recently proposed Gadgetron InlineAI modules [7] were used. In this scheme, user supply python functions to load and apply AI models. Gadgetron allows to read in and execute these functions on incoming MR data. After the model inference, the resulting AIF LV blood pool masks and perfusion endo/epi contours were sent back to Gadgetron runtime environment. This Inline AI integration is seamless for end-user, in the sense that perfusion flow maps with segmentation and AHA bull's eye plot were sent back to scanner without any user interaction. Patient studies were conducted at the Barts Heart Centre and Royal Free Hospital, London, UK. This study was approved by the local Ethics Committees at both hospitals and written informed consent for research was obtained for all subjects. Anonymized data were also approval by the NIH Office of Human Subjects Research OHSR (Exemption #13156).Results
This inline solution was deployed to clinical MR scanners and enabled fully automated perfusion flow mapping and analysis using deep neural net models. Typical model loading took 100ms for perfusion AIF detection and 120ms for perfusion segmentation. The model inference took ~90ms for perfusion AIF detection and 800ms for segmentation on one whole short-axis slice.Conclusion
An inline perfusion flow mapping and analysis solution was developed using Gadgetron InlineAI and deployed to clinical MR scanners. This solution allows pixel-wise perfusion mapping on free-breathing acquisition and generate AHA bull's eye plot on the scanner.Acknowledgements
No acknowledgement found.References
[1] Kellman P., Xue H. et al. Myocardial perfusion cardiovascular magnetic resonance: optimized dual sequence and reconstruction for quantification. JCMR 19 (1), 43.
[2] Hansen MS, et al. Gadgetron: An Open Source Framework for Medical Image Reconstruction. MRM, 69(6), 2013.
[3] Xue H, et al. Distributed MRI Reconstruction Using Gadgetron-Based Cloud Computing. MRM, 73(3), 2015.
[4] Zhang Z. et al. Road extraction by deep residual u-net. IEEE Geoscience and Remote Sensing Letters, 2018.
[5] Paszke, Adam. Automatic differentiation in PyTorch. NIPS 2017.
[6] Tseng E., Kellman P., Xue H. et al. Automated detection of the Left Ventricle for Arterial Input Function in Myocardial Perfusion using CNN on 15725 Scans. ISMRM Machine Learning workshop, part 2, 2018.
[7] Xue H., Kellman P. et al. Gadgetron Inline AI: Effective Model inference on MR scanner. Submitted to ISMRM 2019, abstract 7020.
Figures