2146
Myocardial permeability mapping analysis framework with an optimized Residual Complexity based registration1IADI, INSERM U1254, Université de Lorraine, Nancy, France, 2CIC-IT 1433, INSERM, Université de Lorraine and CHRU Nancy, Nancy, France, 3Pôle Imagerie, CHRU Nancy, Nancy, France, 4Pôle Cardiologie, CHRU Nancy, Nancy, France
Synopsis
Myocardial perfusion data registration is challenging because of the inherent contrast variation in addition to cardiac and respiratory motions. Residual Complexity (RC) has been proposed as a new intensity based similarity measure for registration and has been reported to be more robust to contrast variation compared to other minimization indicators. In this work, we proposed a myocardial permeability maps framework with an optimization of a RC-based registration algorithm. We evaluated the performance of this algorithm, in comparison with MOCO and with no correction, on image quality and permeability maps.
Introduction
Myocardial permeability mapping requires rigorous care of critical steps which are: Dynamic Contrast Enhancement (DCE) data registration, T1 map registration with DCE data and Arterial Input Function (AIF) calculation. One of the most challenging part is the DCE data registration mainly due to contrast variation in addition to respiratory and cardiac motions from one image to another. MOCO solution is now widely available for first-pass data registration1 but other registration algorithm such as Residual Complexity (RC) based algorithm have been proposed and proved their robustness to contrast variation2. This RC-based algorithm has been used on bowel DCE-data3 but, to our knowledge, it has not been studied on cardiac DCE data. We proposed a myocardial permeability maps framework with the optimization of an RC-based registration algorithm (RC-REG). We compared image quality and permeability parameter values of our solution to the ones obtained with MOCO correction and without registration (Raw). Then, we evaluated the feasibility of a shorter CMR protocol for the estimation of the extracellular volume fraction with Ve estimation from our permeability maps analysis compared to ECV calculation4 from native and post T1 maps.Methods
Acquisition: The workflow was tested on 7 subjects with mitral valve prolapse with no symptoms extracted from the STAMP study (NCT02879825). The CMR protocol was performed on a Siemens PRISMA 3T scanner (Erlangen, Germany). T1 maps were acquired with single-shot MOLLI set for 8 TI samples (5(1)3) (TR/TE: 283/1.12ms, Matrix: 256x220). A 0.15mmol/kg bolus of Dotarem® (Guerbet, France) was injected few seconds after the beginning of the dynamic. One to two short axis 8mm DCE-MRI slices were acquired during at least 120 seconds in free breathing with an SR-TurboFLASH sequence (TS: 95ms, TR/TE: 116/0.97ms, Matrix: 160x116). Post-T1 maps were acquired at least 15min after injection and ECV maps were calculated with individual measured values of hematocrit.
Framework and analysis parts have been processed using MatlabR2017a (The MathWorks, USA).
Framework: The main workflow (figure 1) consists in: A/ registration of DCE-MRI images (detailed description in figure 2), B/ registration of the T1 map with the registered DCE-MRI data C/ DCE series and T1 map cropping into “heart cropped” picture D/ extraction and correction of the AIF E/ conversion of DCE images from signal intensity into Contrast Agent concentration F/ calculation of permeability maps using pixel-wise fitting Extended Tofts model5.
Analysis: We compared the three groups image quality and parametric maps values. Registration image quality was assessed qualitatively by extracting LV slice profiles and quantitatively by measuring Structure Similarity (SSIM) and Mutual Information score (MuInf) between two consecutive dynamic full frame and cropped images. Permeability parameters and ECV values were extracted with manual LV wall segmentation in an AHA segment fashion from respective maps. These image quality scores and parametric maps values were averaged±SD per group and compared with a one way ANOVA test.
Results
Figure 2.a shows an example of slice profiles of the three groups. Artifacts present on the Raw DCE profile are absent on RC-REG and MOCO corrected profiles. Although, MOCO DCE profile is polluted by distortion, especially on the inferolateral region. All SSIM and MuInf scores of the three groups are statistically different from each other (p<0.05, figure 2.b). RC-REG DCE group SSIM and MuInf scores were higher compare to the other groups for full frame and heart cropped pictures (between 5.5% and 14.9% and between 126% and 243% respectively). Better image quality for permeability maps of the RC-REG group is illustrated on figure 3 and by low permeability parameters SD values (table 1). Eventually, only MOCO maps are providing statistically different (p<0.05) Vp, Ve measurements compared to values extracted from RC-REG,Raw maps and ECV values (table 1).Discussion and conclusion
RC-REG algorithm shows better registration performance than MOCO in terms of quantitative and qualitative image quality indicators. Ktrans parameters measurements of RC-REG maps seem to be in good agreement with reported Ktrans measures extracted from ROI6. Ve estimation appears more sensitive to the registration strategy. Indeed, myocardial distortion induced by the MOCO algorithm could have led to bad fitting and eventually, incoherent Ve values. These results and particularly Ve values could give an asset to shorter protocol in the evaluation of ECV, which has to be confirm with supplementary patients data. In future work, other perfusion registration strategies such the recent work of Benovoy et al. for first pass registration7 will be confronted to our solution and diffuse fibrosis diagnostic power of permeability maps will be investigated.Acknowledgements
This work was supported by a Public fund managed by the “Agence Nationale de la Recherche” for the “Investissement d’avenir” program: ANR-15-RHU-0004.References
1 S. M. Shanbhag et al., “Image quality and diagnostic accuracy of inline motion-corrected (moco) first-pass stress myocardial perfusion images,” J Cardiovasc Magn Reson, vol. 13, no. Suppl 1, p. O12, Feb. 2011.
2 A. Myronenko and X. Song, “Intensity-Based Image Registration by Minimizing Residual Complexity,” IEEE Transactions on Medical Imaging, vol. 29, no. 11, pp. 1882–1891, Nov. 2010.
3 V. Hamy et al., “Respiratory motion correction in dynamic MRI using robust data decomposition registration – Application to DCE-MRI,” Medical Image Analysis, vol. 18, no. 2, pp. 301–313, Feb. 2014.
4 M. Ugander et al., “Extracellular volume imaging by magnetic resonance imaging provides insights into overt and sub-clinical myocardial pathology,” Eur Heart J, vol. 33, no. 10, pp. 1268–1278, May 2012.
5 S. P. Sourbron and D. L. Buckley, “On the scope and interpretation of the Tofts models for DCE-MRI,” Magnetic Resonance in Medicine, vol. 66, no. 3, pp. 735–745, Sep. 2011.
6 B. Pontré et al., “An Open Benchmark Challenge for Motion Correction of Myocardial Perfusion MRI,” IEEE Journal of Biomedical and Health Informatics, vol. 21, no. 5, pp. 1315–1326, Sep. 2017.
7 M. Benovoy, M. Jacobs, F. Cheriet, N. Dahdah, A. E. Arai, and L.-Y. Hsu, “A Robust Universal Nonrigid Motion Correction Framework for First-Pass Cardiac Magnetic Resonance Perfusion Imaging,” J Magn Reson Imaging, vol. 46, no. 4, pp. 1060–1072, Oct. 2017.
Figures

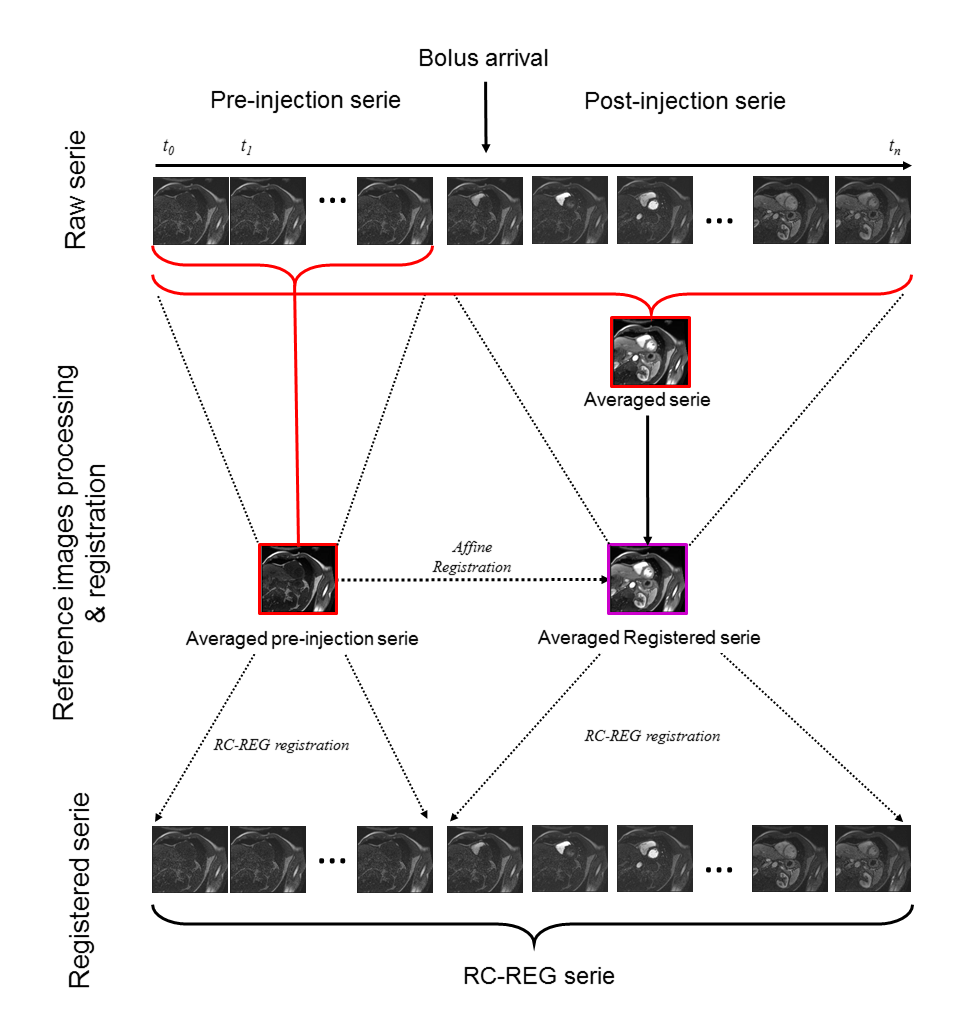
Figure 2: RC-REG registration process.The RC-REG
registration process consists in an automatic recognition of bolus arrival in
the right ventricle (RV) in order to split the DCE raw serie in pre-bolus and
post-bolus series. Pre-bolus averaged serie will be used as a reference for RC
registration of pre-bolus images and affine registration of the averaged whole
serie. This image will be used as reference image for the RC-registration of
post-bolus serie.
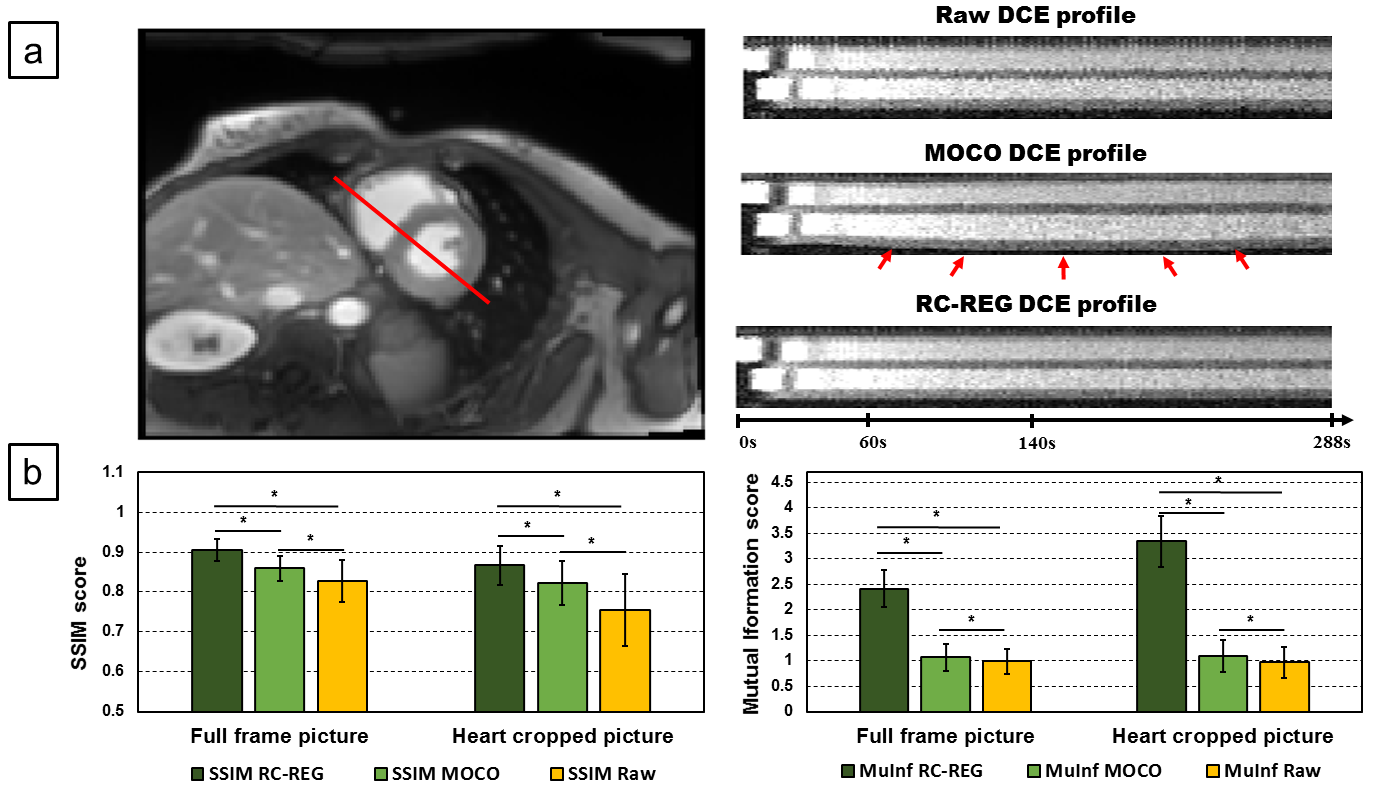


Table 1: Measured permeability parameters.
*: means that is statistically different (p<0.05) to RC-REG DCE series values (n=42 segments from 7 subjects),
†: means that is statistically different (p<0.05) to Raw DCE series values (n=42 segments from 7 subjects),
‡ : means that is statistically different (p<0.05) to ECV values (n=42 segments from 7 subjects).
SD values of permeability parameters of RC-REG DCE series are always the lowest except for Vp. Peculiar Ve values of MOCO DCE series is reported while Ve values of RC-REG are the closest from ECV one.