2143
MRI-Derived Virtual Fractional Flow Reserve (vFFR): Preliminary Results1Biomedical Engineering, Georgia Tech and Emory University, Atlanta, GA, United States, 2Radiology & Imaging Sciences, Emory University, Atlanta, GA, United States
Synopsis
Preliminary results are presented for calculation of virtual fractional flow reserve (vFFR) using magnetic resonance coronary angiography and phase-contrast magnetic resonance to define the boundary conditions for a computational fluid dynamics (CFD) model.
Introduction
Not all patients with coronary artery lesions are at risk for complications and therefore it is important for clinicians to be able to determine which patients need treatment with percutaneous intervention and stenting. It has been shown that guidance based on functional severity of the stenosis is far more beneficial for optimizing patient outcomes than simply using anatomic severity1-4. The current gold standard for measuring functional severity is fractional flow reserve (FFR). FFR is defined as the ratio of the pressure distal to the lesion to the pressure proximal to the lesion5. By inducing maximal hyperemia in the patient, the downstream myocardial resistance can be assumed to be constant, and this pressure ratio therefore approximates how severely the flow through the vessel has been affected. Despite its proven efficacy, FFR is often not used clinically due to its invasive nature, and therefore an alternative method is needed. Some developments have been made toward virtual FFR (vFFR) in which FFR is estimated through imaging and patient-specific computational fluid dynamics (CFD). This has primarily been done through computed tomography (CT) which is unable to characterize the patient’s hyperemic flow rate6. Here we describe methodology and early experience calculating vFFR magnetic resonance coronary angiography as well as rest and stress flow quantification acquired through phase-contrast MRI (PCMR).Methods
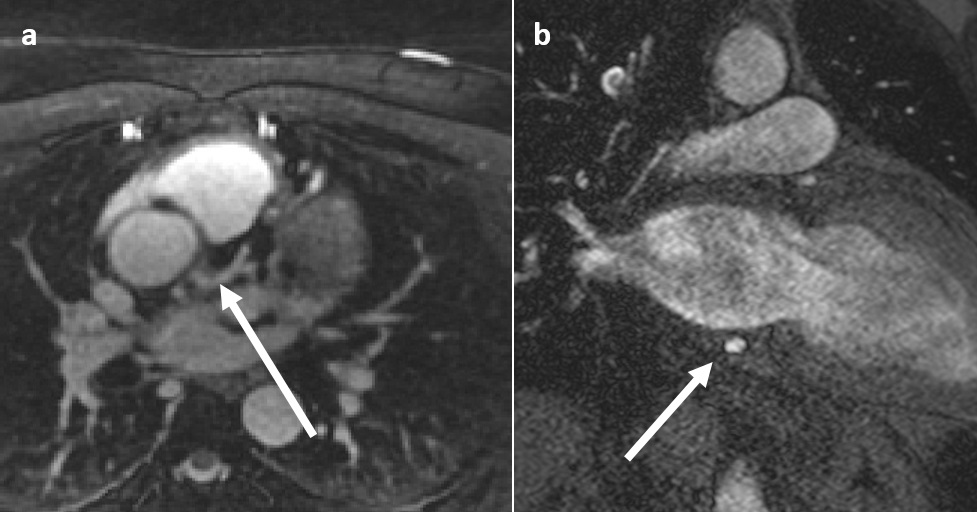
Magnetic Resonance Coronary Angiograms were acquired on either: 1) a 3T MRI scanner (Trio, Siemens Medical Systems) using a 3D, whole-heart, navigator- and EKG-gated inversion-recovery FLASH sequence with a centric k-space trajectory at a resolution of 0.64 x 0.64 x 0.75 mm3 in diastole during the slow infusion of a gadolinium-based contrast agent7, or 2) on a 1.5 T MRI scanner (Avantofit, Siemens Medical Systems) using a 3D, whole-heart, EKG-gated, bSSFP sequence with a spiral phyllotaxis trajectory at an isotropic resolution of 1.0 mm, followed by motion correction using self-navigation8 [Figure 1a]. Images of the left main (LM), left circumflex (LCX), and left anterior descending (LAD) arteries were segmented (vmtk, Vascular Modeling Toolkit), smoothed and wrapped (Geomagic, Geomagic, Inc.), and given inlet and outlet extensions and discretized (ICEM, ANSYS, Inc.).
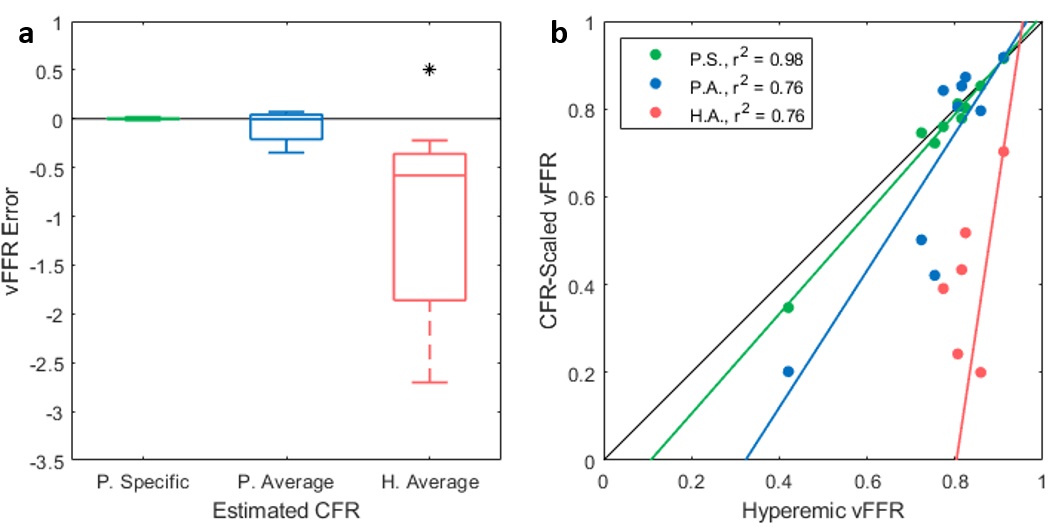
Coronary Sinus (CS) Flow at rest and stress was determined in a group of 5 patients undergoing a cardiac MR stress test using through-plane 2D PCMR images at a resolution of 1.0 x 1.0 mm2 acquired with 18 cardiac phases using a slice positioned immediately proximal to the right atrium [Figure 1b]. Murray’s law—which relates the diameters of branching vessels to their flow-splitting ratios—was used to divide CS flow rate between the left and right coronary circulations9. Global Coronary Flow Reserve (CFR) was calculated by dividing the hyperemic flow rate by the basal flow rate, and the average CFR value for the group was found—3.1. Each patient’s basal flow rate was then scaled by this average CFR to obtain a group average approximate hyperemic flow rate. Lastly, the basal flow was also scaled by the healthy average CFR of 4.810, 11. Effectively, the basal flow was scaled by three CFR values to give three approximations for the hyperemic flow for each of the five patients: 1) patient-specific CFR, which gives the same time-averaged flow rate as the patient-specific hyperemic flow, 2) patient-average CFR, and 3) healthy-average CFR. These 15 resulting flows were applied as inflow boundary conditions in the anatomic coronary models. CFD simulations were performed (Fluent, ANSYS, Inc.) under steady conditions until the system reached convergence (r < 0.00001). FFR was then computed assuming an inlet pressure of 100 mmHg. Additionally for each flow set, the hyperemic flow waveform was used to define a transient inflow boundary condition to compute the time-dependent “true” vFFR which was then used to compare against the three steady vFFR values for each patient.
Results
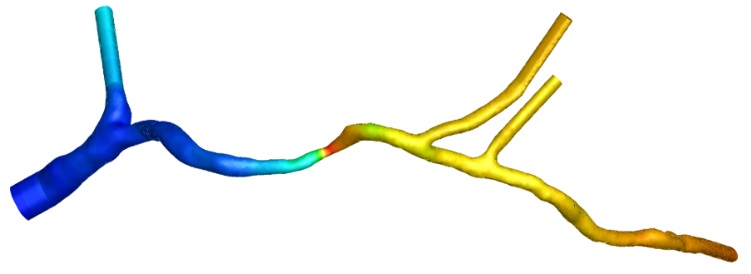
Visually, vFFR was visually seen to behave as expected [Figure 2]. Comparison of steady vFFR values with hyperemic vFFR showed that vFFR calculation is independent of the flow waveform and only depends on the time-average flow rate [Figure 3]. Therefore, patient-specific hyperemic flow information is necessary for accurate calculation of vFFR.Discussion
MRI is able to obtain both the anatomy and rest/stress flow measurements needed to compute patient-specific vFFR non-invasively. Measuring CS flow with PCMR will likely prove more feasible clinically than directly measuring coronary arterial inflow due to increased size and reduced motion, and it was seen that the computed vFFR did not depend on the flow waveform. Therefore, future steps will be to validate that dividing CS flow between the left and right coronaries can accurately predict their respective, time-averaged flow rates.Acknowledgements
This work was funded by NSF. Imaging assistance was provided by Davide Piccini and Matthias Stuber.References
1. Pijls, N.H., et al., Percutaneous coronary intervention of functionally nonsignificant stenosis: 5-year follow-up of the DEFER Study. J Am Coll Cardiol, 2007. 49(21): p. 2105-11.
2. Shaw, L.J., et al., Optimal medical therapy with or without percutaneous coronary intervention to reduce ischemic burden: results from the Clinical Outcomes Utilizing Revascularization and Aggressive Drug Evaluation (COURAGE) trial nuclear substudy. Circulation, 2008. 117(10): p. 1283-91.
3. Tonino, P.A., et al., Fractional flow reserve versus angiography for guiding percutaneous coronary intervention. New England Journal of Medicine, 2009. 360(3): p. 213-224.
4. De Bruyne, B., et al., Fractional flow reserve-guided PCI versus medical therapy in stable coronary disease. N Engl J Med, 2012. 367(11): p. 991-1001.
5. Pijls, N.H., et al., Fractional flow reserve a useful index to evaluate the influence of an epicardial coronary stenosis on myocardial blood flow. Circulation, 1995. 92(11): p. 3183-3193.
6. Taylor, C.A., Fonte, T.A., and Min, J.K., Computational fluid dynamics applied to cardiac computed tomography for noninvasive quantification of fractional flow reserve: scientific basis. J Am Coll Cardiol, 2013. 61(22): p. 2233-41.
7. Yang, Q., et al., Contrast-enhanced whole-heart coronary magnetic resonance angiography at 3.0-T: a comparative study with X-ray angiography in a single center. J Am Coll Cardiol, 2009. 54(1): p. 69-76.
8. Piccini, D., Respiratory Self-Navigation for Free Breathing Whole-Heart Coronary MR Imaging with High Isotropic Spatial Resolution in Patients. 2013.
9. Murray, C.D., The Physiological Principle of Minimum Work: I. The vascular System and the Cost of Blood Volume. Proc. of the NAS of USA, 1926. 12(3): p. 207-214.
10. Gould, K.L., Lipscomb, K., and Hamilton, G.W., Physiologic basis for assessing critical coronary stenosis. Instantaneous flow response and regional distribution during coronary hyperemia as measures of coronary flow reserve. Am J Cardiol, 1974. 33(1): p. 87-94.
11. Wilson, R.F., et al., Effects of adenosine on human coronary arterial circulation. Circulation, 1990. 82: p. 1595-1606.
Figures