2139
Fully automatic segmentation of cine cardiac MR images based on deep learning: an open-source toolbox with a failure alarm mechanism1Department of Electrical Engineering, National Taiwan University of Science and Technology, Taipei, Taiwan
Synopsis
In this study, we implemented a open-source toolbox for heart segmentation and analysis based on a deep-learning algorithm. We evaluated the accuracy of the system using the ACDC datasets provided in STACOM 2017. Also, we developed an alarm mechanism in this system to report the potential failure of the analysis procedures.
Purpose
Multi-phase cardiac MR (CMR) imaging methods have been shown reproducible and accurate for measuring structural and functional parameters of left ventricular (LV), such as masses and ejection fraction (LVEF)1. In this study, we developed a fully automatic and open-source toolbox based on deep learning for segmentation of heart regions and producing parameters such as LVEF.Materials and Methods
The ACDC datasets2,3 include multi-slice multi-phase cardiac images obtained from 100 subjects under the procedures approved by the ethical committee of the Hospital of Dijon (France). The datasets were acquired using two MRI scanners, 1.5 T Siemens Area, and 3.0 T Siemens Trio Tim, Siemens Medical Solutions, Germany. The short axis slices covering the LV were obtained using a cine balanced SSFP sequence with ECG-gating and breath hold. The participants were diagnosed as 5 subgroups (normal: 20, previous myocardial infarction: 20, dilated cardiomyopathy: 20, hypertrophic cardiomyopathy: 20, abnormal right ventricle: 20). Three regions, LV walls and blood-pool region (LVw, LVb) and right ventricle blood pool region (RVb), of each dataset, were manually outlined by one clinical expert and provided along with the ADCD datasets.
We first normalized each volume with its maximum intensity and split the subjects into training sets with 75 subjects (5 groups × 15 subjects) and validation sets with 25 subjects (5 groups × 5 subjects) for training a semantic segmentation network based on U-NET [2]. We trained the network after removing the slices without pixels labeled as the heart region, and applied image augmentations, including image flipping, rotation, transpose, and contrast adjustments during the training stage. The output of the U-NET was a multi-class softmax classifier producing an image with pixels labeled as 0: background, 1: RVb, 2: LVw, and 3: LVb. The procedure furthered calculated LVEF and RVEF values according to LVb and RVb masks of all the slices and time frames. Also, we implemented a failure estimation by averaging the softmax values of three labels (RVb, LVw, LVb) in the images. The softmax values indicated the confidence of the prediction. For each dataset, we counted the number of images with the average softmax value less than 0.9 and divided it by the total number of slices to generate a “puzzle” rate. We evaluated the accuracy of LV segmentation with Dice coefficients and estimated the correlation coefficients between ejection fractions obtained with U-NET-based and the manually labeled LVb and RVb masks.
Results
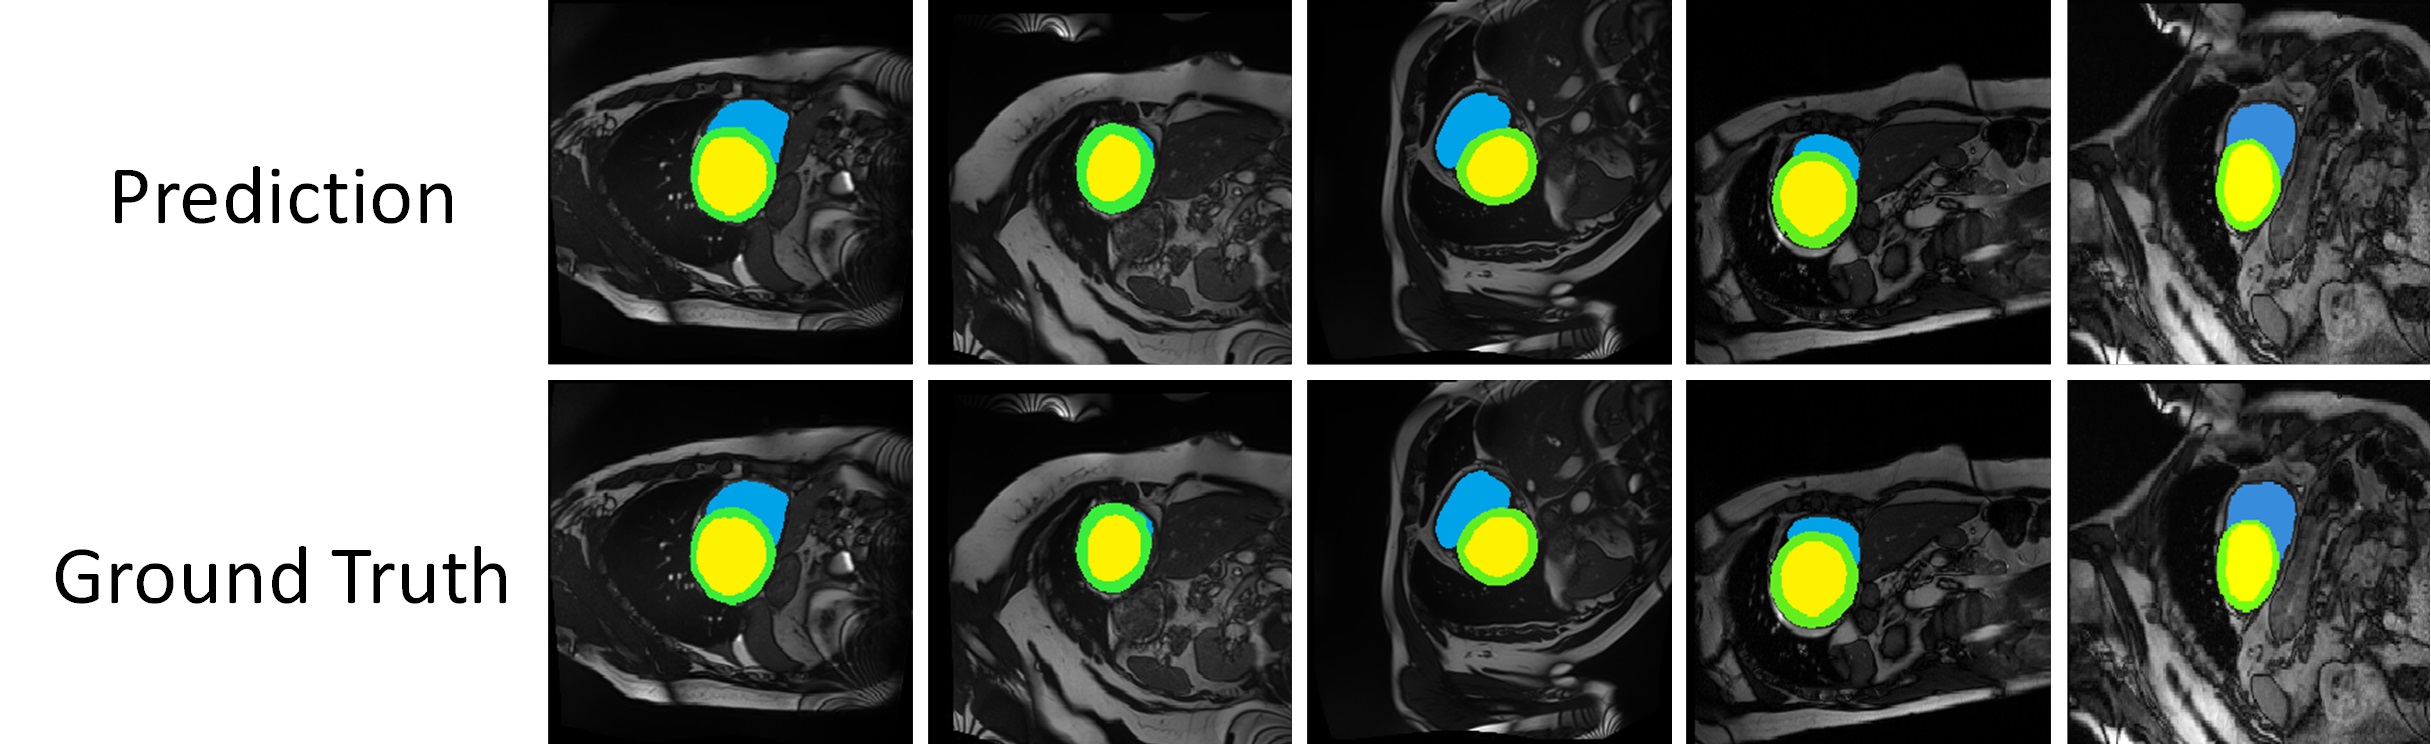
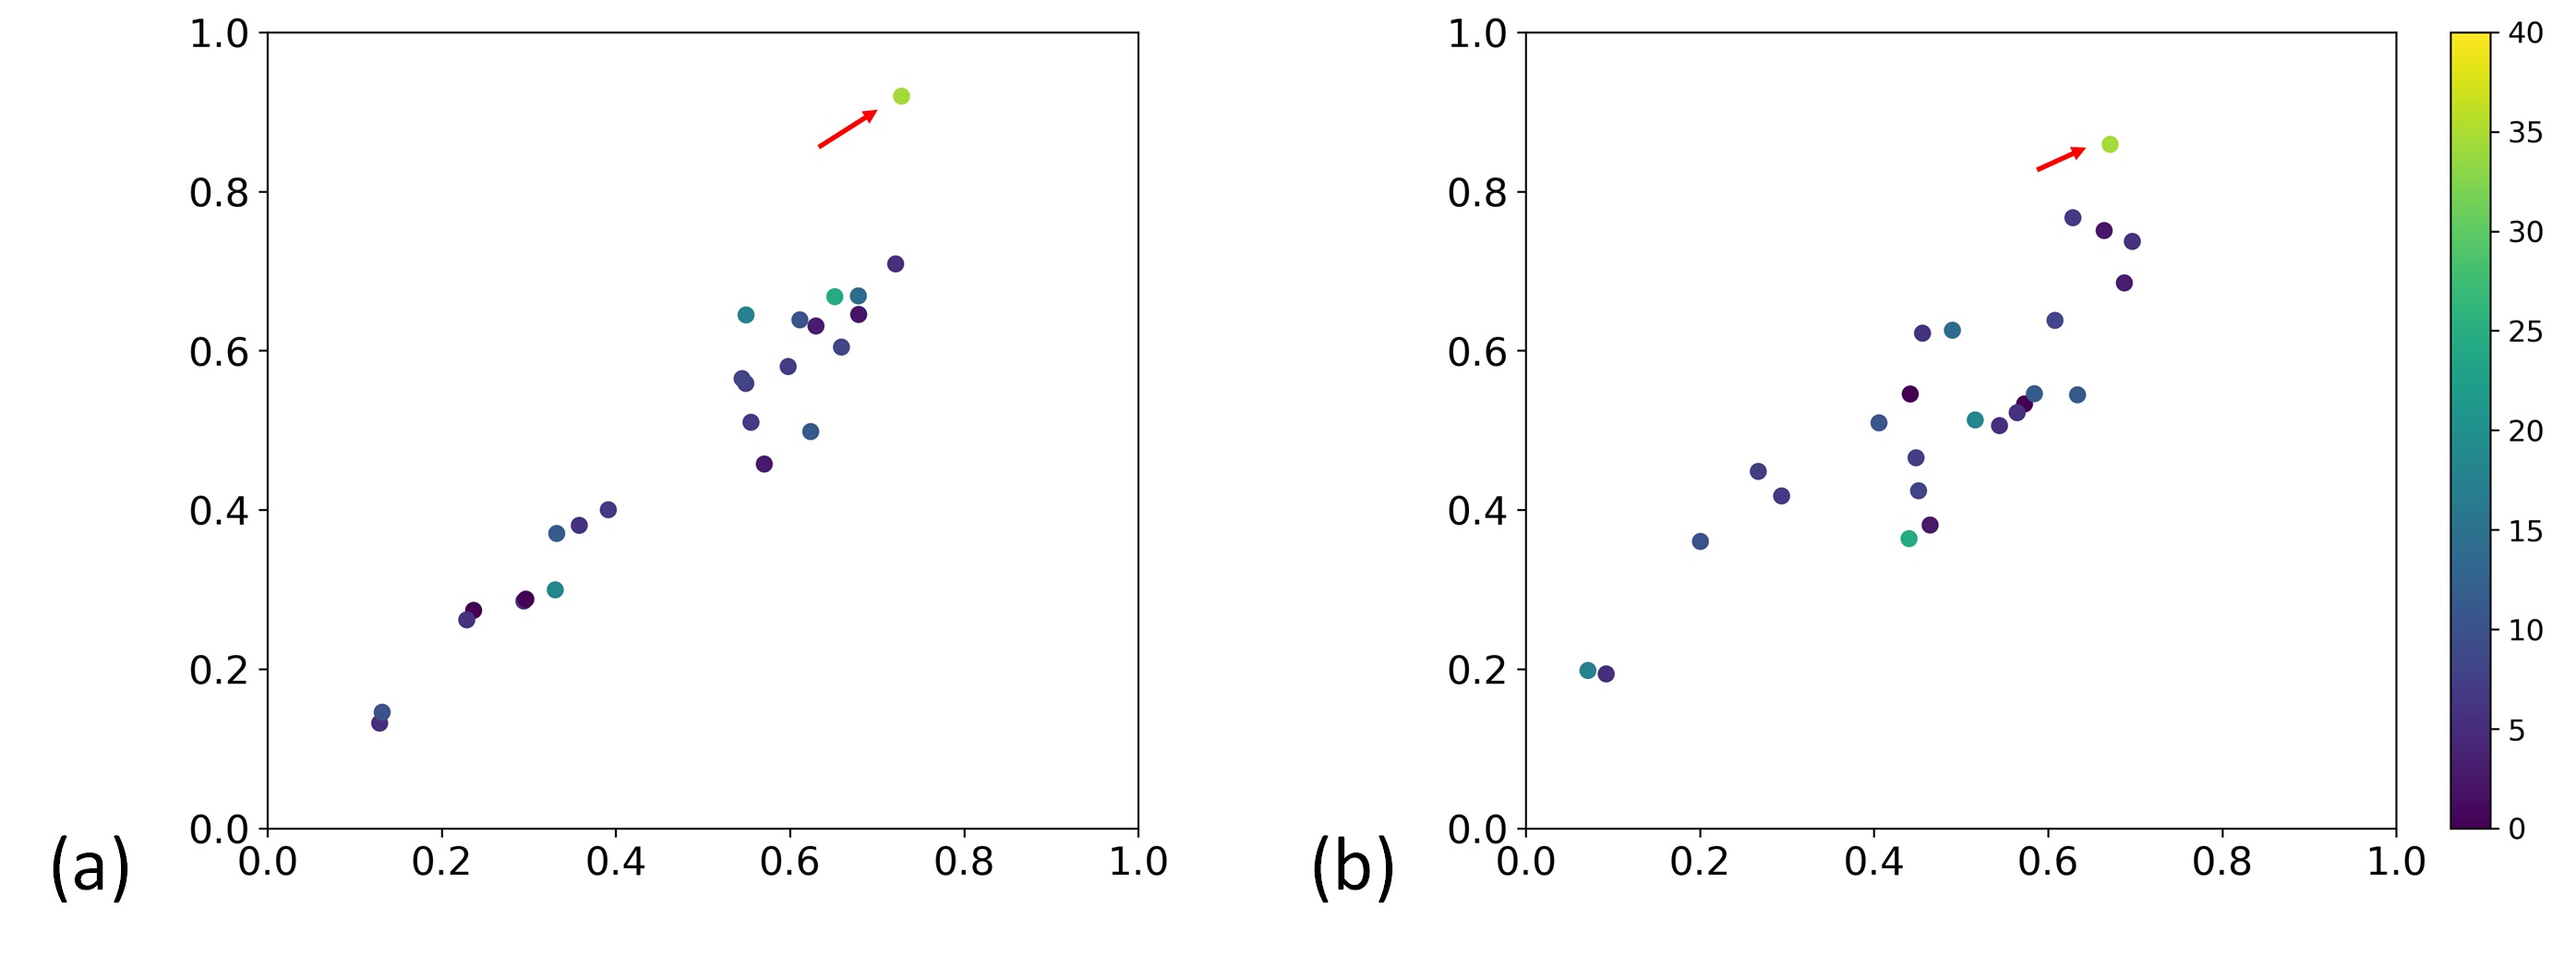
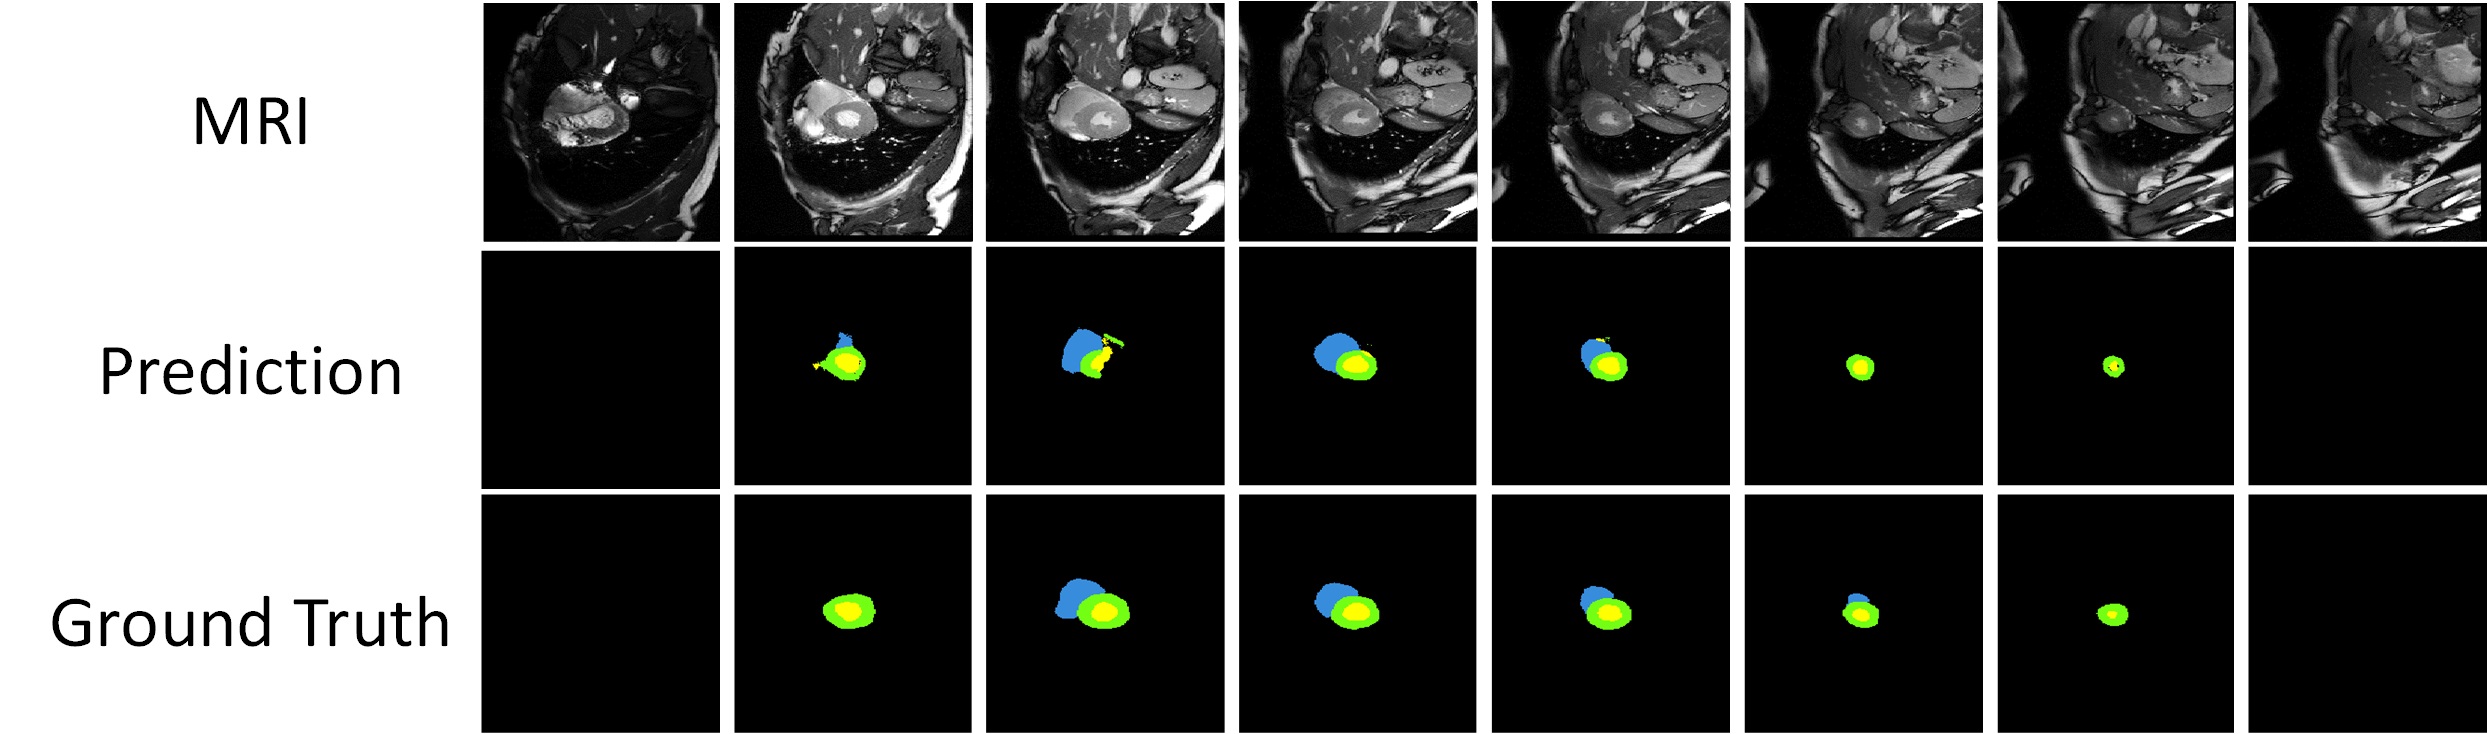
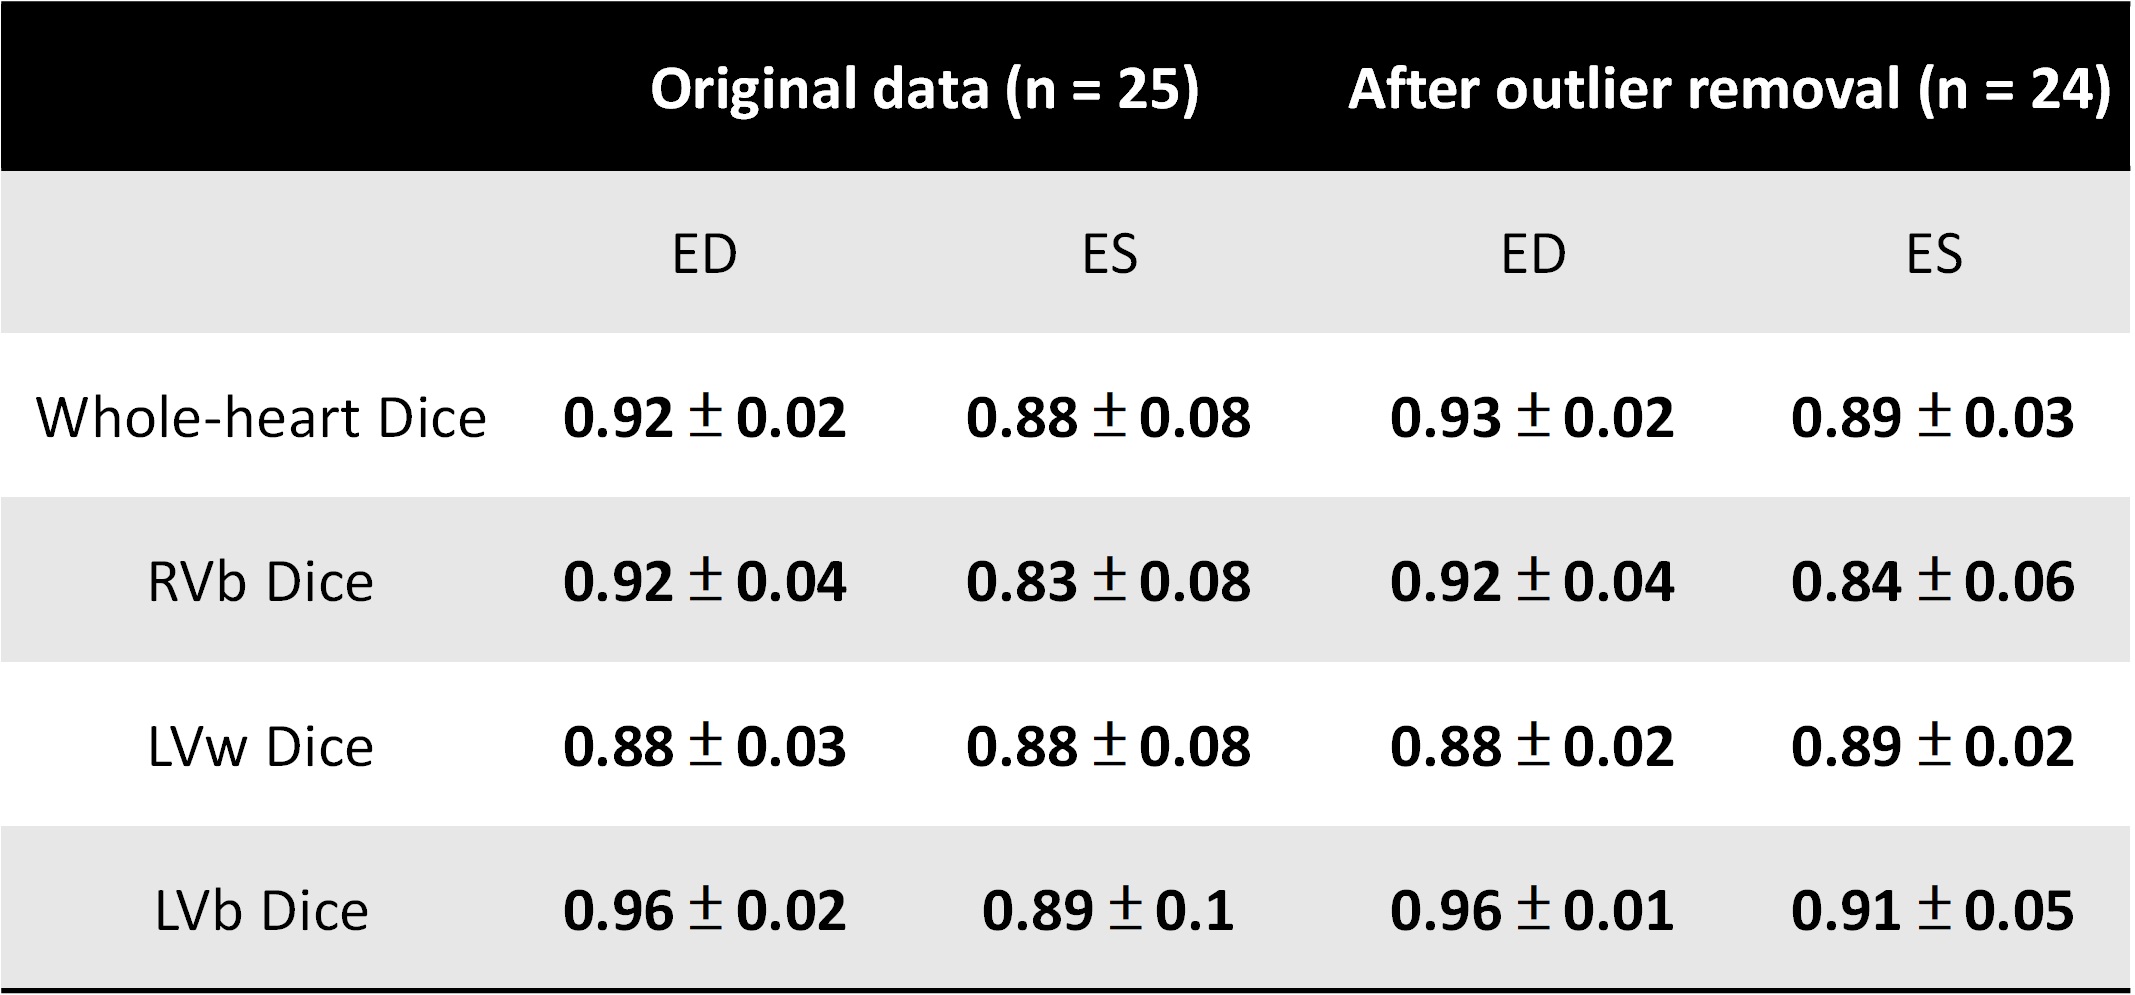
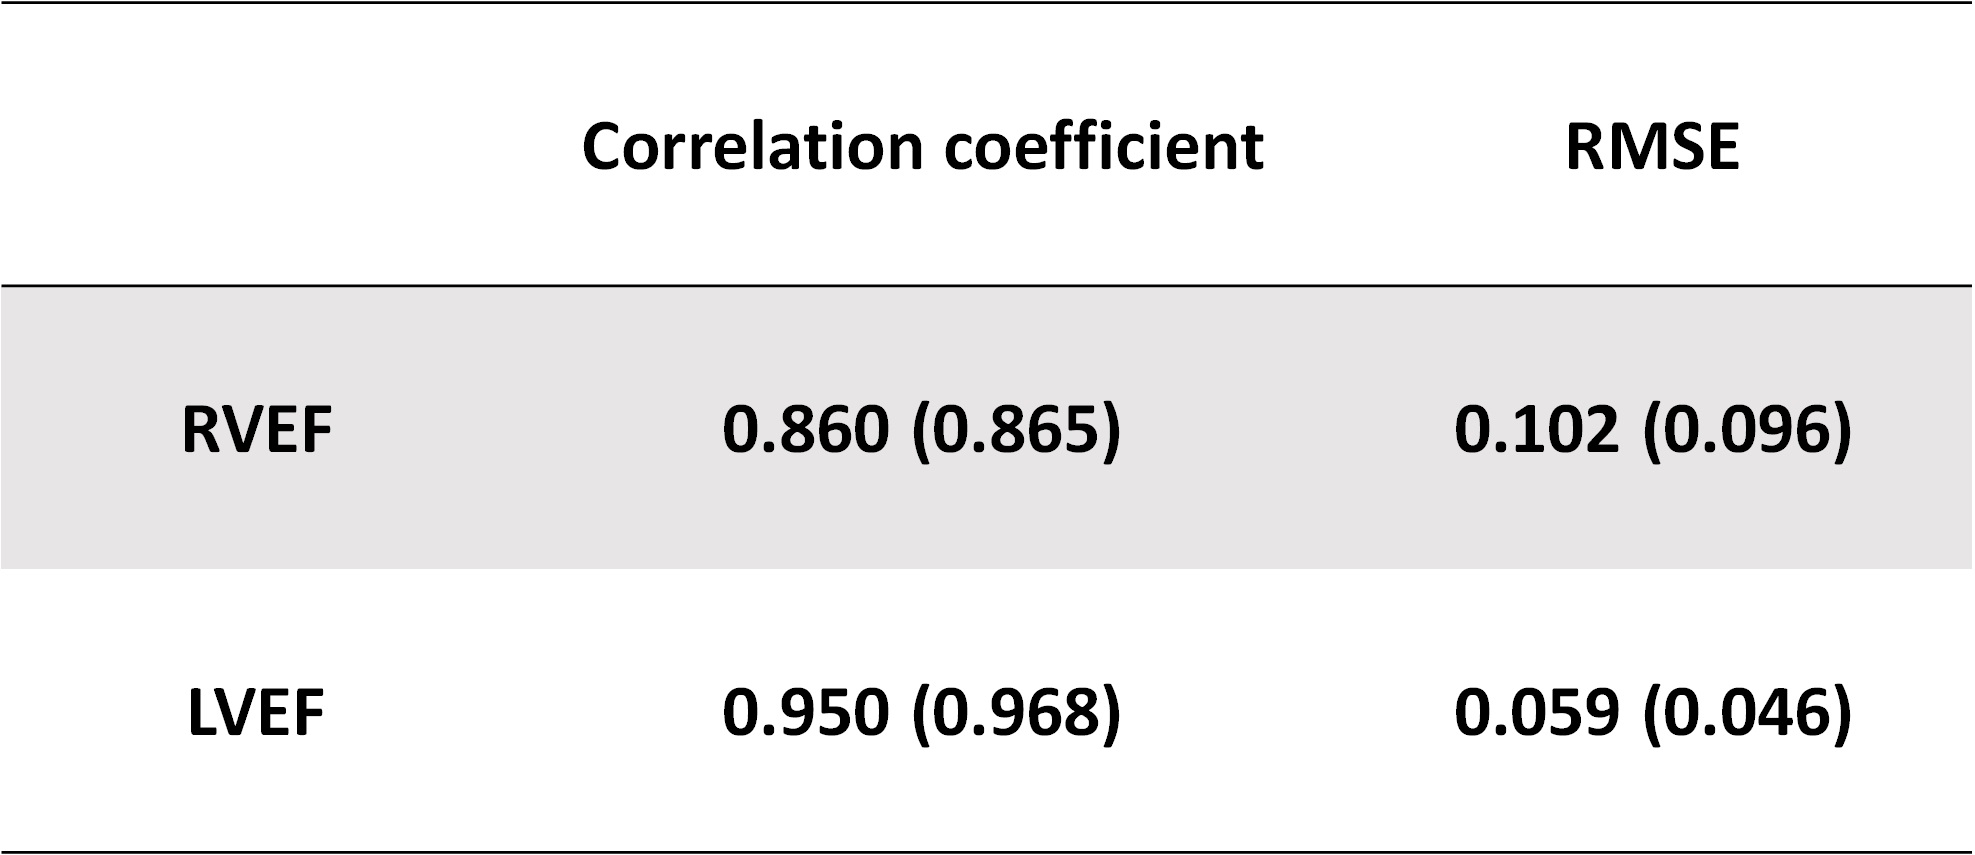
Figure 1 displays an example of the segmentations predicted by the proposed system. Notice that the three labels (RVb, LVw, LVb) were generated simultaneously. Using the obtained LVb and RVb masks of all the cardiac phases, we identified the end-systolic (ES) and the end-diastolic (ED) by the minimum and the maximum numbers of pixels within LVb and RVb and then calculated LVEF and RVEF accordingly. Figure 2 shows the scatter plot of the reference and predicted EF values. We found an apparent outlier indicated by a red arrow. For the predicted labels of this outlier, the puzzle rate (34%) is the highest amount all datasets. The corresponding predictions are shown in Figure 3. Therefore, we regarded the obtained U-Net model could not predict heart labels accurately. Table 1 listed the group statistics obtained from the validation set. Table 2 listed the correlation coefficients and root-mean-square errors (RMSE) of LVEFs and RVEFs.Discussions and Conclusions
In this study, we aimed to develop an open-source toolbox that can perform automatical heart segmentation for multi-phase cardiac MR datasets. The correlation coefficient of LVEF is 0.968. The results supported that the fully automatic system accurately produced LVEF and it may be practical to clinical applications, especially the analysis of large-scale cardiac MRI databases. However, the “AI” system still has its limitations. The segmentation method may fail due to signal-to-noise ratio, contrast, blurring or motion artifacts of MR images. Although our system cannot resolve all the problems, it provided a failure alarm reporting potential problematic estimations of CMR parameters. This mechanism could reduce error in clinical researches. Estimating the accuracy of the system by using local cohorts and varieties of CMR databases could further confirm the reliability of this system and thus merits further investigations. In summary, we developed an open-source toolbox for CMR segmentation and analysis. It could be a practical tool for clinical applications. The analysis system is available at https://github.com/htygithub/CSEG.
Acknowledgements
Supported by the Ministry of Science and Technology under grants 107-2314-B-011-002-MY3References
[1] Hoffmann R, von Bardeleben S, ten Cate F, Borges AC, Kasprzak J, Firschke C, Lafitte S, Al-Saadi N, Kuntz-Hehner S, Engelhardt M: Assessment of systolic left ventricular function: a multi-centre comparison of cine ventriculography, cardiac magnetic resonance imaging, unenhanced and contrast-enhanced echocardiography. Eur Heart J. 2005, 26: 607-616.
[2] Olaf Ronneberger, Philipp Fischer, Thomas Brox, “U-Net: Convolutional Networks for Biomedical Image Segmentation”, Medical Image Computing and Computer-Assisted Intervention (MICCAI), Springer, LNCS, Vol.9351: 234--241, 2015, available at arXiv:1505.04597
[3] Automated Cardiac Diagnosis Challenge https://www.creatis.insa-lyon.fr/Challenge/acdc/. Accessed on 2018/11/1
Figures