2136
Application of Deep Learning Reconstruction for Denoising of Compressed Sensing non-contrast coronary MRA images to achieve improved Diagnostic Confidence.1Cardiology, Johns Hopkins University, Baltimore, MD, United States, 2Radiology, Johns Hopkins University, Baltimore, MD, United States, 3Canon Medical Systems Corporation, Otawara, Japan, 4Canon Medical Research USA, Inc., Cleveland, OH, United States
Synopsis
Non-contrast Magnetic resonance coronary artery (MRCA) image acquisition has technical limitations of long acquisition time or reduced image resolution. We explore the use of a denoising approach with deep learning image reconstruction (dDLR) from k-space data. We investigate the effect of various levels of dDLR on Compressed Sensing non-contrast MRCA (CS-MRCA) images and optimize dDLR algorithms that achieve the best diagnostic confidence (DC) and a high signal-to-noise-ratio (SNR).
INTRODUCTION
Non-contrast MR coronary angiography (MRCA) is a candidate modality to replace coronary CT, although it is still challenging because of its time-consuming characteristics and rather low spatial resolution in comparison to CT. Improving spatial resolution is a challenge because smaller pixel sizes tend to produce lower contrast-to-noise and signal-to-noise ratios (SNR) resulting in reduced diagnostic confidence (DC). Compressed sensing (CS) is a method of accelerated image [1–4]. The optimization process of CS is based on finding the best regularization parameter lambda (λ=10(r-4)) to balance the two terms of data fidelity and transform sparsity [5, 6]. The weakness of CS is its noise-like granular characteristics due to its random k-space data acquisition. The denoising approach with deep learning reconstruction (dDLR) is a noise adaptive algorithm. [7] The denoise level of small batch area depends on soft shrinkage model adaptively. It is promising to improve image quality of CS-MRCA, however too much image smoothing may lead to unfavorable image blurring or produce artefactual smoothing leading to removal of clinically meaningful signal intensity drops across the artery. Hence, merely assessing the noise level is insufficient. In this study, we aim to assess the feasibility of dDLR on CS-MRCA at different resolutions using a visual quality validation scale of DC and a quantitative SNR.METHODS
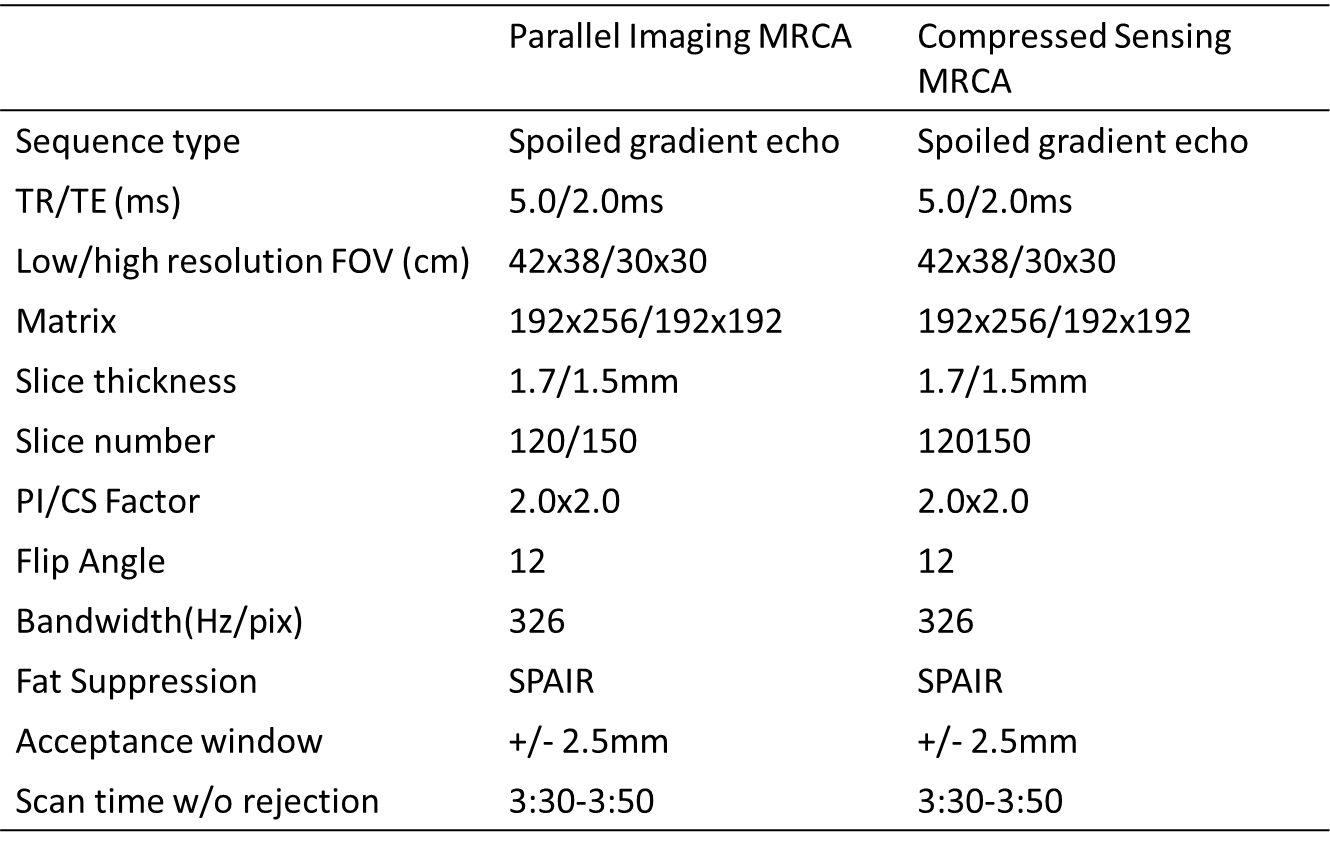
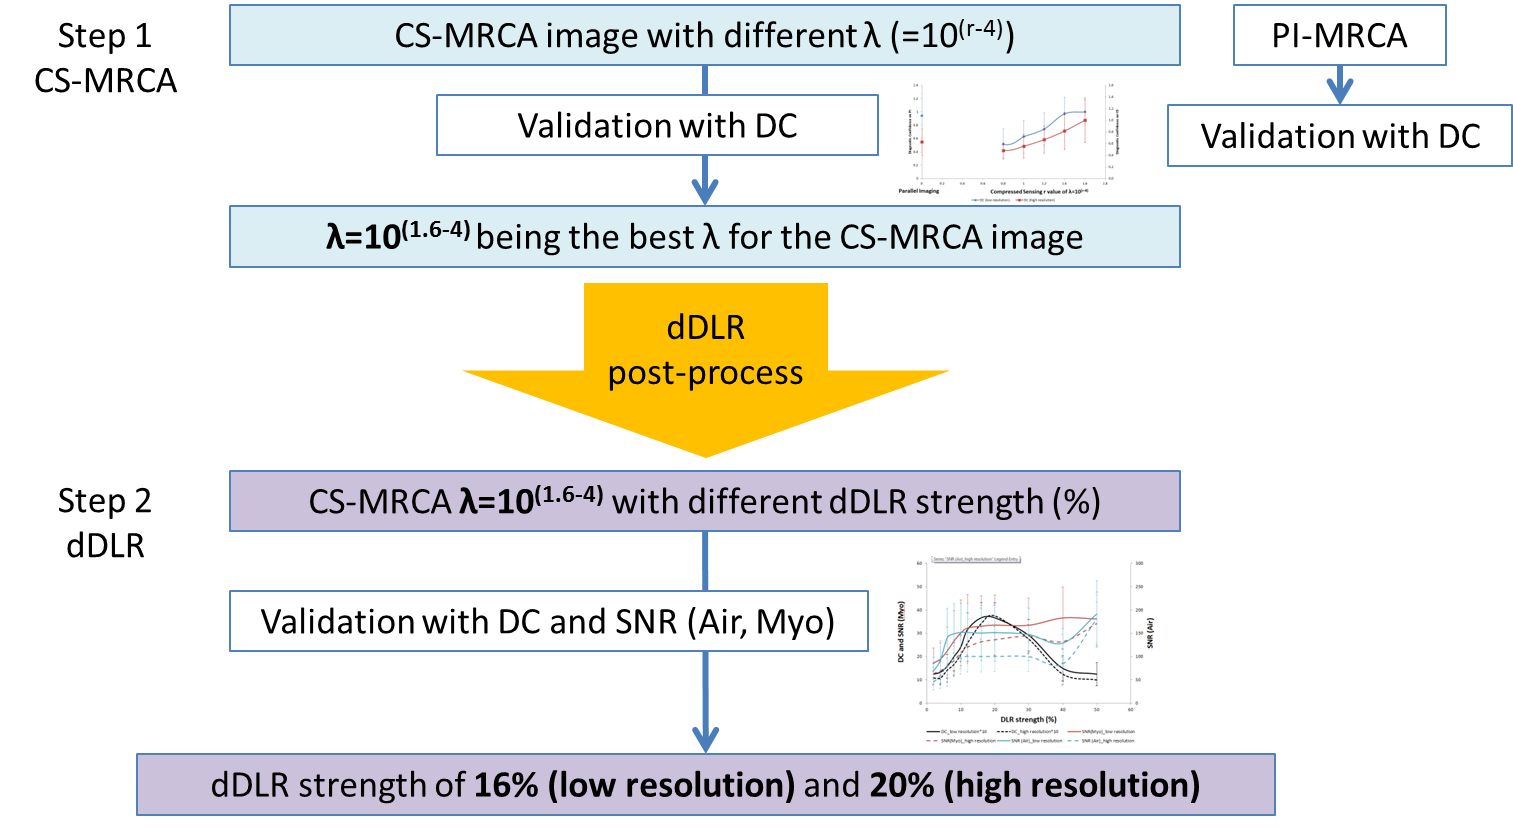
Healthy participants underwent non-contrast whole heart MRI with T2-prepared segmented fast low-angle shot 3D spoiled gradient echo sequence with ECG-gating, diaphragm navigator-gating, and fat suppression. All the scans were performed with a Vantage Galan 3T scanner (Canon Medical Systems). The image acquisition parameters are shown in Table 1. For each subject, low and high resolution images were acquired with PI and CS-MRCA with different lambda (λ=10(r-4) from r = 0.8 to 1.6). DC was defined as the confidence level of the MRCA clinical reading based on an expert, with 1 the least and 4 the most confident. After identification of the lambda level with highest DC, the corresponding CS-MRCA images were chosen to undergo the dDLR process which assumed the input (Gaussian distribution) noise levels varied from 2 to 50% of the original images.These dDLR-CS-MRCA images were scored with DC and quantitative metrics of SNR were also calculated from the signal intensity (SI) in the aorta divided by the standard deviation (SD) of the background (air and myocardium). All the analysis was performed by a single expert reader with 7 years of experience. Data were expressed as mean±SD. For the comparison of DC scores, Wilcoxon signed-rank test was performed. Statistical significance is defined as P<0.05.RESULTS
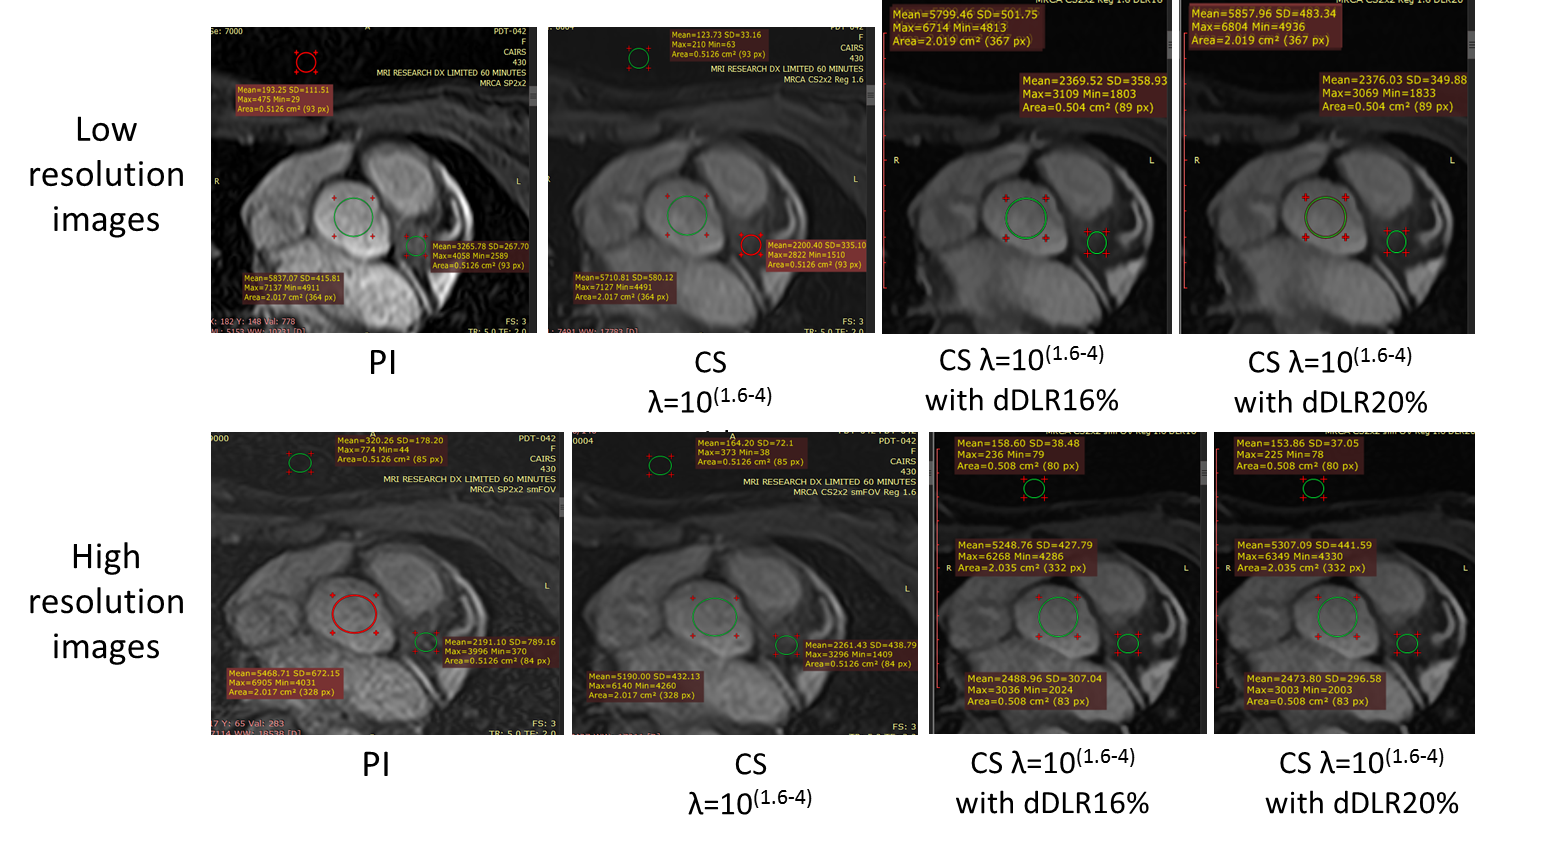
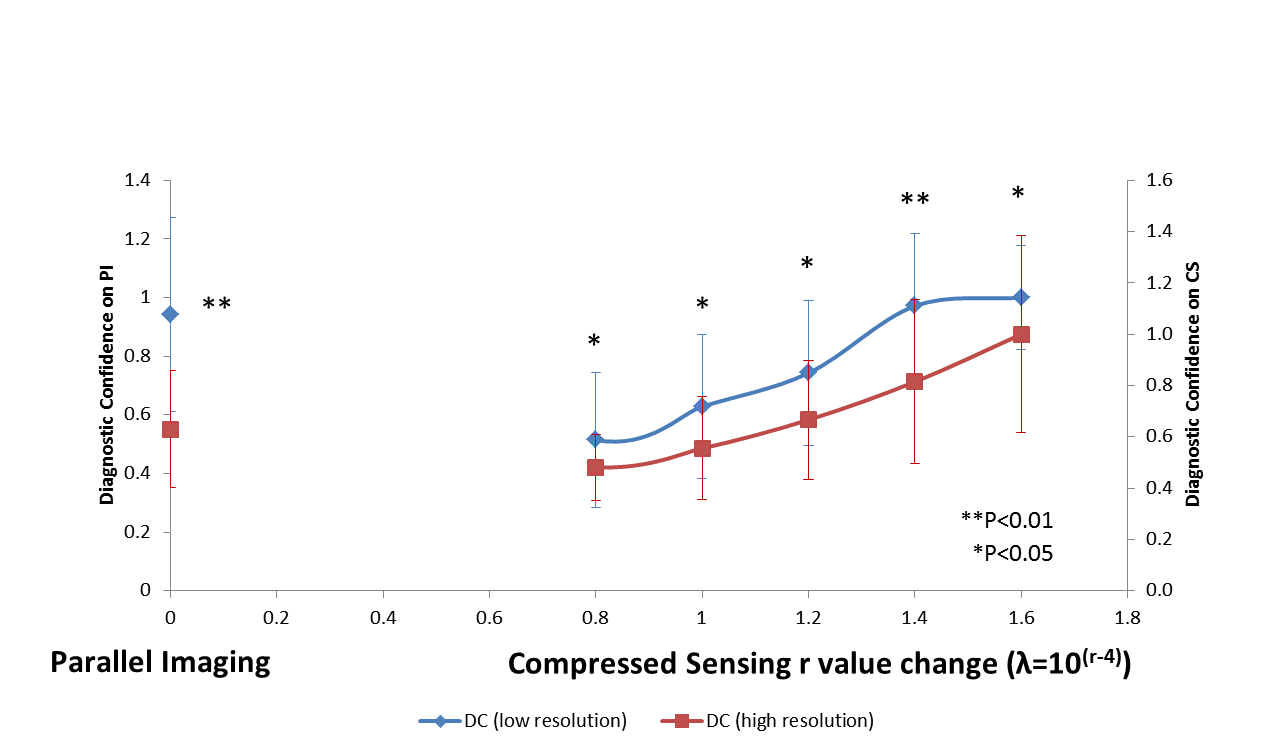
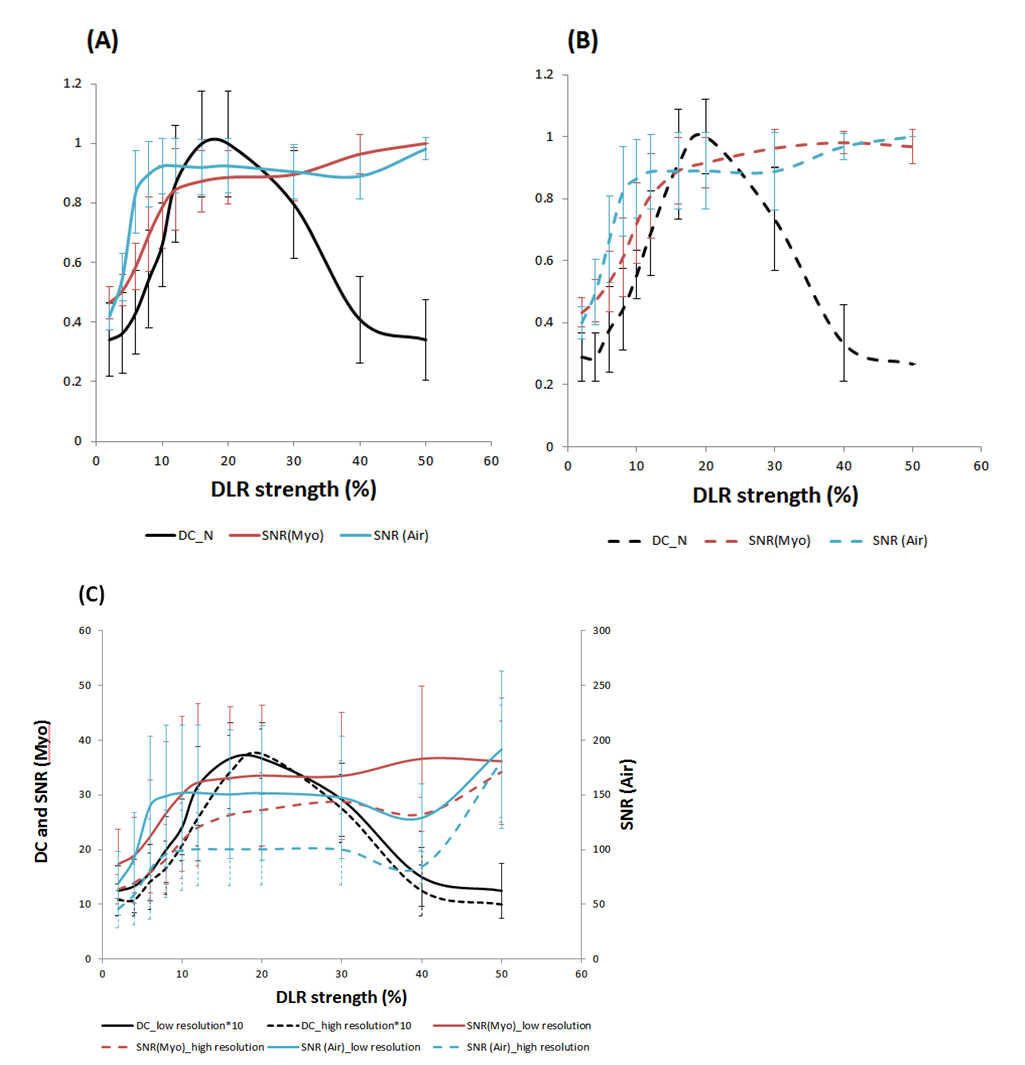
Twelve normal participants were recruited for this IRB approved study. The mean age was 32.8 ±14.6 (y/o), 33% were male, and the mean body mass index (BMI) was 24.5±4.7. A representative case is shown in Figure 1. Low resolution images showed significantly higher DC scores than the high resolution both in PI and CS-MRCA images (Figure 2). DC increased and reached a plateau at r = 1.4 (λ=10(1.4-4)) for the low resolution, while in high resolution r = 1.6 (λ=10(1.6-4)) showed the highest score. Accordingly, we decided to use r = 1.6 (λ=10(1.6-4)) CS-MRCA for running our dDLR algorithm. The DC showed highest value at dDLR 16% on low resolution (Figures 3A), and at 20% on high resolution images (Figures 3B). SNR (Air) increase rate was steeper than SNR (Myo) but both the SNRs reached plateau around dDLR 10%. (Figures 3A and B). The peak DC level in high resolution image was comparable to that of the low resolution image (Figure 3C). The summary of the study procedure is presented in Figure 4.DISCUSSION
dDLR processing achieved the same level of DC even in high resolution images, which was not possible in PI or in CS-MRCA images without dDLR. The denoise strength depends on structure and complexity of images so that SNR, i.e. SNR of “Air” quickly improved across dDLR strength based on adaptive algorithm. Selecting optimal dDLR strength based on the resolution is likely an important consideration. The significant discordance between the DC level and noise level by SNR can be explained by the increased blurriness by the oversmoothing with high dDLR strength. When assessing dDLR processed images, it is important to assess not only the granularity, but also the blurriness. DC and SNR worked complementary so that the usage of both metrics is recommended to assess the image quality.CONCLUSION
dDLR achieved the same level of DC in CS-MRCA with different resolution. Combining DC and SNR was recommended to assess both the noise and blurriness derived from dDLR.Acknowledgements
This study was funded by Canon Medical Systems Corporation.References
1. Akçakaya M, Basha TA, Chan RH, et al.: Accelerated contrast-enhanced whole-heart coronary MRI using low-dimensional-structure self-learning and thresholding. Magn Reson Med 2012; 67:1434–1443.
2. Akçakaya M, Basha TA, Chan RH, Manning WJ, Nezafat R: Accelerated isotropic sub-millimeter whole-heart coronary MRI: compressed sensing versus parallel imaging. Magn Reson Med 2014; 71:815–22.
3. Nam S, Akçakaya M, Basha T, et al.: Compressed sensing reconstruction for whole-heart imaging with 3D radial trajectories: A graphics processing unit implementation. Magn Reson Med 2013; 69:91–102.
4. Nakamura M, Kido T, Kido T, et al.: Non-contrast compressed sensing whole-heart coronary magnetic resonance angiography at 3T: A comparison with conventional imaging. Eur J Radiol 2018; 104(February):43–48.
5. Otazo R, Kim D, Axel L, Sodickson DK: Combination of compressed sensing and parallel imaging for highly accelerated first-pass cardiac perfusion MRI. Magn Reson Med 2010; 64:767–776.
6. Forman C, Wetzl J, Hayes C, Schmidt M: Compressed Sensing : a Paradigm Shift in MRI. MAGNETOM Flash 2016; 66:8–13.
7. Isogawa K, Ida T, Shiodera T, Takeguchi T: Deep Shrinkage Convolutional Neural Network for Adaptive Noise Reduction. IEEE Signal Process Lett 2018; 25:224–228.
Figures