2135
Automated measurement of peri-organ visceral adipose tissue in MRI as a powerful biomarker of metabolic profile1Institute of Cardiometabolism and Nutrition (ICAN), Paris, France, Paris, France, 2Unité de recherche sur les maladies cardiovasculaires, du métabolisme et de la nutrition (UMRS 1166), NutriOmics team 6, and Nutrition department, Pitié-Salpêtrière Hospital, Paris, France, Institute of Cardiometabolism and Nutrition (ICAN), Paris, France, Paris, France, 3Laboratoire d’Imagerie Biomédicale (LIB), Institute of Cardiometabolism and Nutrition (ICAN), Paris, France, Paris, France, 4Unité de recherche sur les maladies cardiovasculaires, du métabolisme et de la nutrition (UMRS 1166), NutriOmics team 6, and Nutrition department, Pitié-Salpêtrière Hospital, Paris, France Département d’Imagerie CardioVasculaire et de Radiologie Interventionnelle et Thoracique (DICVRIT), Pitié-Salpêtrière Hospital, Paris, France, Institute of Cardiometabolism and Nutrition (ICAN), Paris, France Département d’Imagerie CardioVasculaire et de Radiologie Interventionnelle et Thoracique (DICVRIT), Pitié-Salpêtrière Hospital, Paris, France, Paris, France
Synopsis
The aim of this work is to develop an automatic segmentation algorithm to classify truncular adipose tissue into different compartments. MRI acquisitions including cine-SSFP and DIXON imaging were performed at 1.5 T in 117 individuals (metabolic patients and healthy controls). Fat maps were filtered with a top-hat filter to correct intensity inhomogeneities. An active contour and a k-means algorithms were used to discriminate the SAT and the VAT. Accurate and reproducible quantification of the adipose tissue is crucial for metabolic studies since they serve as good indicators of metabolic and associated cardiovascular risks.
Introduction
Excessive or abnormal accumulation of subcutaneous (SAT) and/or
visceral adipose tissue (VAT) alters the metabolic profile and associates with the
development of cardiovascular complications [1] [2]. Routine measurements such as
body mass index are often limited in their diagnostic and prognostic value
because they provide only a rough average and indiscriminate body fat
composition and distribution [3]. Our objective is to propose a new approach to
characterize and quantify truncal adipose tissue in MRI and to study their
ability to differentiate patients with metabolic diseases (metabolic syndrome,
obesity, type II diabetes) compared to healthy subjects. Materials and methods
MRI acquisitions including cine-SSFP and DIXON imaging were
performed at 1.5T in 117 individuals (62 women, 55 men, age 47±11, BMI 31±7): 19
obese patients, 30 metabolic syndrome patients, 47 type II diabetes patients and
21 healthy controls. Cine-SSFP imaging parameters were: TE=1.22 ms, TR=57.8 ms,
in-plane resolution of 1.14 mm, flip angle 58° and acquisition matrix:
288x288. 26 axial slices with 5 mm thickness, and in-plane resolution of 1.18 mm
were acquired for each subject using a two-point Dixon sequence (TR=6.96 s,
TE1=2.39 ms, TE2=4.76 ms, flip angle 10°, acquisition matrix: 320x210, bandwidth
475 Hz/Px, NEX=2).
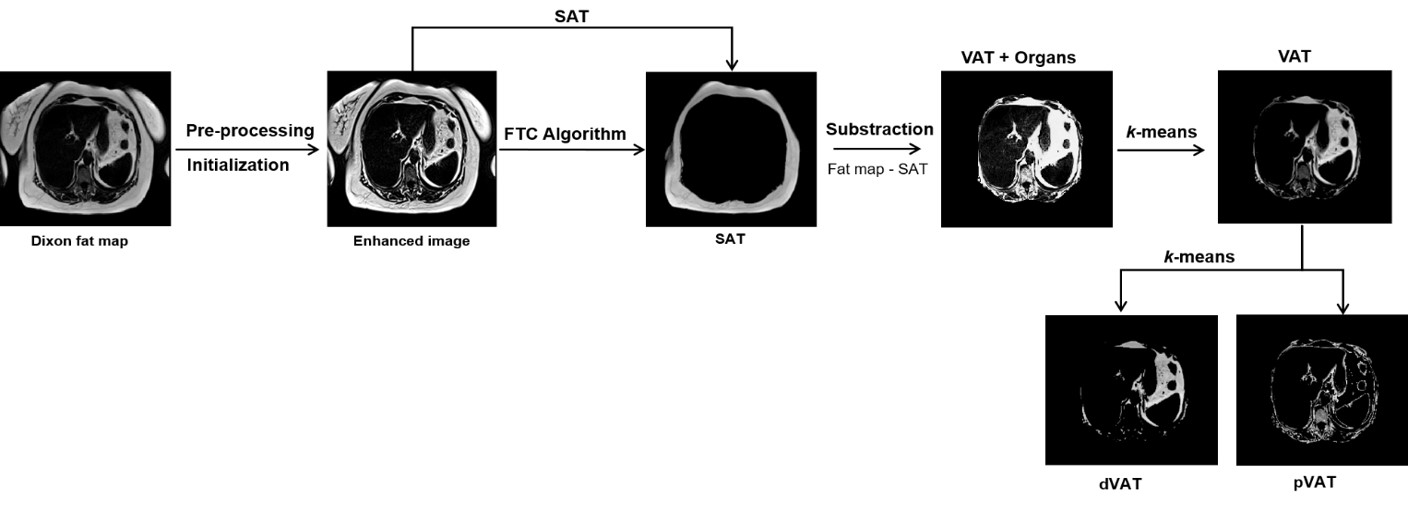
The segmentation of DIXON fat
maps into different fat compartments was carried out in 4 steps (fig.1). A
top-hat filtering mathematical morphology was used to fill holes, correct intensity
inhomogeneity, increase the contrast between the fat and the background of the
image and eliminate the acquisition artifacts. All objects in the image were
clustered using an automatic process. Only the object with the largest area was
taken into account for analysis. This step allowed for the elimination of the
non-interest objects such as arms. An active FTC (Fast Two-Cycle) contour [4]
was applied to obtain the SAT. Then we subtracted from the original fat map the
SAT in order to have the VAT plus the organs. The VAT is then obtained by a k-means classification of the VAT including
the organs. Finally, the VAT image is clustered into two classes (peri-organ
VAT (pVAT) and deep VAT (dVAT)) using a k-means
approach. The quantities of VAT, SAT, dVAT and pVAT were normalized according
to the Total Adipose Tissue (TAT) and given in g and %. Cardiac fat
segmentation was performed manually using a commercial software QMASS (Medis).Results
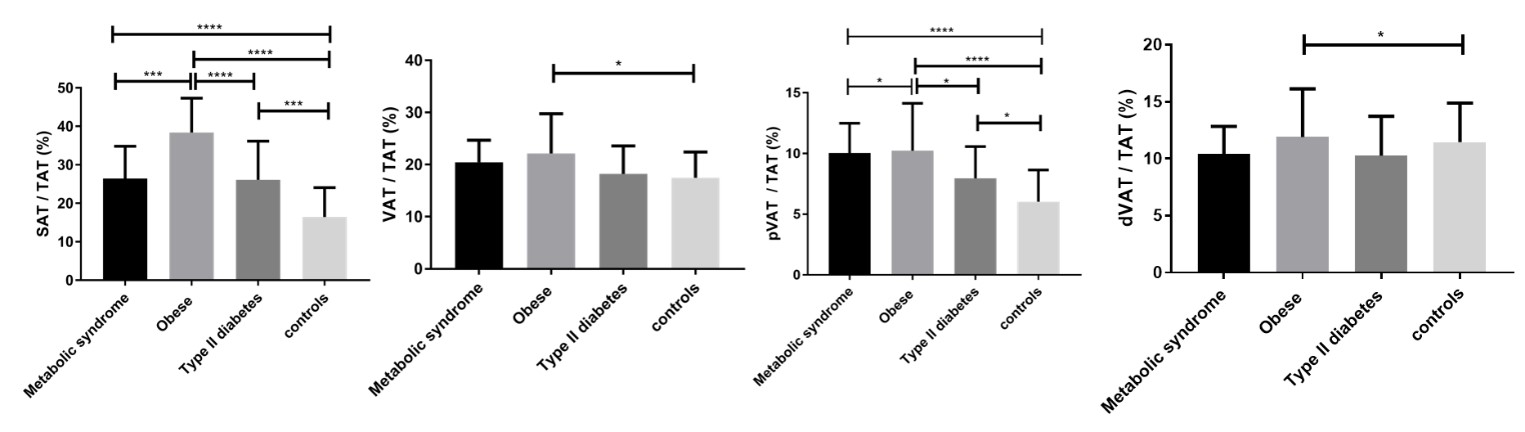
MRI imaging of the trunk was successfully performed in all participants. Four out of 117 images (3.3%) were unusable for the fully automated analysis due to MRI swap-phase artifacts or excessive image noise. Very good intra- and inter-operator reproducibility was obtained for AT segmentation (R²>0.9 and mean coefficient of variation < 4% for all groups). Obese patients exhibited a larger amount of SAT and VAT than the metabolic syndrome, type II diabetes patients and healthy controls (P=0.04). Similarly, obese patients had increased amount of deep VAT than metabolic syndrome, type II diabetes patients and healthy controls (all P<0.03).
The amount of SAT had a tendency to increase with age for all groups except for diabetics where this quantity decreased significantly with age. The amount of VAT, meanwhile, increased significantly with age for diabetics and healthy subjects. Significant differences between all groups were observed in terms of SAT and pVAT amounts (fig.2). The only significant difference observed between obese and healthy controls was for VAT and dVAT. A significant and positive correlation was found between SAT and ejection fraction for all metabolic patients (0.15<R²<0.8, P≤0.05). A significant and positive correlation was observed between VAT and cardiac fat for all groups (0.18<R²<0.2, P≤0.04) except for obese patients (R²=0.13, P=0.17).
Discussion
Accurate and reproducible quantification of the truncular adipose
tissue compartments is crucial for metabolic studies since they serve as good
indicators of metabolic and associated cardiovascular risks. Differential amounts
by subtype of AT may be automatically and reliably quantified by MRI. They may
serve as effective and accurate tool for the diagnosis and differentiation of risk
profiles of patients with metabolic diseases and may be considered in the
future to predict cardiovascular complications. Acknowledgements
This project was supported by EU-FP7 Metacardis.References
[1] G. Thörmer et al., “Software for automated MRI-based quantification of abdominal fat and preliminary evaluation in morbidly obese patients,” J. Magn. Reson. Imaging, vol. 37, no. 5, pp. 1144–1150, 2013.
[2] U. Gurunatha et al., “Limitations of body mass index as an obesity measure of perioperative risk” British Journal of Anaesthesia, Vol 116, no. 3, pp. 319–321, 2016.
[3] S. MacMahon et al., “Body-mass index and cause-specific mortality in 900 000 adults: Collaborative analyses of 57 prospective studies,” Lancet, vol. 373, no. 9669, pp. 1083–1096, 2009.
[4] Y. Shi and W. C. Karl, “A real-time algorithm for the approximation of level-set-based curve evolution,” IEEE Trans. Image Process., vol. 17, no. 5, pp. 645–656, 2008.
Figures