2134
Fast and Robust T1-mapping using Convolutional Neural Networks1Electrical and Computer Engineering, University of Virginia, Charlottesville, VA, United States, 2Medicine, Cardiovascular Division, University of Virginia, Charlottesville, VA, United States, 3Medicine, Cardiovascular Medicine, University of Virginia, Charlottesville, VA, United States, 4Medicine, Radiology and Medical Imaging, University of Virginia, Charlottesville, VA, United States
Synopsis
The pixel-wise nonlinear regression method for T1-mapping is susceptible to noise. We propose a convolutional neural network framework for fast and robust cardiac MRI T1-mapping. A dense type of architecture is used for producing denoised T1-maps. Results show the proposed framework improves PSNR by 6dB compared to the pixel-wise nonlinear regression. The Wilcoxon signed rank test shows a significant reduction in the standard deviation of T1-values produced by the proposed method as compared to nonlinear regression. After training, the time required for producing one T1-map from the undersampled images is 6.45 seconds.
Introduction
Cardiac magnetic resonance T1-mapping enables quantification of diffuse myocardial fibrosis and myocardial infiltration1. Acquiring multiple inversion or saturation recovery images to form maps can be slow, especially for whole heart studies; therefore accelerated acquisition is needed. After acquisition, nonlinear regression is typically used to fit a 3-parameter model for T1-relaxation times. This regression is prone to noise since the fitting procedure is pixel-wise. We propose a deep learning framework involving a convolutional network (CNN) for addressing this issue. This T1-mapping network uses 3x3 kernels to share neighboring pixel information and provide robust fits.Methods
DICOM images of 55 normal subjects scanned on a 1.5T scanner (MAGNETOM Aera, Siemens, Germany) using MOLLI with 8 time points were retrospectively obtained via an approved IRB protocol. The dataset contained both pre (N=150) and post-contrast (N=356) studies. To reconstruct images, we use a deep cascade network2 with 5 data consistency and 10 convolution blocks (d5c10), trained using images from 15 subjects. Images were undersampled by a factor 5 using a random Cartesian mask with Gaussian distribution of the phase encoding lines. A 15x15 patch is cropped from a constant signal intensity region to measure the ground truth noise power. To show improved robustness, noise of this magnitude is halved and added to corrupt the k-space measurements versus the fully sampled image. After taking a zero-filled IFFT of the noisy undersampled k-space, the images are fed into the reconstruction network; the ground truth data remain clean. After sufficient training, the remaining 40 subjects are used for validation and generating nonlinear regression-based maps for evaluation against our CNN method. “DeepT1net” is our T1-mapping network trained to replace nonlinear regression. From the validation set of the reconstruction network, 23 subjects are used for training this network, and the remainder for validation. Subjects with poor quality data are discarded from validation. An architecture similar to DenseNet3 is used: four dense blocks each containing 10 convolutional layers. The complete framework is shown in Figure1. The ground-truth for training the mapping network was generated by fitting the 3-parameter model using a look-locker correction of the apparent T1 values. Pixels with significant fitting errors (root squared error<0.85) are replaced with the median of T1 values in a 3x3 region around each faulty pixel. This same procedure was used for comparing the results of the nonlinear regression against the DeepT1net. Our framework doesn’t require “hole-filling” since it will learn to filter during training. For evaluation, we compute the peak signal to noise ratio (PSNR), mean and standard deviation (SD) of the T1-values in the segmented myocardium for 13 T1-maps. A paired two-tailed Wilcoxon signed-rank test was used to compare the methods.Results
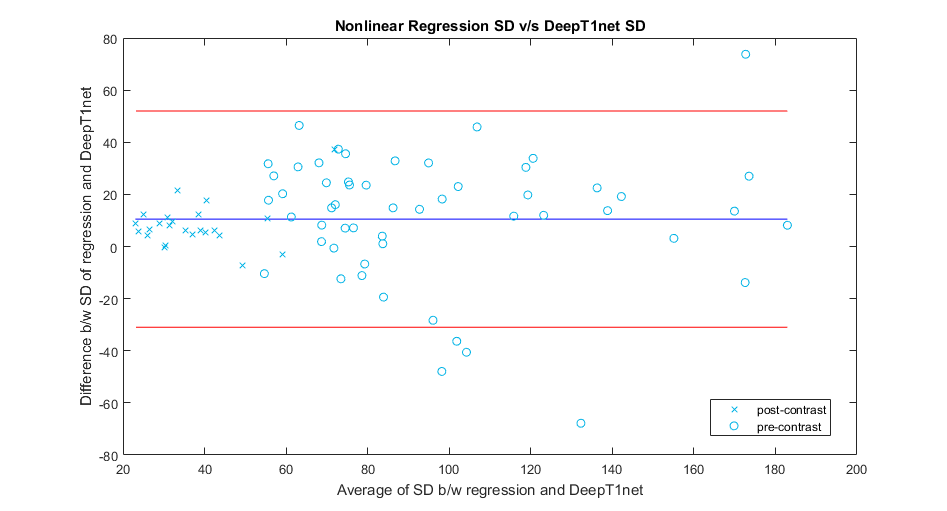
Figure2 shows the reconstruction network performance for a sample case. Comparing reconstructed images (middle row arrows) of the column Im2 and Im3 to their ground truth (bottom row). The CNN reconstructions show significant improvement over the input images. Figure3 compares two T1-maps produced by our framework (second column) against nonlinear regression (first column), for images from the reconstruction network. Noise is visibly higher in the maps generated by regression. The PSNR values achieved by DeepT1net are also higher. We segmented myocardium into 6 regions for computing the mean and SD T1-values for two samples. The average absolute error for means of T1-values produced by the nonlinear regression and the DeepT1net were 8.1727 and 6.505, respectively. The T1 SD values of both methods are analyzed using Bland-Altman plots in Figure5. The positive shift in the blue line indicates that the nonlinear regression method produced T1-values with higher variations than the DeepT1net. The signed-rank test confirmed a significant change in SD with p=0.00125. We did not find a significant change in SD values between DeepT1Net maps and the ground-truth maps. The average PSNR of maps produced by the nonlinear regression and our method were 20.96dB and 26.24dB, respectively. The reconstruction network took 6.45s, while the mapping network took 1.76ms, for generating one T1-map. Training took 12 hours on TitanXp.Conclusion
The results suggest our framework can provide robust T1-values in the presence of noise and at 5X acceleration factors. The total time required by our framework is also reasonably small if the training, which is performed only once, time is excluded. This will be helpful for fast and accurate parameter mapping of multiple slices and whole heart studies. In future, we will perform studies using prospectively undersampled data.Acknowledgements
Authors would like to thank the Jeffress Memorial Trust, NIH, and the UVa. Center for Engineering in Medicine for funding support and Nvidia for providing GPUs.References
[1] Salerno, Michael, and Christopher M. Kramer. "Advances in parametric mapping with CMR imaging." JACC: Cardiovascular Imaging 6.7 (2013): 806-822.
[2] Schlemper, J., Caballero, J., Hajnal, J. V., Price, A. N., & Rueckert, D. (2018). A deep cascade of convolutional neural networks for dynamic MR image reconstruction. IEEE transactions on Medical Imaging, 37(2), 491-503.
[3] Huang, G., Liu, Z., Van Der Maaten, L., & Weinberger, K. Q. (2017, July). Densely Connected Convolutional Networks. In CVPR (Vol. 1, No. 2, p. 3).
Figures