2131
Automatic Cardiac Resting Phase Detection for Static Cardiac Imaging Using Deep Neural Networks1Friedrich-Alexander-Universität Erlangen-Nürnberg, Erlangen, Germany, 2Magnetic Resonance, Siemens Healthcare GmbH, Erlangen, Germany, 3 Siemens Medical Solutions USA, Inc., Princeton, NJ, United States, 4Diagnostikum Berlin, Berlin, Germany
Synopsis
To perform static cardiac imaging, manual inspection of CINE images is currently necessary to detect a quiescent window within the cardiac cycle. We propose an automated system using two chained Deep Neural Networks to determine localized end-systolic and end-diastolic resting phases. The first network finds a region of interest (e.g. RCA, right or left atrium) and the second determines a quantitative motion curve for this region. Training and evaluation was performed on data from volunteers and patients acquired on different scanners and field strengths and a comparison to manually annotated resting phases showed accuracy in the range of 35ms.
Introduction
Static cardiac imaging such as whole-heart coronary imaging requires the determination of a quiescent window within the cardiac cycle for data acquisition, either the end-systolic or end-diastolic resting phase (RP). In current practice, this is done by visual inspection of a CINE image series, e.g. the four-chamber-view (4CHV) and requires user experience. A further complicating factor for the detection of RPs is that different cardiac anatomies rest at different times of the cardiac cycle, so ideally a localized RP for the anatomy of interest should be determined. A previously published approach1 has demonstrated automated RP detection, but this method computes RPs based on the entire field-of-view and does not provide localized RPs for specific anatomies. In this study, we investigate a new automated system which detects the RPs for several localized regions of the heart without manual user interaction.
Methods
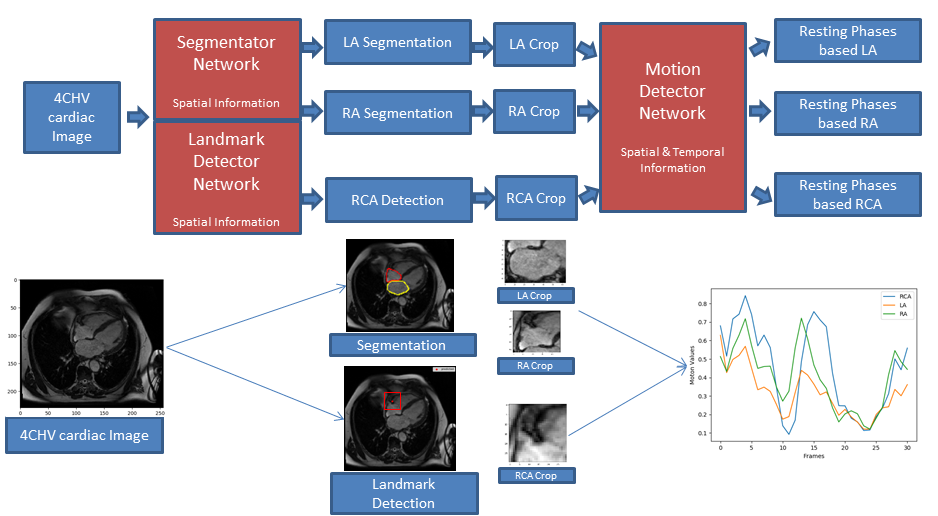
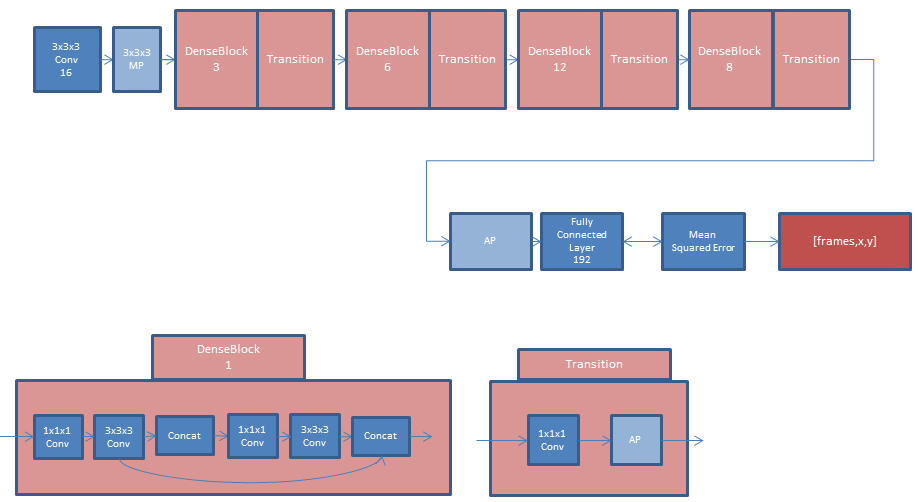
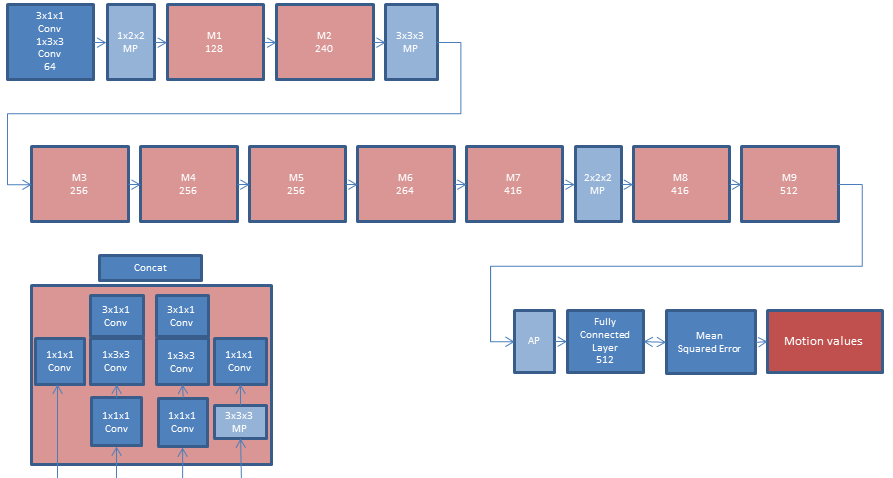
System Overview: The proposed prototype system (Figure 1) consists of two chained Deep Neural Networks. While the first network identifies regions of interest (ROIs) in a 4CHV either by landmark detection or segmentation, the second performs motion detection within each ROI. As a preprocessing step, all images were interpolated to a fixed spatial and temporal resolution of 224x224x32 to be resolution-independent. The first network provided landmarks or segmentations from which rectangular ROIs were derived. The model for landmark detection is shown in Figure 2 and segmentation used a state-of-the-art U-net2. For landmark-based ROIs, prior knowledge about the size of the anatomy was used to define a bounding box centered at the landmark position. For segmentation-based ROIs, the tightest fitting rectangular bounding box enclosing the contours was selected. In this abstract, we focused on landmark detection for the right coronary artery (RCA) and segmentation of the right atrium (RA) and left atrium (LA). The second network used the ROIs at each time point as input and computed a motion curve with one motion value per time point, see Figure 3. Ground truth motion values were derived from the ROIs by performing image registration3 and averaging the magnitudes of the motion vectors within the ROI.
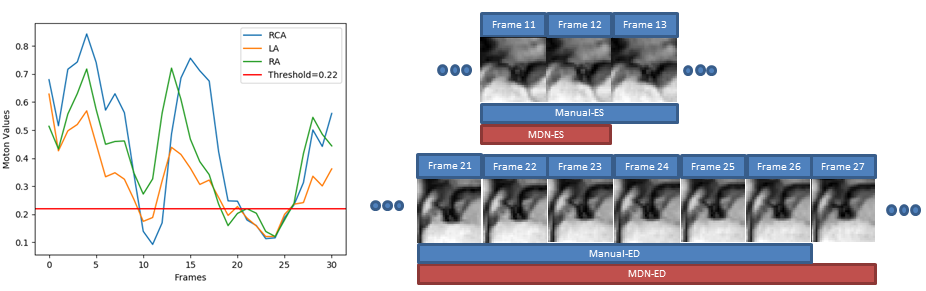
Classification of RPs: Manual annotation of RPs was performed on 21 datasets. These were then used for the calculation of sensitivity and specificity in order to obtain a threshold for RP detection. Since the motion curve describes the average motion in millimeters, RPs could then be determined with an absolute threshold, e.g. $$$<\,0.2\,\textrm{mm}$$$ average motion (Figure 4).
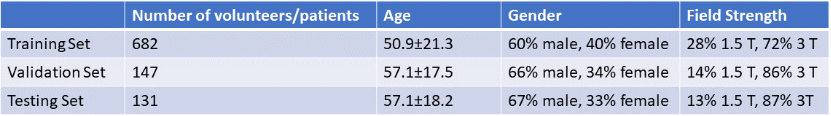
Experiments: The two networks were trained and evaluated on 4CHV CINE datasets from 960 volunteers/patients acquired on $$$1.5\,\textrm{T}$$$ and $$$3\,\textrm{T}$$$ clinical MRI scanners (MAGNETOM Avanto, Trio, Aera, Skyra; Siemens Healthcare, Erlangen, Germany). The full dataset was split into $$$70\,\textrm{%}$$$ training, $$$15\,\textrm{%}$$$ validation and $$$15\,\textrm{%}$$$ testing data subsets. Statistics for each subset are given in Figure 5. For RCA detection, the 3D-DenseNet was validated by calculating the mean and standard deviation of the distance of ground truth and detected landmarks for each time point. For motion detection, the MDN was validated by calculating the root-mean-squared error (RMSE) between the predicted motion curves and the ground truth. Additionally, the RMSE for start and end points of manually annotated and automatically detected RPs for the RCA in milliseconds was computed.
Results
For RCA detection, the mean error was $$$7.2\,\pm\,1.5\,\textrm{mm}$$$. The RMSE of the MDN motion curve was $$$0.12\,\pm\,0.06\,\textrm{mm}$$$. The RMSE for start and end points was $$$35\,\pm\,17\,\textrm{ms}$$$ and $$$30\,\pm\,18\,\textrm{ms}$$$ (end-systolic RP) and $$$36\,\pm\,17\,\textrm{ms}$$$, $$$37\,\pm\,16\,\textrm{ms}$$$ (end-diastolic RP). Sensitivity and specificity for the test sets were $$$78\,\textrm{%}$$$ and $$$92\,\textrm{%}$$$. Qualitative results of the first and second network are shown in Figures 1 and 4, respectively.Discussion
The automatic RCA detection was sufficiently accurate to find a bounding box for motion detection. In addition, the proposed MDN showed a good match between expert-annotated and automatically detected RPs. Compared to a previous automated RP detection approach1, this method is an improvement both in terms of localization of the RPs, as well as providing a quantitative motion curve which enables the use of an interpretable threshold for RP classification. While we focused on RCA, LA and RA, this approach can be extended to detect other anatomies.Conclusion
Automated RP detection for multiple ROIs in 4CHV images was successfully performed with high accuracy by the proposed system. Future work will focus on evaluating further anatomical structures as well as clinical validation.Acknowledgements
No acknowledgement found.References
1. Piccini, Davide, et al. Automated Cardiac Resting Phase Detection in 2D cine MR images for Acquisition Window Selection in High-Resolution Coronary MRI. Prod. Intl. Soc. Mag. Reson. Med. 25 (2017) 2862
2. Ronneberger, Olaf, et al. U-net: Convolutional networks for biomedical image segmentation. International Conference on Medical image computing and computer-assisted intervention. Springer, Cham, 2015.
3. Chefd'hotel C, et al. Flows of Diffeomorphisms for Multimodal Image Registration. In: 2000 IEEE International Symposium on Biomedical Imaging, July 7–10, 2002, Washington D.C., USA. pp 753–756.
4. Huang, Gao, et al. Densely Connected Convolutional Networks. CVPR. Vol. 1. No. 2. 2017.
5. Xie, Saining, et al. Rethinking spatiotemporal feature learning: Speed-accuracy trade-offs in video classification. Proceedings of the European Conference on Computer Vision (ECCV). 2018.
6. Kingma, Diederik P., et al. Adam: A method for stochastic optimization. arXiv preprint arXiv:1412.6980 (2014).
7. Robbins, Herbert, et al. A stochastic approximation method. Herbert Robbins Selected Papers. Springer, New York, NY, 1985. 102-109.
Figures