2125
Transfer Learning Based Automated Myocardial T2 and Extracellular Volume Quantification1Paul C. Lauterbur Research Center for Biomedical Imaging, Shenzhen Institutes of Advanced Technology, Chinese Academy of Sciences, Shenzhen, China, 2Department of Medicine (Cardiovascular Division), Beth Israel Deaconess Medical Center and Harvard Medical School, Boston, MA, United States
Synopsis
Manual analysis of myocardial tissue mapping is time consuming. Deep learning has a potential to facilitate the analysis but requires big training datasets. In this study, a deep fully convolutional neural network, trained using native T1 mapping dataset, is used for T2 and extracellular volume (ECV) quantification based on transfer learning. We prospectively acquired T2 (401 patients) and ECV maps (381 patients) to access the network performance. Compared with the manually analyzed reference values, the transfer learning-based automated analysis platform shows good performance for myocardial T2 and ECV mapping. The platform has potential to fully automate myocardial tissue mapping.
Introduction
Myocardial tissue mapping is useful in diagnosis and prognosis of cardiac diseases [1]. However, T1, T2, and extracellular volume (ECV) are often measured manually by an experienced observer in analyzing the myocardial tissue mapping data. This process is time consuming and negatively impacts the reproducibility and standardization of measurements. Deep learning based technique has a potential to facilitate analyzing cardiovascular images [2]. We recently developed a deep learning-based analysis platform for automating native myocardial T1 mapping analysis. This approach utilizes a deep fully convolutional neural network (FCN) to automate T1 measurements from T1-weighted images. Similar network architecture could potentially automate other tissue parameters, such as ECV or T2 mapping. However, this requires a new labeled dataset and a dedicated neural network for each individual parameter and sequence, which is not clinically feasible. In this study, we sought to evaluate the performance of the pre-trained FCN using native T1 mapping dataset for automating T2 and ECV measurements analysis, a concept referred to as transfer learning.Methods
Figure 1 shows the flowchart of the automated analysis platform. The FCN is used for myocardium segmentation. It was designed based on U-Net architecture [3] with total of 149 operational layers, including batch normalization, convolutional, rectified-linear, and dropout layers. The training and testing dataset includes 11550 native T1-weighted images (210 patients) with different inversion times from native myocardial T1 mapping. The FCN is implemented using TensorFlow deep learning framework (Google, USA) and trained for 48 hours on an Intel Core i7-6700K CPU workstation with NVIDIA GeForce GTX Titan 12GB GPU. In this study, this pre-trained FCN is used for automating T2 and ECV quantification based on transfer learning. Patients with known or suspected cardiovascular disease referred for a clinical CMR exam were prospectively recruited. All experiments were approved by the Institutional Review Board (IRB) and the written informed consent was obtained from each patient. All imaging experiments were performed using a 1.5T Philips Achieva system (Philips Healthcare, Best, The Netherlands) with a 32-channel cardiac coil. We acquired T2 maps in 401 patients (256 male; age: 55±15 years) using slice-interleaved myocardial T2 mapping sequence [4] and ECV maps in 381 patients (250 male; age: 55±15 years) using slice-interleaved myocardial T1 mapping sequence [5]. Accuracy of the automatic measurements was assessed by comparing with the reference values from manual analysis. Manual analysis was performed by an experienced reader (a cardiologist with 8-year experience in CMR) using an in-house myocardial tissue mapping analysis tool (including image registration, curve fitting, and manual analysis) implemented on Matlab R2009 (The MathWorks, Natick, MA). Pearson correlation coefficient (R) and Bland-Altman analysis were used to assess agreement between automated and manual analyses on per-patient, per-slice, and per-segment analyses.Results
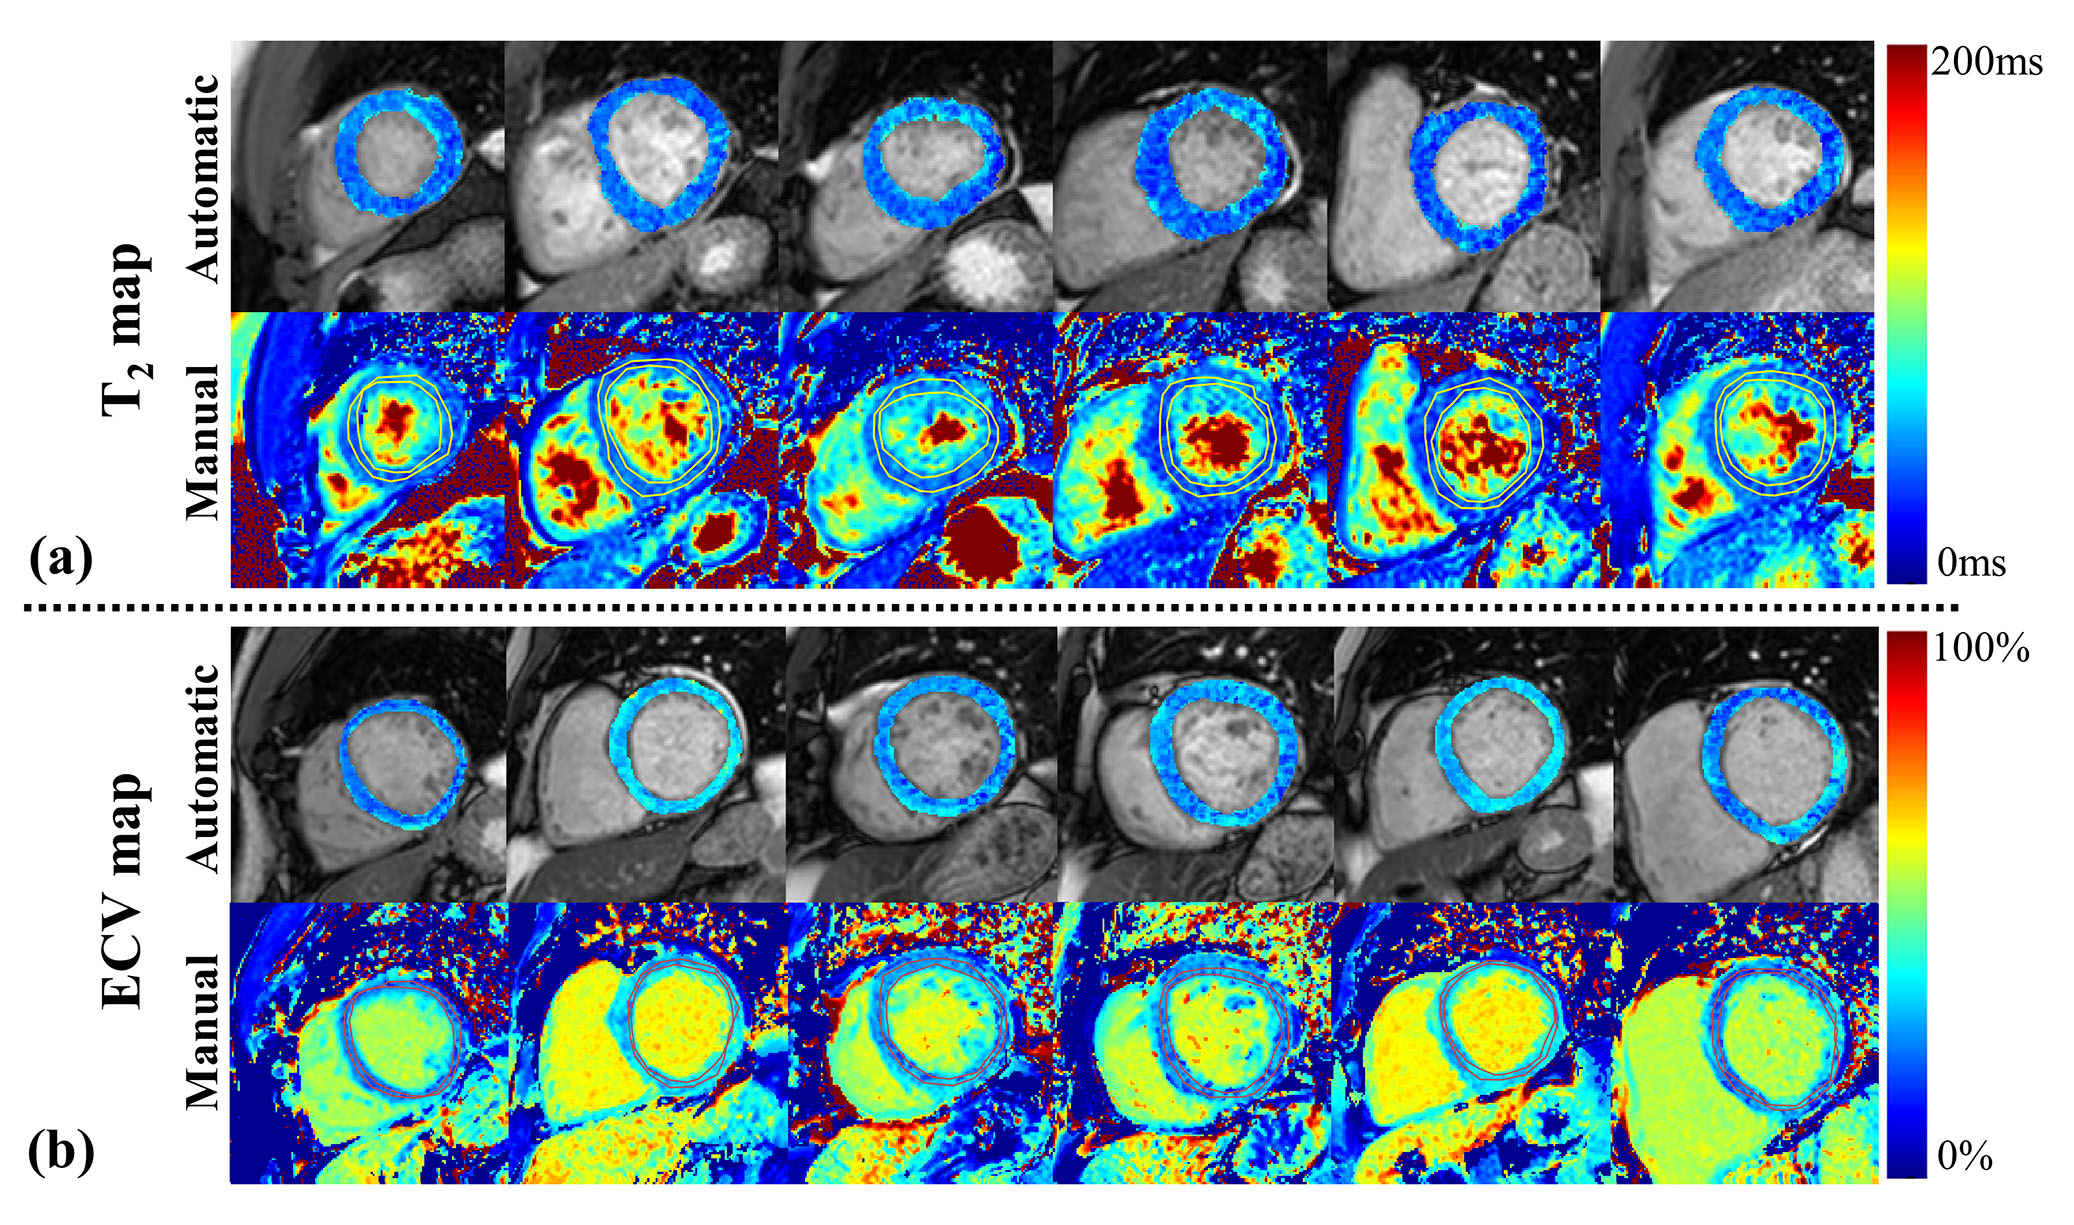
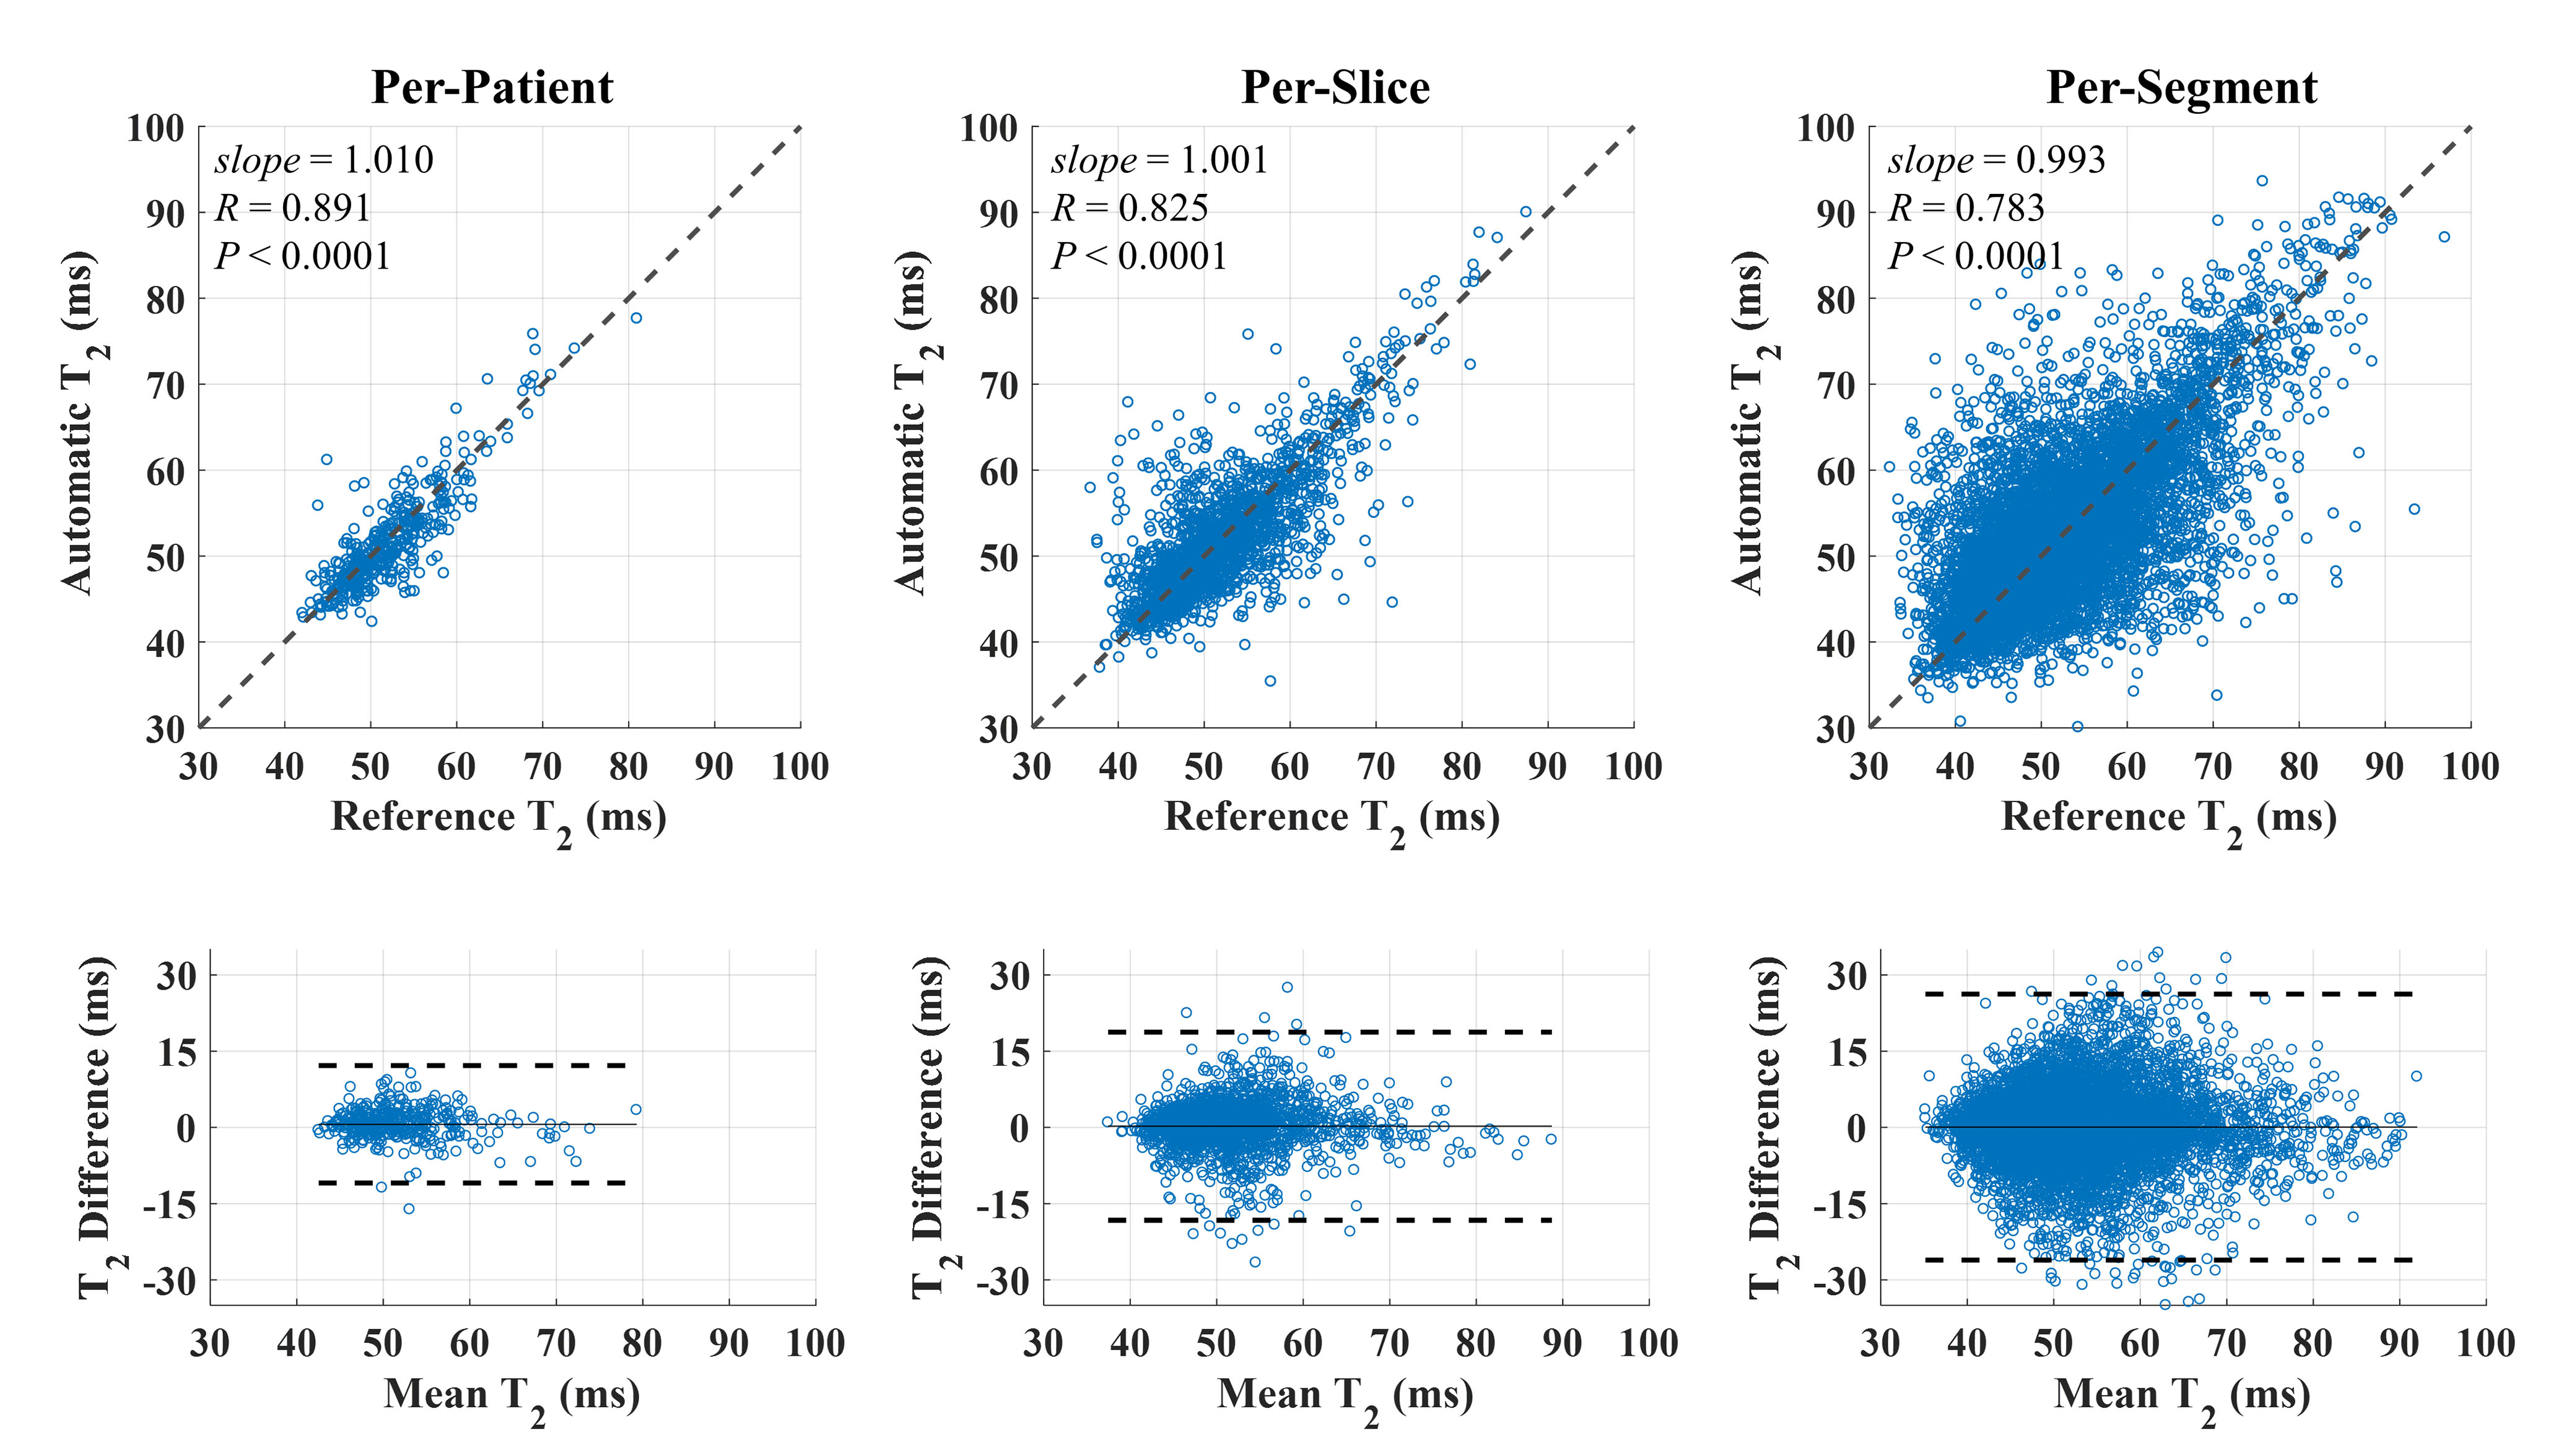
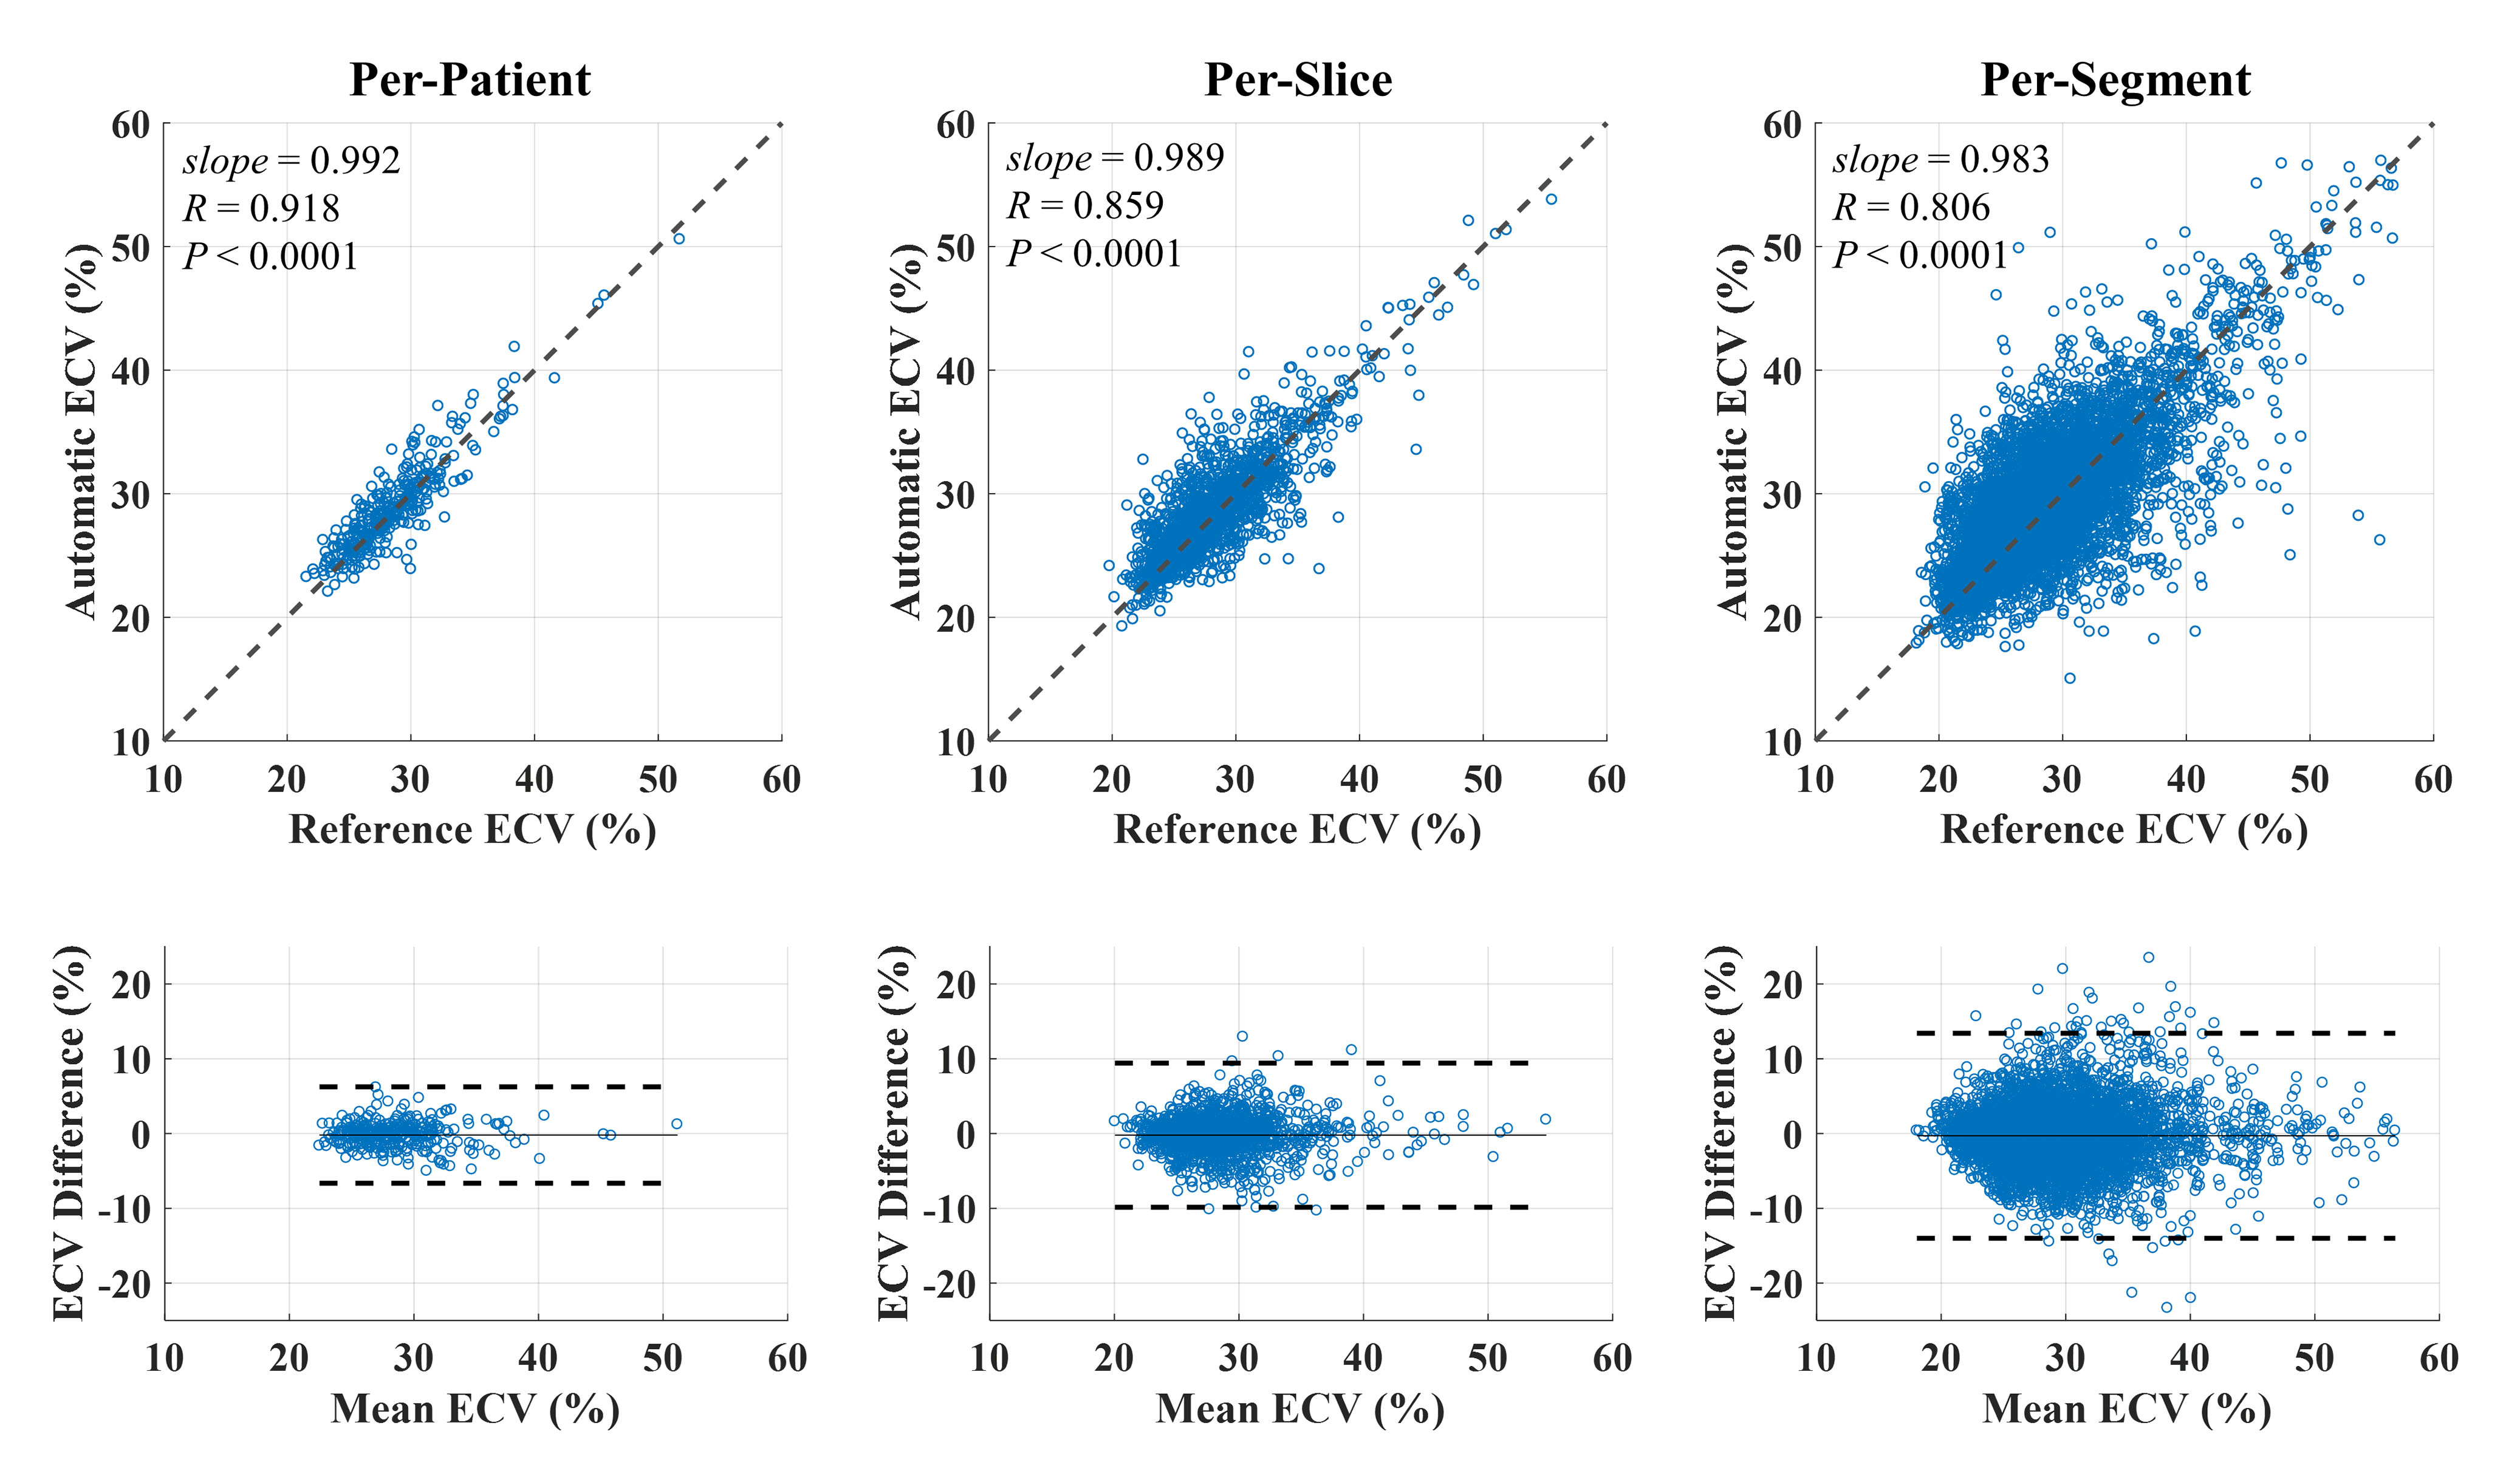
Figure 2 shows representative T2 and ECV maps reconstructed using the automated platform and corresponding manually analyzed maps. Automatic T2 measurement showed a strong correlation with the manual T2 in per-patient (390 patients: R = 0.891, slope = 1.010, P < 0.0001), per-slice (1873 slices: R = 0.825, slope = 1.001, P < 0.0001), and per-segment (9701 segments: R = 0.783, slope = 0.993, P < 0.0001) analyses (Figure 3, top row). Automatic and manual T2 were in good agreement in per-patient (0.6 ± 5.9 ms, 95% Confidence Interval (CI): -10.9~12.2 ms), per-slice (0.2 ± 9.4 ms, CI: -18.3~18.7 ms), and per-segment T2 (0.1 ± 13.4 ms, CI: -26.1~26.2 ms) analyses (Figure 3, bottom row). Automatic ECV measurements showed a strong correlation with the manual ECV in per-patient (319 patients: R = 0.918, slope = 0.992, P < 0.0001), per-slice (1489 slices: R = 0.859, slope = 0.989, P < 0.0001), and per-segment (8384 segments: R = 0.806, slope = 0.983, P < 0.0001) analyses (Figure 4, top row). The automatic and manual ECV values were in good agreement in per-patient (-0.2 ± 3.2%, CI: -6.6~6.3%), per-slice (-0.2 ± 4.9%, CI: -9.8~9.4%), and per-segment ECV (-0.3 ± 7.0%, CI:-14.0~13.4%) analyses. Table 1 shows the total patient, slice, and image numbers as well as the corresponding successful rates using the automated analysis for myocardial T2 and ECV mapping (Figure 4, bottom row).Conclusion
The transfer learning-based automated analysis platform shows good performance for myocardial T2 and ECV mapping and has potential to fully automate myocardial tissue mapping, allowing standardization of data analysis. Further studies are warranted to evaluate the performance of this technique for myocardial tissue maps acquired at different field strengths and from different vendors.Acknowledgements
No acknowledgement found.References
[1]. Messroghli DR, et.al., Clinical recommendations for cardiovascular magnetic resonance mapping of T1, T2, T2* and extracellular volume: A consensus statement by the Society for Cardiovascular Magnetic Resonance (SCMR) endorsed by the European Association for Cardiovascular Imaging (EACVI). J Cardiovasc Magn Reson 2017;19(1):75.
[2]. Henglin M, Stein G, Hushcha PV, Snoek J, Wiltschko AB, Cheng S. Machine Learning Approaches in Cardiovascular Imaging. Circ Cardiovasc Imaging 2017;10(10).
[3]. Olaf Ronneberger PF, Thomas Brox. U-Net: Convolutional Networks for Biomedical Image Segmentation. arXiv: 150504597 2015.
[4]. Basha TA, et.al., Free-breathing slice-interleaved myocardial T2 mapping with slice-selective T2 magnetization preparation. Magn Reson Med 2016;76(2):555-565.
[5]. Weingärtner S, et.al., Free-breathing multislice native myocardial T1 mapping using the slice-interleaved T1 (STONE) sequence. Magn Reson Med 2015;74(1):115-124.
Figures