2107
Fast and reproducible right ventricular longitudinal strain is a sensitive marker of pulmonary arterial hypertensionShuang Leng1, Yang Dong2, Xiaoke Shang3, Xiaodan Zhao1, Ru-San Tan1,4, Wen Ruan1, Gangcheng Zhang5, John C. Allen4, Angela S. Koh1,4, Bryant Jennifer1, Lynette Teo6,7, Ping Chai7,8, James W. Yip7,8, Jonathan Yap1, Soo Teik Lim1,4, Marielle V Fortier4,9, Teng Hong Tan4,9, Ju Le Tan1,4, Yucheng Chen2, and Liang Zhong1,4
1National Heart Centre Singapore, Singapore, Singapore, 2West China Hospital, Chengdu, China, 3Wuhan Union Hospital, Wuhan, China, 4Duke-NUS Medical School, Singapore, Singapore, 5WuHan Asia Heart Hospital, Wuhan, China, 6National University Hospital, Singapore, Singapore, 7National University of Singapore, Singapore, Singapore, 8National University Heart Centre, Singapore, Singapore, 9KK Women's and Children's Hospital, Singapore, Singapore
Synopsis
Survival of patients with pulmonary arterial hypertension (PAH) is closely related to right ventricular (RV) function. This study aims to introduce a fast global longitudinal strain (GLS) measurement for RV function assessment by automatically tracking the distance variation between tricuspid annular insertion points and the RV apical epicardium. The intra- and inter-observer variation of coefficients range from 3.9% to 5.7% with processing time averaging 32 ± 8 seconds per subject. Results demonstrate that lower fast GLS measurements are closely related to impaired RV function and higher risks in PAH.
Background and Purpose
Pulmonary arterial hypertension (PAH) is characterized by progressive elevation of pulmonary artery pressure (PAP) and pulmonary vascular resistance (PVR). Although changes in the pulmonary vasculature are the primary cause of PAH, survival of patients with PAH is closely related to right ventricular (RV) function.1 The assessment of RV function is challenging due to the complex geometric shape of the RV and existence of prominent trabeculations. The aim of this study is to assess the RV global longitudinal strain (GLS) in PAH using a fast semi-automated strain measurement approach with cine cardiovascular magnetic resonance (CMR) images.Methods
Sixty-one patients (38 ± 16 years, female/male: 49/12) with clinically diagnosed PAH and 61 age- and gender-matched normal controls were enrolled. PAH is defined hemodynamically as having1 1) mean PAP ≥ 25 mmHg; 2) pulmonary artery wedge pressure (PAWP) ≤ 15 mmHg; and (3) PVR > 3 Wood units. Patients were classified as low risk, intermediate risk or high risk according to cut-off values for World Health Organization functional class, six-minute walking distance, N-terminal pro-brain natriuretic peptide (NT-proBNP) level, right atrial area, right atrial pressure (RAP), and cardiac index.1 All subjects underwent CMR scan on a 3T system (Ingenia, Philips Healthcare). End-expiratory breath hold cine images were acquired in multiple standardized planes including the short-axis (SA) views and long-axis 4-chamber view. RV end-diastolic and end-systolic volumes (EDV, ESV) and ejection fraction (EF) were calculated with Simpson’s rule in all SA planes. The fast RV longitudinal strain parameters were measured using an in-house semi-automated algorithm2-7 that tracked, on long-axis 4-chamber view, the distance ($$$L$$$) between the tricuspid valve insertion points (septal and free wall) and the RV apical epicardium (Fig. 1A). The strain of each wall at time point ($$$t$$$) relative to RV end-diastole (time 0) was measured based on the distance variation: $$$\frac{\left(L(t)-L_{0}\right)\times100}{L_{0}}$$$. Peak systolic RV GLS was obtained at $$$t$$$ equal to RV end-systole, and the corresponding peak GLS rate (GLSR) was derived (Fig. 1B). GLS and GLSR measurements from the RV septal and free wall were then averaged to obtained mean results for analysis. In addition, peak systolic tricuspid annular velocity (Sm) and displacement (TAPSE) were calculated based on the tracking of tricuspid annular points.2 Student’s t test was used for comparison between groups; p < 0.05 denotes statistical significance.Results
The fast RV GLS assessment was feasible in all subjects. Average processing time per subject was 32 ± 8 seconds. Intra-observer coefficient of variation (CV) was 3.9% and 5.3% for GLS and GLSR, with corresponding inter-observer CVs of 4.4% and 5.7%, respectively. RV longitudinal strain and strain rate were significantly impaired in PAH group compared with the normal controls (GLS: -14.1 ± 4.4% vs -23.4 ± 3.3%; GLSR: -0.87 ± 0.28 s-1 vs. -1.18 ± 0.25 s-1, both p < 0.001). Furthermore, patients in the high-risk group had much lower RV GLS and GLSR measurements compared with those in the low- and intermediate-risk groups (Table 1). Receiver operating characteristics (ROC) analysis demonstrated that the fast GLS had higher diagnostic accuracy to differentiate PAH from normal controls compared to conventional parameter such as RVEF. The following cut-off values could be defined to identify diseased states: -20.3% for GLS (area under the ROC curve (AUC) = 0.951, sensitivity = 93%, specificity = 83%); -1.01 s-1 for GLSR (AUC = 0.806, sensitivity = 76%, specificity = 75%); 50% for RVEF (AUC = 0.837, sensitivity = 70%, specificity = 90%). In the PAH patient group, lower RV GLS correlated with higher RAP (r = -0.39, p < 0.05), RV EDV index (r = -0.33, p < 0.05) and NT-proBNP (r = -0.46, p < 0.001). Reduced RV GLS was also associated with lower RVEF (r = 0.51, p < 0.001), Sm velocity (r = 0.50, p < 0.001) and TAPSE (r = 0.68, p < 0.001) in PAH patients.Conclusion
The fast semi-automated RV longitudinal strain enables a reproducible and accurate evaluation of RV function. RV GLS was markedly reduced as the PAH risk class progressed from low to high. This finding suggested that the fast GLS may represent a more useful non-invasive imaging index of RV function than standard RV indices and may be applied clinically for earlier detection and monitoring of RV dysfunction in PAH.Acknowledgements
This study received funding support from the National Medical Research Council of Singapore (NMRC/OFIRG/0018/2016; NMRC/TA/0031/2015), Hong Leong Foundation, Duke-NUS Medical School and the Estate of Tan Sri Khoo Teck Puat.References
- Galiè N, Humbert M, Vachiery JL, et al. 2015ESC/ERS Guidelines for the diagnosis and treatment of pulmonary hypertension: The Joint Task Force for the Diagnosis and Treatment of Pulmonary Hypertension of the European Society of Cardiology (ESC) and the European Respiratory Society (ERS). Endorsed by: Association for European Paediatric and Congenital Cardiology (AEPC), International Society for Heart and Lung Transplantation (ISHLT). Eur Heart J. 2016;37:67-119.
- Leng S, Jiang M, Zhao XD, et al. Three-dimensional tricuspid annular motion analysis from cardiac magnetic resonance feature-tracking. Ann Biomed Eng. 2016;44:3522-3538.
- Leng S, Zhao XD, Huang FQ, et al. Automated quantitative assessment of cardiovascular magnetic resonance-derived atrioventricular junction velocities. Am J Physiol Heart Circ Physiol. 2015;309:H1923-H1935.
- Leng S, Zhang S, Jiang M, et al. Imaging 4D morphology and dynamics of mitral annulus in humans using cardiac cine MR feature tracking. Sci Rep. 2018;8:81.
- Leng S, Zhao XD, AS Koh, et al. Age-related changes in four-dimensional CMR-derived atrioventricular junction velocities and displacements: implications for the identification of altered annular dynamics for ventricular function assessment. Int J Cardiol Heart Vasc. 2018, in press.
- Leng S, Tan RS, Zhao XD, Allen JC, Koh AS, Zhong L. Validation of a rapid semi-automated method to assess left atrial longitudinal phasic strains on cine cardiovascular magnetic resonance imaging. J Cardiovasc Magn Reson. 2018;20:71.
- Koh AS, Gao F, Leng S, et al. Dissecting clinical and metabolomics associations of left atrial phasic function by cardiac magnetic resonance feature tracking. Sci Rep. 2018;8:8138.
Figures
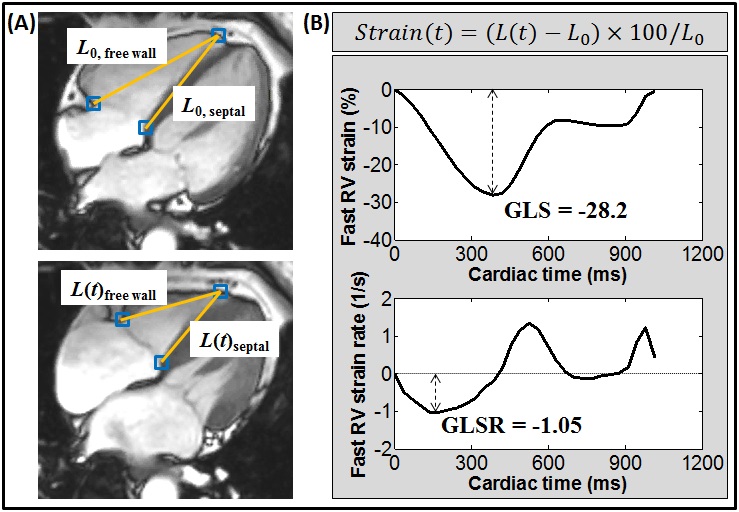
Figure
1. Fast right
ventricular (RV) strain and strain rate measurement in four-chamber view. (A)
Squares denote the tricuspid valve insertion points (septal and free wall) and RV
apical epicardium that were tracked automatically throughout the cardiac cycle. L denotes the distance. (B) Derivation of strain
and strain rate curves for each of the 2 walls (septal and free wall) in four-chamber
view by the time variation of distance L.
GLS: global longitudinal strain; GLSR: global longitudinal strain rate.
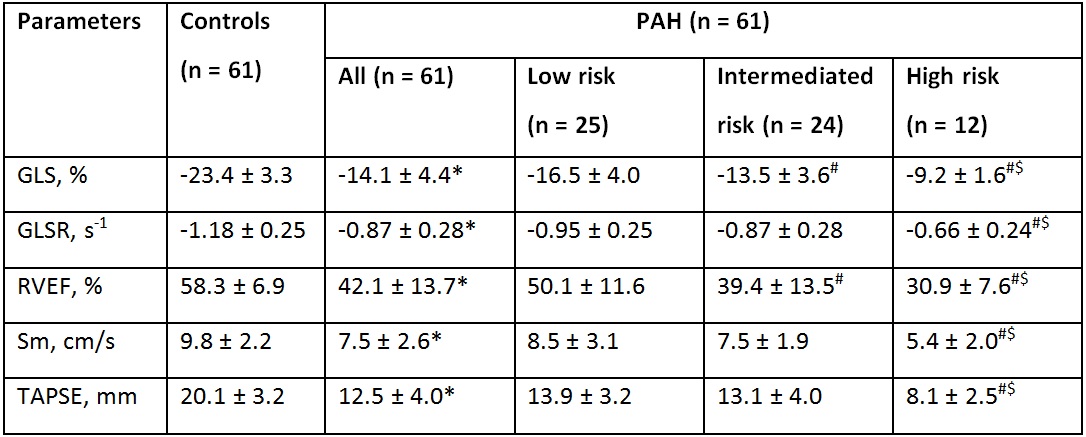
Table
1. Comparison
of fast right ventricular global longitudinal strain and strain rate
measurements in PAH and normal controls. Data
are represented as mean ± SD. PAH: pulmonary arterial hypertension; GLS: global
longitudinal strain; GLSR: global longitudinal strain rate; RVEF: right
ventricular ejection fraction; Sm: peak tricuspid annular systolic velocity; TAPSE:
tricuspid annular plane systolic excursion. *significant difference between
controls and PAH; #significant
difference compared to PAH with low risk; $significant difference compared
to PAH with intermediate risk.