2104
Estimating Aggregate Cardiomyocyte Shortening Using Diffusion and Displacement Encoded MRI1Radiological Sciences Laboratory, Stanford University, Stanford, CA, United States, 2Radiological Sciences, University of California - Los Angeles, Los Angeles, CA, United States
Synopsis
Orientation and deformation changes of left ventricular cardiomyocyte aggregates (“myofibers”) underlie many forms of cardiovascular disease. In vivo cardiomyocyte aggregate shortening (Eff) has mechanistic significance, but there exists no established technique to measure in vivo Eff. We present a pipeline to compute Eff by combining multi-slice Displacement Encoded with Stimulated Echoes (DENSE) MRI and in vivo cardiac Diffusion Tensor Imaging (cDTI) data. We show that Eff computed in healthy swine has decreased transmural variability compared to radial and circumferential strains. The spatial uniformity and mechanistic significance of Eff make it a compelling candidate for early detection of cardiac dysfunction.
Introduction
Changes in the orientation and deformation of left ventricular (LV) cardiomyocyte aggregates (i.e. “myofibers”) underlie many forms of cardiovascular disease (e.g., dilated cardiomyopathy1 and hypertrophic cardiomyopathy2). Global metrics of LV function, such as ejection fraction, are mainstays in the diagnosis of cardiovascular disease, but provide no tissue-level insights into the mechanisms of LV dysfunction. At the tissue level, cardiomyocyte aggregate shortening is the functional basis for gross heart contraction. Despite its mechanistic significance, however, there exists no established technique to measure in vivo cardiomyocyte performance.
Regional myocardial motion can be characterized at high spatial resolution using Displacement ENcoded with Stimulated Echoes (DENSE) MRI, a technique that encodes tissue displacement into the phase of the complex MRI signal. DENSE motion data is typically characterized along an anatomically defined coordinate system, e.g., circumferential (Ecc), radial (Err), and longitudinal (Ell) strains3. However, recent advances4,5 in cardiac Diffusion Tensor Imaging (cDTI) allow imaging of in vivo cardiomyocyte aggregate orientations, which enables estimating “myofiber” strain (Eff).
Previous work in our group has measured in vivo Eff using single-slice DENSE and cDTI data6,7. However, using single-slice DENSE displacement data requires the incorporation of mathematical assumptions to compute Eff, which may confound in vivo estimates. The objectives of this work were: 1) to directly compute in vivo Eff without mathematical assumptions using multi-slice DENSE MRI and cDTI data; and 2) to compare the spatial uniformity of Eff with anatomically defined metrics of cardiac strain.
Methods
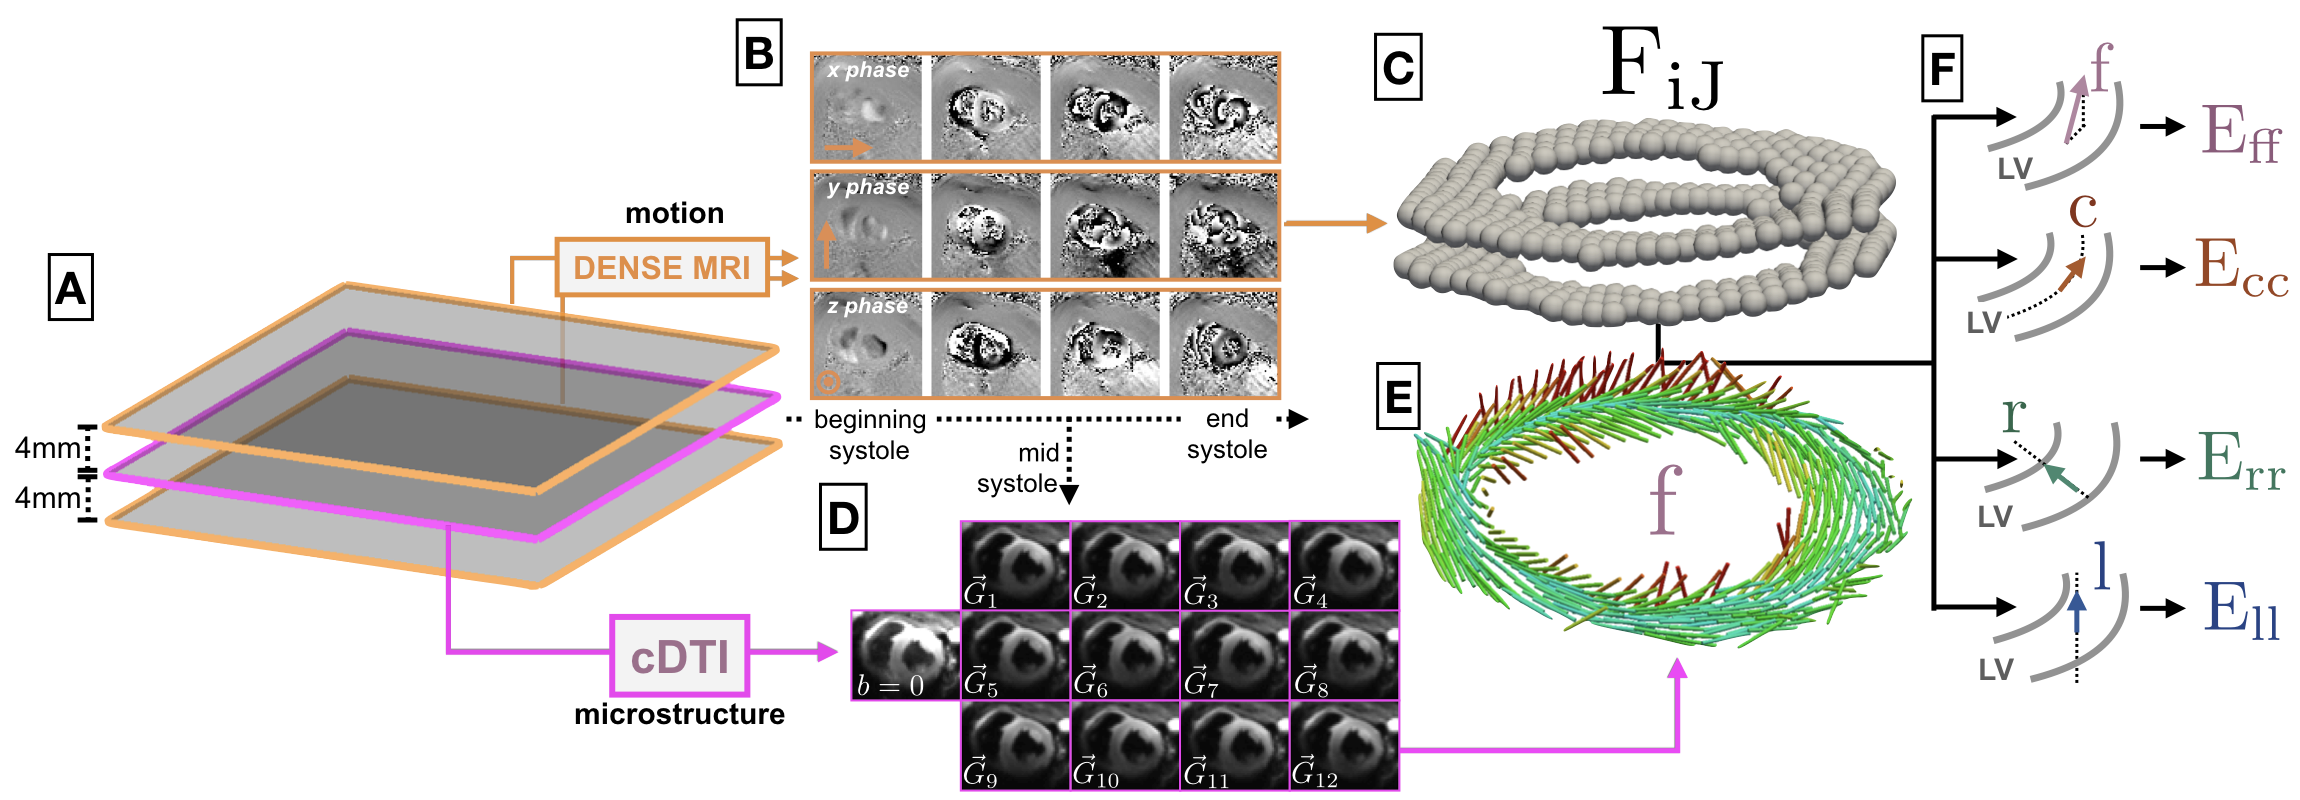
cDTI Acquisition – CINE DENSE MRI and cDTI data were acquired in healthy swine (N=8) at 3T (Prisma, Siemens). LV microstructure was measured with in vivo cDTI at a single mid-ventricular slice location (Fig. 1A) at mid-systole using a CODE motion compensated gradient waveform4: 2x2x5mm, TE/TR=74/4000ms, b-value=0,350s/mm2, Navg=30, Ndir=12. At each cDTI voxel, the preferential cardiomyocyte aggregate orientation was defined as the primary eigenvector of the reconstructed diffusion tensors (Fig. 1D-E).
DENSE Acquisition – LV displacements were captured at two short-axis locations spaced 4mm above and below the cDTI data9 (Fig. 1A) using a DENSE MRI sequence: 15ms view-shared temporal resolution (29-39 cardiac phases depending on R–R interval), 2.5x2.5x8mm voxel size, balanced 4-point phase encoding in x,y,z, TE/TR=1.04/15ms, ke=0.08cycles/mm, Navg=3, spiral interleaves=10. Using an open-source MatLab tool8, the measured x, y and z phase data were spatiotemporally unwrapped to yield voxel-wise, time-resolved Lagrangian LV displacements (Fig. 1B-C).
DENSE + cDTI Analysis – The DENSE displacement field surrounding the cDTI data was interpolated and differentiated to the location of cDTI LV voxels using the mesh-free scheme outlined in Arroyo and Ortiz10. The deformation gradient tensor (F) for all imaged cardiac phases was computed at the center of each voxel in the cDTI LV image. The determinant of F was used to evaluate tissue incompressibility. Strains at each point were computed as:
$$$E_{vv}$$$ = $$$\frac{1}{2}$$$ ($$$\mathbf{v}$$$ $$$\cdot$$$ $$$\mathbf{C}$$$ $$$\mathbf{v} - 1$$$)
where C=FTF and v represents the direction along which the strain is computed, i.e., circumferential (Ecc), radial (Err), longitudinal (Ell), and cardiomyocyte (Eff) (Fig. 1F).
Results
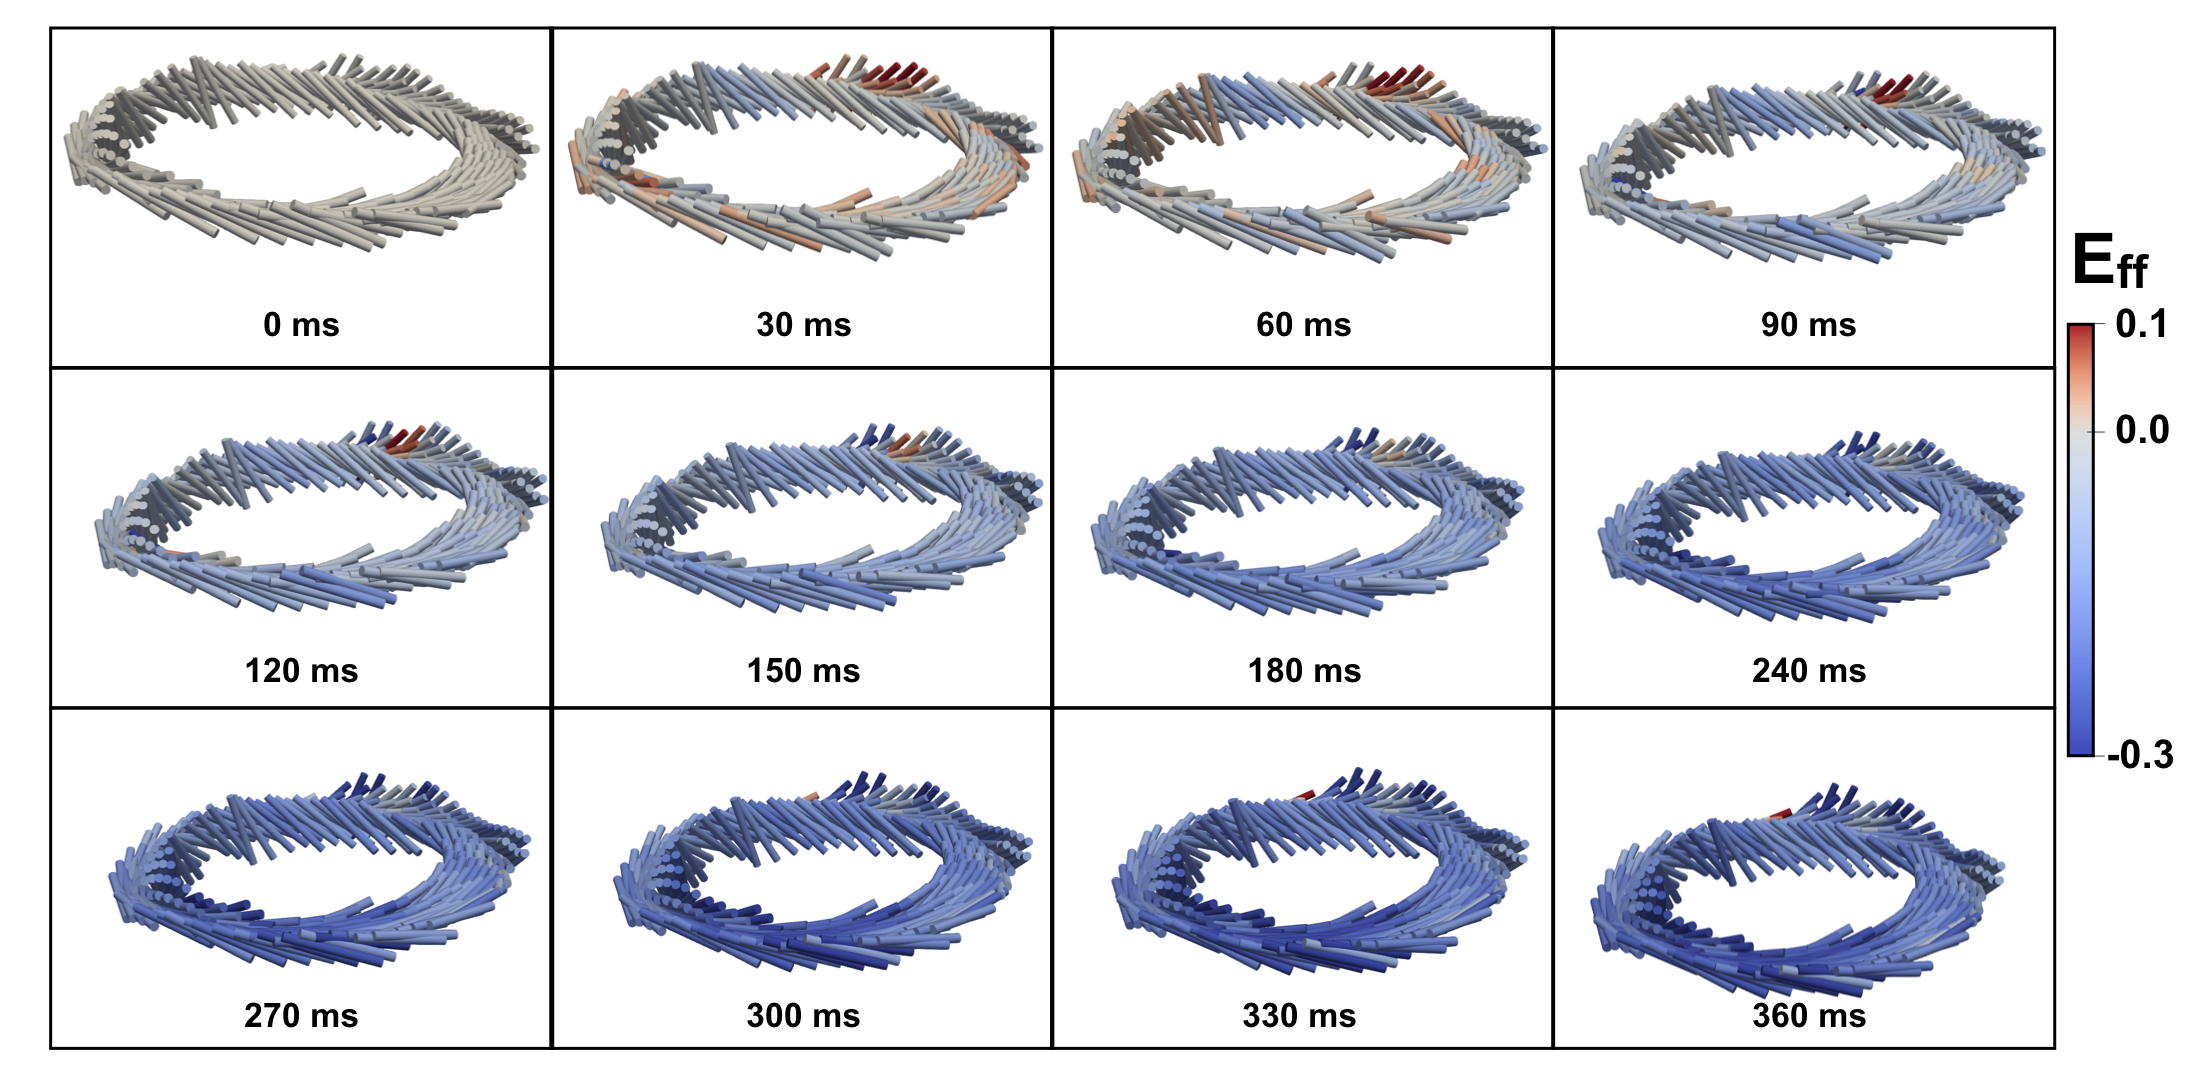
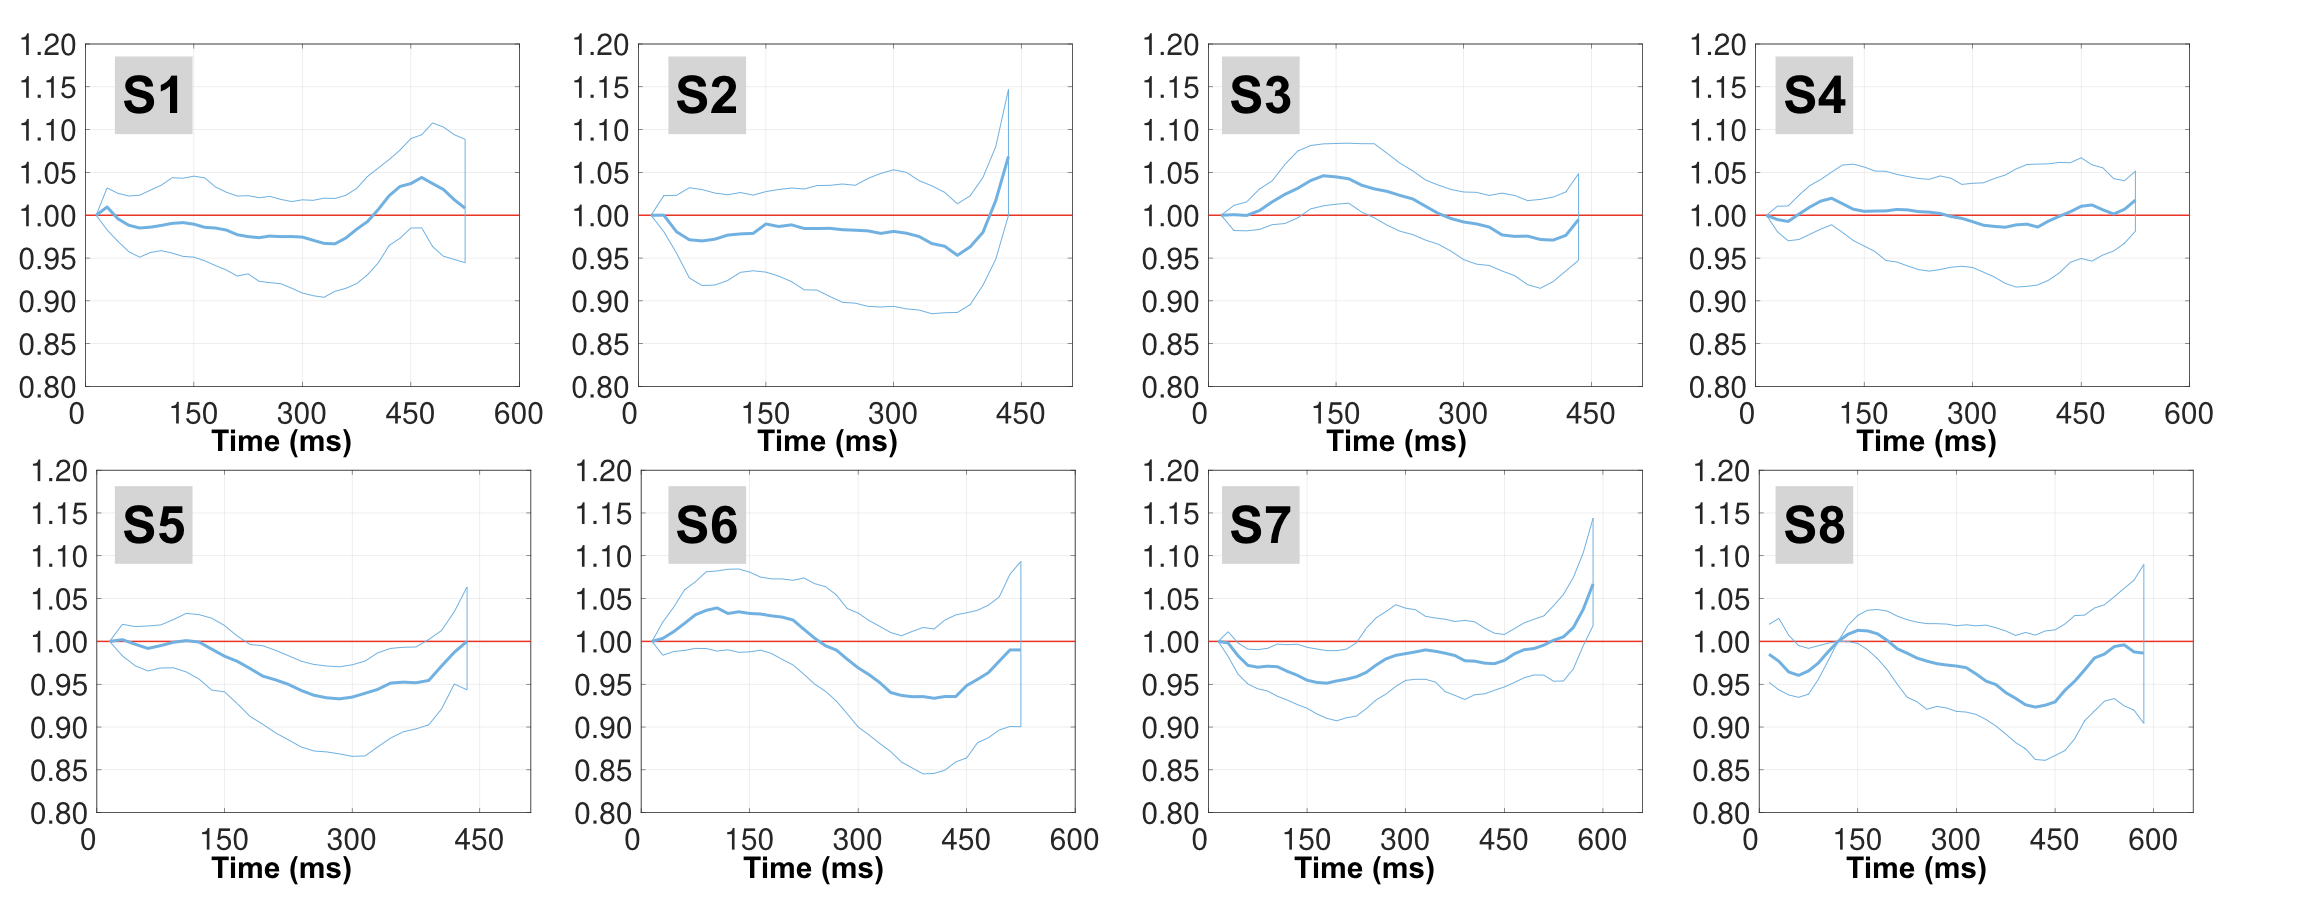
Fig. 2 shows Eff and cardiomyocyte aggregate orientation results for one subject from beginning to end systole. Median (95% range) tissue incompressibility measured from the DENSE displacement field at peak systole was 4.1% (1.4%, 7.5%) (Fig. 3).
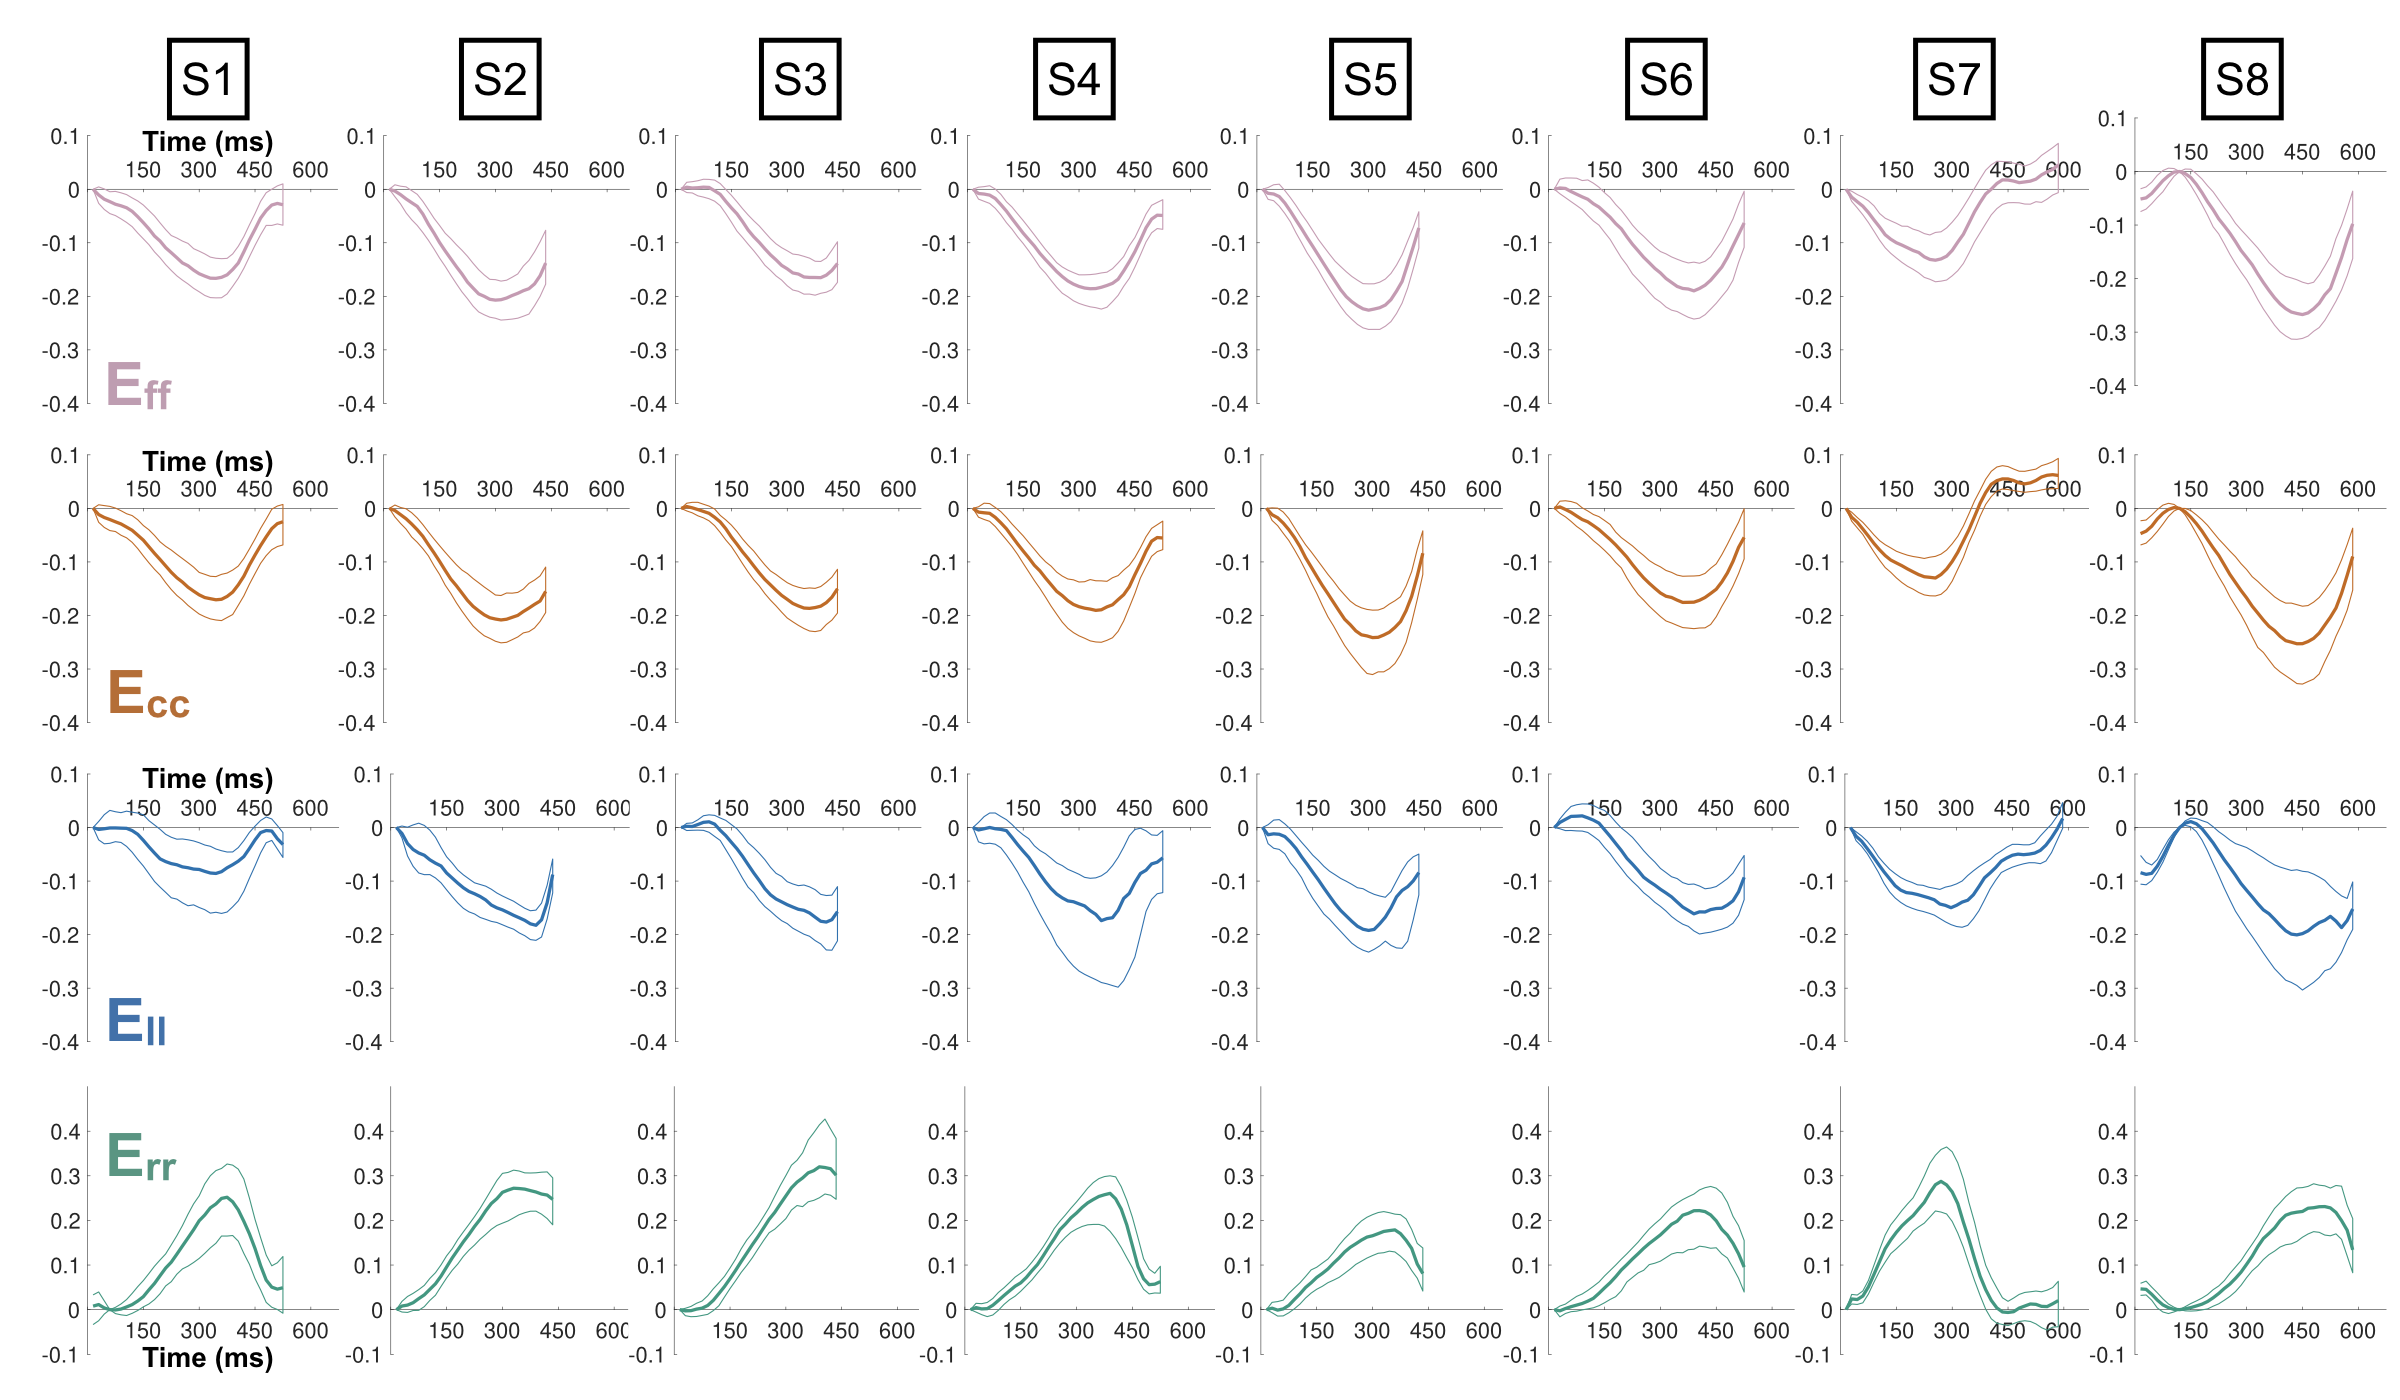
Ecc, Err, Ell and Eff results through time are shown in Fig. 4. Median (95% range) strains across all subjects were: Eff = -0.18 (-0.23, -0.13), Ecc = -0.18 (-0.24, -0.13), Err = 0.22 (0.16, 0.30), and Ell = -0.13 (-0.19, -0.08).
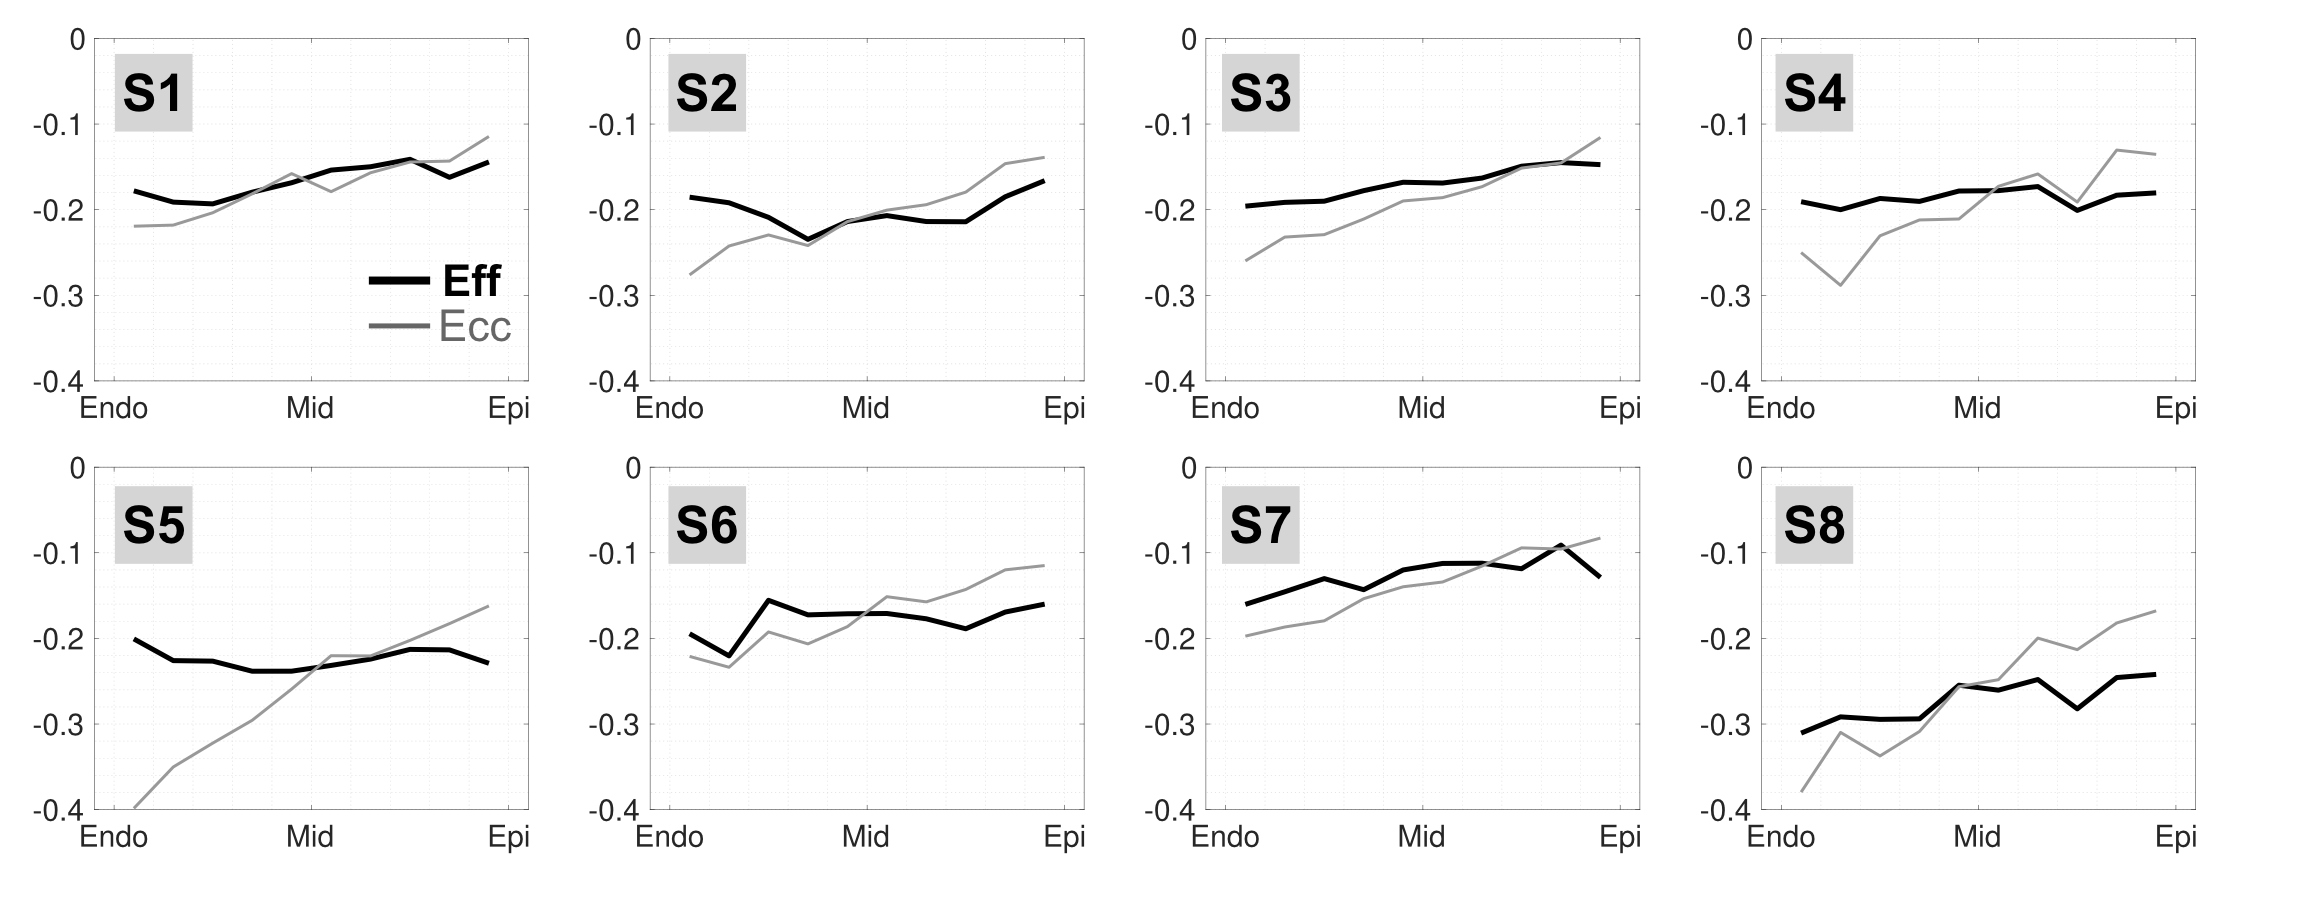
Mean±SD transmural gradients from endocardium to epicardium at peak systole were 0.03±0.04 for Eff, 0.14±0.06 for Ecc (Fig. 5), -0.13±0.18 for Err, and 0.01±0.05 for Ell.
Discussion
This study represents the first investigation of in vivo Eff using multi-slice DENSE MRI, which eliminates the need for incorporating mathematical assumptions in the computation of F.
Peak systolic tissue incompressibility showed good agreement with reported myocardium quasi-incompressibility11, suggesting that the displacement field captured using DENSE MRI had low volumetric distortion.
Eff showed significantly reduced through-wall variability when compared to Ecc and Err (p < 0.001). Eff showed similarly low transmural variability to Ell. The definition of the longitudinal axis, however, is somewhat arbitrary as it depends heavily on the orientation and position of the imaging location, whereas the “fiber” direction is directly measured from the tissue microstructure.
Conclusion
In this work, we demonstrate that Eff can be estimated entirely from in vivo MRI data and provides a spatially uniform, microstructurally-anchored characterization of LV function. The spatial uniformity and mechanistic significance of Eff make it a suitable candidate for the early detection of cardiac dysfunction.Acknowledgements
Funding support from NIH K25 HL135408, NIH R01 HL131975, and NIH R01 HL131823References
1 - Luk A, Ahn E, Soor GS, Butany J. Dilated cardiomyopathy: a review. Journal of clinical pathology. 2009 Mar 1;62(3):219-25.
2 - Olivotto I, Cecchi F, Poggesi C, Yacoub MH. Developmental origins of hypertrophic cardiomyopathy phenotypes: a unifying hypothesis. Nature reviews cardiology. 2009 Apr;6(4):317.
3 - Zhong X, Spottiswoode BS, Meyer CH, Kramer CM, Epstein FH. Imaging three‐dimensional myocardial mechanics using navigator‐gated volumetric spiral cine DENSE MRI. Magnetic resonance in medicine. 2010 Oct;64(4):1089-97.
4 - Aliotta E, Wu HH, Ennis DB. Convex optimized diffusion encoding (CODE) gradient waveforms for minimum echo time and bulk motion–compensated diffusion‐weighted MRI. Magnetic resonance in medicine. 2017 Feb;77(2):717-29.
5 - Stoeck CT, Von Deuster C, Genet M, Atkinson D, Kozerke S. Second order motion compensated spin-echo diffusion tensor imaging of the human heart. Journal of Cardiovascular Magnetic Resonance. 2015 Dec;17(1):P81.
6 - Perotti LE, Magrath P, Verzhbinsky IA, Aliotta E, Moulin K, Ennis DB. Microstructurally Anchored Cardiac Kinematics by Combining In Vivo DENSE MRI and cDTI. In International Conference on Functional Imaging and Modeling of the Heart 2017 Jun 11 (pp. 381-391). Springer, Cham.
7 – Magrath P, Perotti LE , Aliotta E, Verzhbinsky IA, Moulin K, Ennis DB. In Vivo Assessment of Cardiomyocyte Performance Using Combined Cardiac DENSE and cDTI. ISMRM 2018.
8 - Spottiswoode BS, Zhong X, Hess AT, Kramer CM,
Meintjes EM, Mayosi BM, Epstein FH. Tracking myocardial motion from cine DENSE
images using spatiotemporal phase unwrapping and temporal fitting. IEEE
transactions on medical imaging. 2007 Jan;26(1):15-30.
Code
available at: https://github.com/denseanalysis/denseanalysis
9 - Verzhbinsky IA, Magrath P, Aliotta E, Ennis DB, Perotti LE. Time resolved displacement-based registration of in vivo cDTI cardiomyocyte orientations. In Biomedical Imaging (ISBI 2018), 2018 IEEE 15th International Symposium on 2018 Apr 4 (pp. 474-478). IEEE.
10 - Arroyo M, Ortiz M. Local maximum‐entropy approximation schemes: a seamless bridge between finite elements and meshfree methods. International journal for numerical methods in engineering. 2006 Mar 26;65(13):2167-202.
11 - Yin FC, Chan CC, Judd RM. Compressibility of perfused passive myocardium. American Journal of Physiology-Heart and Circulatory Physiology. 1996 Nov 1;271(5):H1864-70.
Figures