2102
3D cardiac MR elastography can monitor therapy for heart failure with preserved ejection fraction: feasibility in a porcine model1Radiology, Mayo Clinic, Rochester, MN, United States, 2Cardiovascular Medicine, Mayo Clinic, Rochester, MN, United States, 3Biomedical Engineering and Physiology, Mayo Clinic, Rochester, MN, United States
Synopsis
Heart failure with preserved ejection fraction (HFpEF) is an increasingly common clinical syndrome with diagnostic challenges and no effective treatment which is characterized by increased cardiac filling pressures resulting in increased myocardial stiffness. The purpose of this study was to assess changes in myocardial stiffness after pericardiectomy in a pig model of HFpEF, and to demonstrate the feasibility of Cardiac MR Elastography (CMRE) as a noninvasive tool to monitor treatment in HFpEF. Results show a significant decrease in myocardial stiffness aster pericardiectomy implying the potential of CMRE for treatment design, planning and monitoring for HFpEF in humans
Introduction
Heart failure with preserved ejection fraction (HFpEF) is an increasingly common clinical syndrome with diagnostic challenges and no effective treatment (1). HFpEF is also characterized by increased cardiac filling pressures that cause dyspnea (2-5). Pericardiectomy can relieve external restraint on the myocardium which may decrease filling pressures in HFpEF. Cardiac MR elastography (CMRE) allows noninvasive in vivo measurement of the global effective myocardial stiffness, which is determined by filling pressures and the biomechanical properties of the myocardium (6-8). The purpose of this study was to assess changes in myocardial stiffness after pericardiectomy in a pig model of HFpEF and to demonstrate the feasibility of CMRE as a noninvasive tool to monitor treatment in HFpEF.Methods
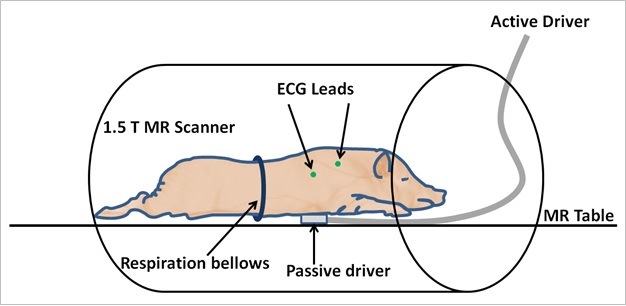
HFpEF was induced in four pigs by renal artery coiling and feeding with a high-fat diet (2% cholesterol, 15% lard) for 2 weeks. CMRE imaging was performed prior to pericardiectomy (designated as Day 0) as follows. A custom-made, passive, MRE driver was placed on the chest of each pig. The pigs were imaged in the prone position to maximize shear-wave penetration into the heart (Figure 1). Imaging was conducted on a 1.5-Tesla, whole-body, MR imager (Signa Excite HDxt; GE Healthcare) with a 4-channel coil using an ECG-gated, spin-echo echo-planar imaging (SE-EPI) MRE sequence and 140-Hz vibrations. Acquisitions were performed with 4 breath holds of approximately 25 seconds each, depending on the heart rate. Systolic acquisitions were performed with a minimum delay from the R-wave trigger. Diastolic, short-axis acquisitions were performed using time delays that corresponded to the first 3 phases of early diastole observed from a FIESTA cine scan. The following MRE acquisition parameters were used: 1 shot, NEX = 1; TR/TE = 4600/52 ms; FOV = 28.8 cm; 96x96 acquisition matrix; 11 3-mm-thick slices with 0-mm spacing located mid-ventricle; 2 motion-encoding gradient (MEG) pairs; x, y, and z motion-encoding directions; ASSET= 2, and 4 phase offsets spaced evenly over one vibration period. The pigs then underwent a closed-chest, percutaneous, pericardiectomy procedure. Follow-up CMRE imaging was performed after 7 and 30 days post-pericardiectomy to assess the effective myocardial stiffness. The left ventricle (LV) was segmented using a commercially available clinical software package (Cir 42, Cardiovascular Imaging, Calgary, Alberta). The MRE effective stiffness was obtained by applying the curl operator to the 3D displacement field and performing a 3D local-frequency estimation (LFE). The total effective myocardial stiffness was reported as the mean stiffness within the LV myocardium. A statistical software package (OriginPro 2016, OriginLab Corporation, Northampton, MA) was used for the statistical analysis and plotting. The Wilcoxon signed-rank test for significance was used in this study by considering a p-value of less than 0.05 as statistically significant.Results & Discussion
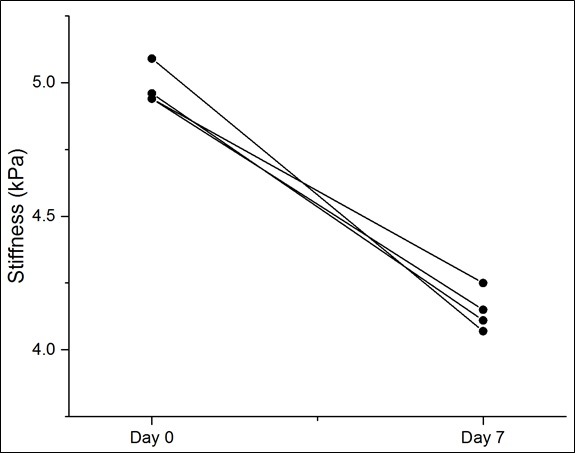
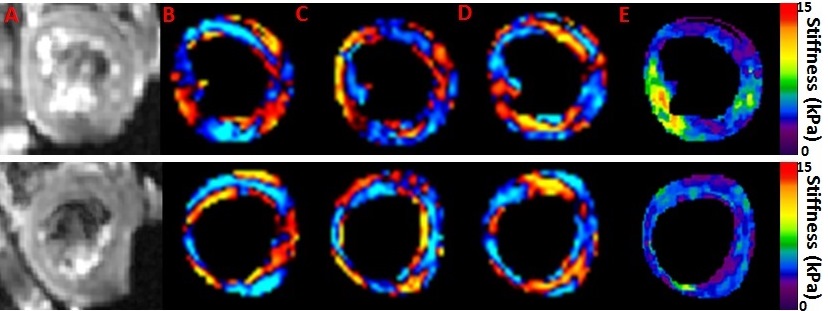
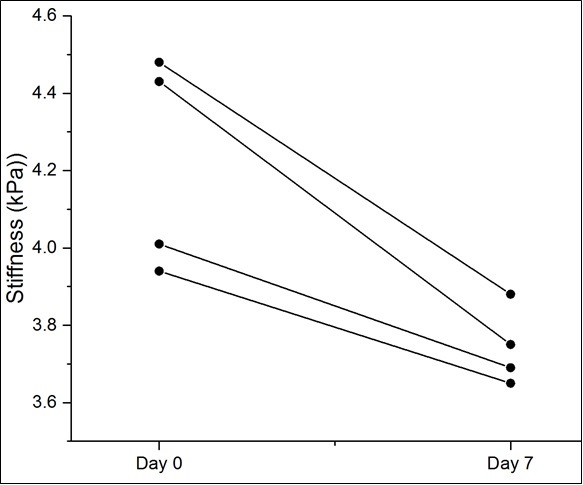
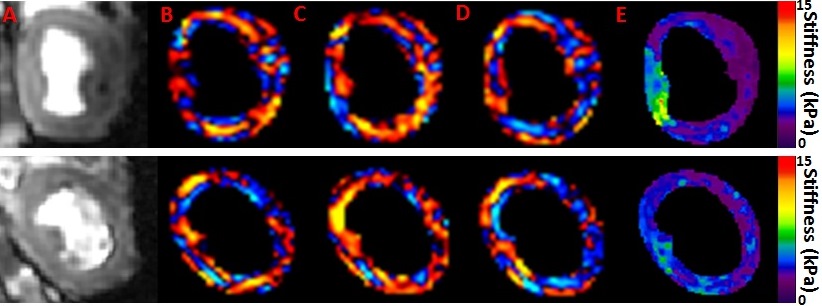
The mean value of the total myocardial effective stiffness during systole decreased from 4.98 kPa on Day 0 to 4.15 kPa on Day 7 post-pericardiectomy (p<0.05) (Figure 2) . Figure 3 shows MRE images during systole from a pig on Day 0 (pre-pericardiectomy) (top) and on Day 7 post-pericardiectomy (bottom). The mean stiffness during diastole decreased from 4.22 kPa on Day 0 to 3.74 kPa on Day 7 post-pericardiectomy (p<0.05) (Figure 4). Figure 5 shows MRE images during diastole from the same pig on Day 0 (pre-pericardiectomy) (top) and on Day 7 post-pericardiectomy (bottom). There were no significant changes in the stiffness between Day 7 and Day 30 in either systole or diastole. The results suggest that changes in total myocardial effective stiffness post-pericardiectomy can be tracked by MRE. Because the intrinsic myocardial properties would not be expected to change this rapidly, these data indicate that ~20% of the total myocardial effective stiffness is related to the restraining effects of the intact pericardium, which contribute to the elevation in filling pressures in HFpEF.Conclusions
This study is the first application of CMRE to monitor pericardiectomy treatment for HFpEF and shows that 3D, high-frequency, CMRE may be able to track the changes of the total myocardial effective stiffness post-pericardiectomy, which would be beneficial for treatment design, planning and monitoring for HFpEF in humans.Acknowledgements
This work was supported by National Institutes of Health (NIH) grants 5R01HL115144 and EB001981 and Mayo Clinic Department of Radiology internal funding.References
1. Zile MR, Baicu CF, Gaasch WH. Diastolic heart failure--abnormalities in active relaxation and passive stiffness of the left ventricle. The New England journal of medicine 2004;350(19):1953-1959.
2. Go, A.S., et al., Executive summary: heart disease and stroke statistics--2014 update: a report from the American Heart Association. Circulation, 2014. 129(3): p. 399-410.
3. Ferrari, R., et al., Heart failure with preserved ejection fraction: uncertainties and dilemmas. Eur J Heart Fail, 2015. 17(7): p. 665-71.
4. Braunwald, E., Heart failure. JACC Heart Fail, 2013. 1(1): p. 1-20.
5. Paulus, W.J., et al., How to diagnose diastolic heart failure: a consensus statement on the diagnosis of heart failure with normal left ventricular ejection fraction by the Heart Failure and Echocardiography Associations of the European Society of Cardiology. Eur Heart J, 2007.
6. Muthupillai, R., Lomas, D.J., Rossman, P.J. and Greenleaf, J.F., 1995. Magnetic resonance elastography by direct visualization of propagating acoustic strain waves. Science, 269(5232), p.1854.
7. Arunachalam SP, Rossman PJ, Arani A, Lake DS, Glaser KJ, Trzasko JD, Manduca A, McGee KP, Ehman RL, Araoz PA. Quantitative 3D magnetic resonance elastography: Comparison with dynamic mechanical analysis. Magnetic resonance in medicine : official journal of the Society of Magnetic Resonance in Medicine / Society of Magnetic Resonance in Medicine 2016.
8. Arani A, Glaser KL, Arunachalam SP, Rossman PJ, Lake DS, Trzasko JD, Manduca A, McGee KP, Ehman RL, Araoz PA. In vivo, high-frequency three-dimensional cardiac MR elastography: Feasibility in normal volunteers. Magnetic resonance in medicine : official journal of the Society of Magnetic Resonance in Medicine / Society of Magnetic Resonance in Medicine 2016.
Figures