2100
Quantitative Multi-contrast Vessel Wall Imaging in the Carotid Arteries: Preliminary Results on Reproducibility in Healthy Volunteers1Radiology, Medical Physics, Medical Center – University of Freiburg, Faculty of Medicine, University of Freiburg, Freiburg, Germany, 2Fraunhofer MEVIS, Bremen, Germany, 3Institute for Imaging Science and Computational Modelling in Cardiovascular Medicine, Charité - Universitaetsmedizin Berlin, Berlin, Germany, 4Neurology, Medical Center – University of Freiburg, Faculty of Medicine, University of Freiburg, Freiburg, Germany
Synopsis
Internal carotid artery stenosis is a major source of ischemic stroke. Assessment of plaque formation and longitudinal progression necessitates reproducibility of imaging and post-processing methods. In this study, preliminary results on the reproducibility of wall thickness measurements using 3D multi-contrast vessel wall imaging at two different time points in healthy volunteers are presented. Between the two exams, relative deviations of the vessel wall thickness were mostly below 10% and below 15% when comparing different sequences. In conclusion, reproducible assessment of the carotid arteries with multi-contrast vessel wall imaging is feasible.
Introduction
MRI has emerged as a powerful tool to assess characteristics and changes of the arterial vessel wall1 especially in the carotid arteries. Internal carotid artery (ICA) stenosis plays an important role in ischemic stroke with high-grade ICA stenosis constituting a major source of brain ischemia2. State-of-the-art MR protocols for vessel wall imaging (VWI) typically comprise time-of-flight (TOF) angiography and multi-contrast (T1, T2, proton density (PD)) sequences to determine the vessel wall thickness and identify vulnerable plaques1,3.
Although 2D multi-slice imaging with high in-plane resolution has been shown to provide optimal vessel wall delineation in vessels with little curvature1,4,5, carotid VWI is preferably done using 3D imaging to avoid overestimation of wall thickness in regions with rapid diameter changes1. However, segmentation of the vessel wall in 3D data can be a time-consuming process so that automated post-processing would be desirable.
Recently, a post-processing tool for automated quantitative assessment of the carotid vessel wall was introduced6. Assessment of plaque formation and longitudinal progression necessitates reproducibility of imaging and post-processing methods. Here, we present preliminary results on the reproducibility of wall thickness measurements via 3D multi-contrast VWI in the carotid arteries of healthy volunteers.
Methods
Eleven healthy volunteers (written informed consent, mean age: 36±9 yrs, 2 female) underwent two multi-contrast VWI exams including 3D TOF, T1-, T2-, and PD-weighted imaging on two different dates (time gap: 1 month). For T1-, T2- and PD-weighted imaging a variable-flip-angle 3D TSE sequence (Sampling Perfection with Application optimized Contrasts using different flip angle Evolution – SPACE) with fat saturation and dark-blood preparation (FSD7-preparation for T1- & PD-weighting, DANTE8-preparation for T2-weighting) was used. Imaging was done on a 3T whole-body scanner (Prisma Siemens Healthineers, Erlangen, Germany) with an 8-channel surface (NORAS MRI products GmbH, Hoechberg, Germany). An isotropic spatial resolution of 0.6 mm was used for all sequences. Other sequence parameters were as follows:
TOF: TR/TE = 23/3.8ms, a = 18°, BW = 185 Hz/Px, TA = 4:32 min
T1-weighted SPACE: TR/TE = 900/26 ms, BW = 405 Hz/Px, ETL = 36, TA = 7:32 min
T2-weigthed SPACE: TR/TE = 2000/159 ms, BW = 405 Hz/Px, ETL = 61, TA = 7:22 min
PD-weighted SPACE: TR/TE = 1900/26 ms, BW = 405 Hz/Px, ETL = 61, TA = 8:04 min
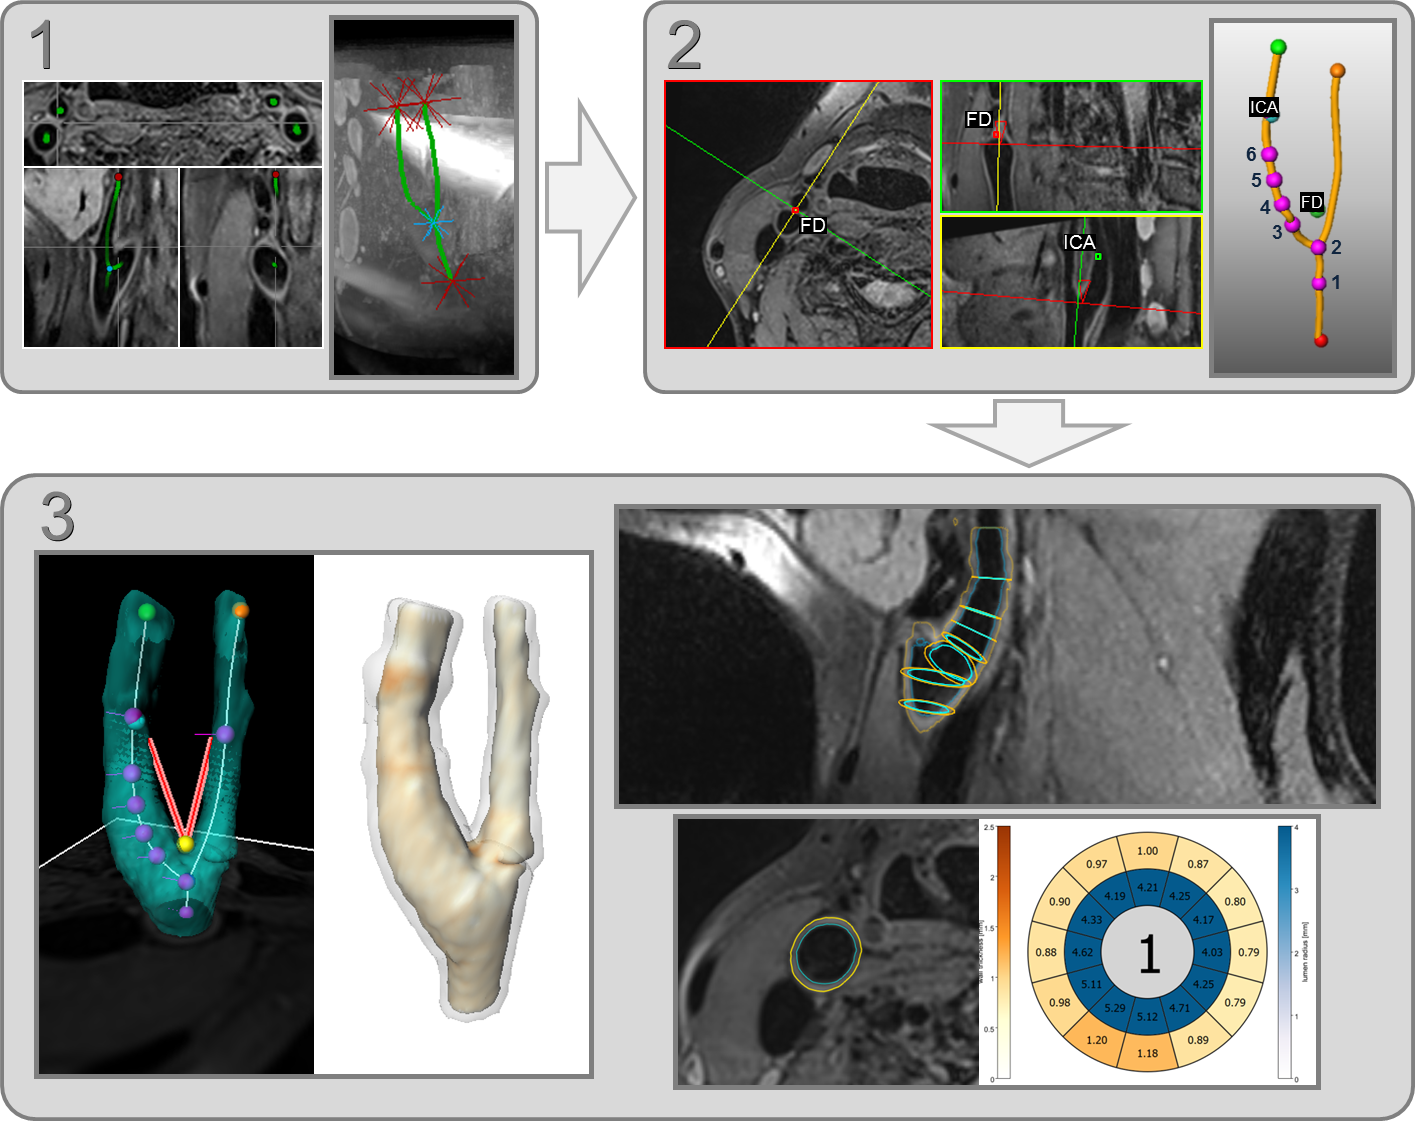
Post-processing of the VWI data was done with a non-commercial post-processing prototype6 comprising centerline computation after manual initialization and automatic 3D segmentation of the vessel’s inner lumen and outer wall (workflow illustrated in Fig. 1). Quantitative assessment of vessel lumen and wall thickness was done in six analysis planes (two/four planes located in the common/internal CA) which were positioned at fixed distances from the flow diverter and oriented according to the calculated centerline (Fig. 1). For the six analysis planes, the automatically generated segmentation could be retrospectively corrected to avoid segmentation errors because of artifacts or noise.
Results and Discussion
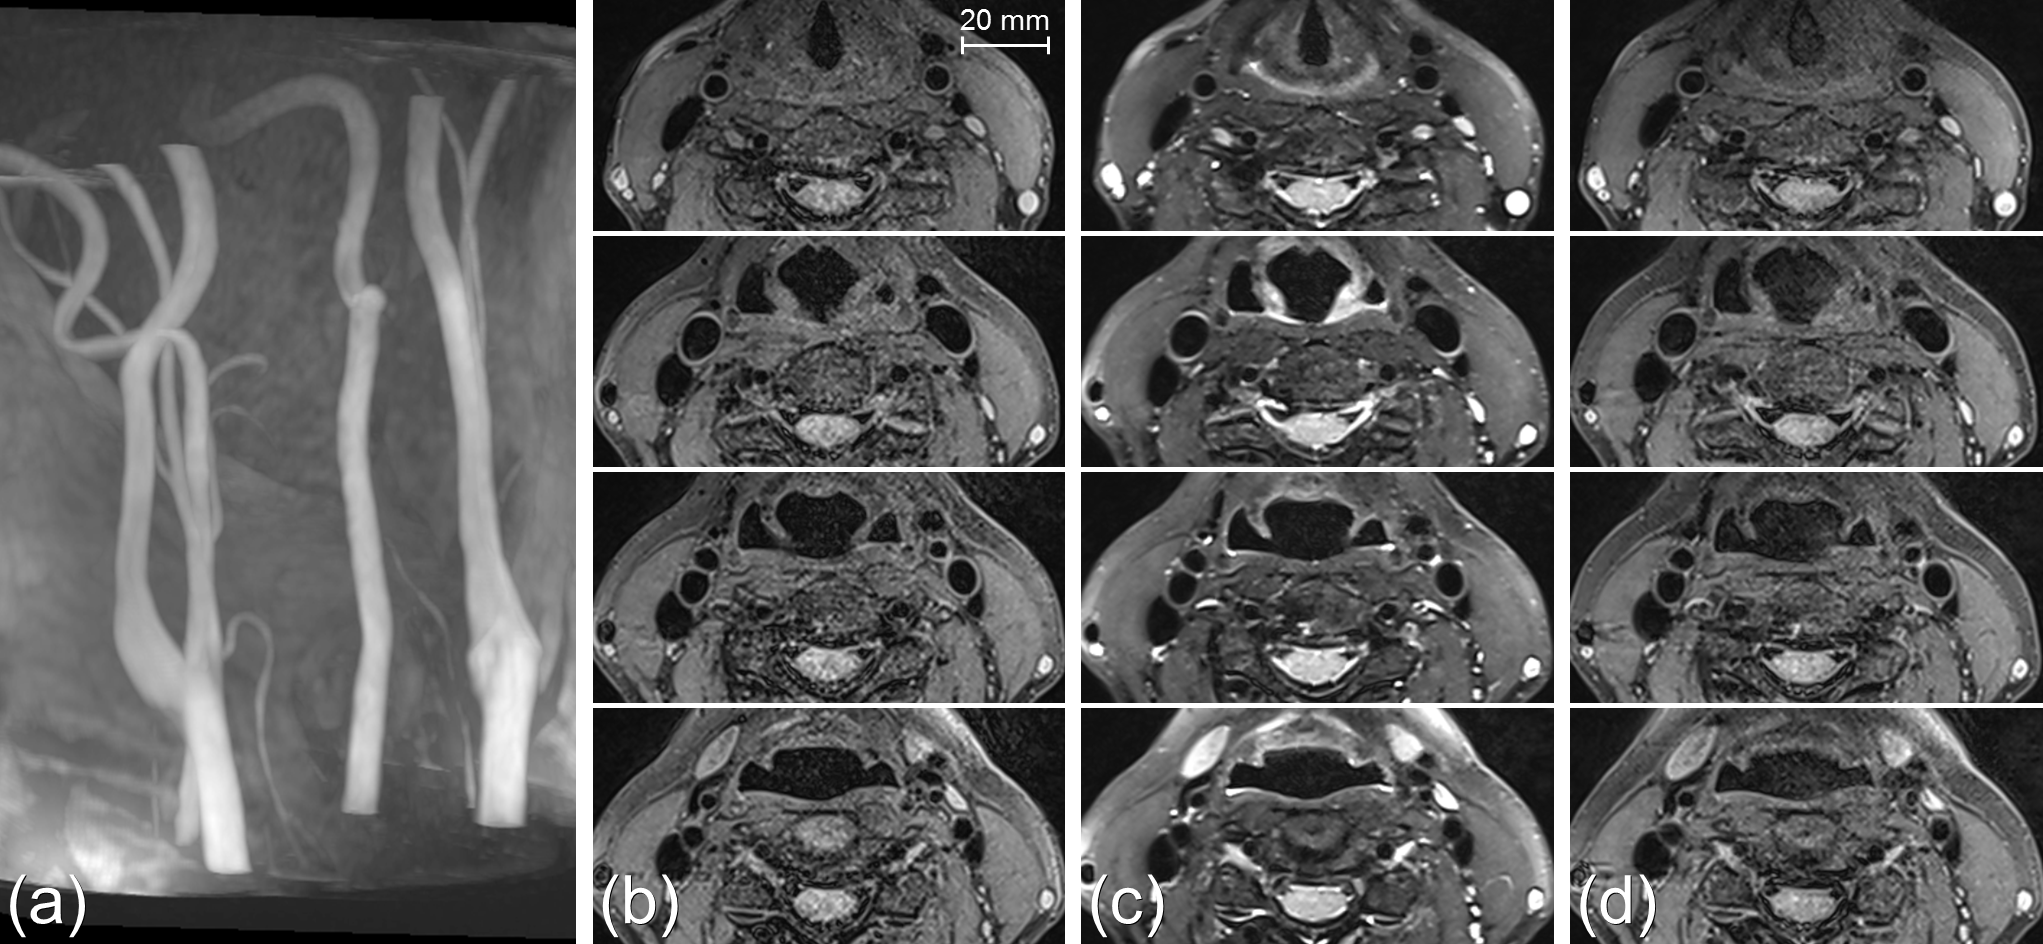
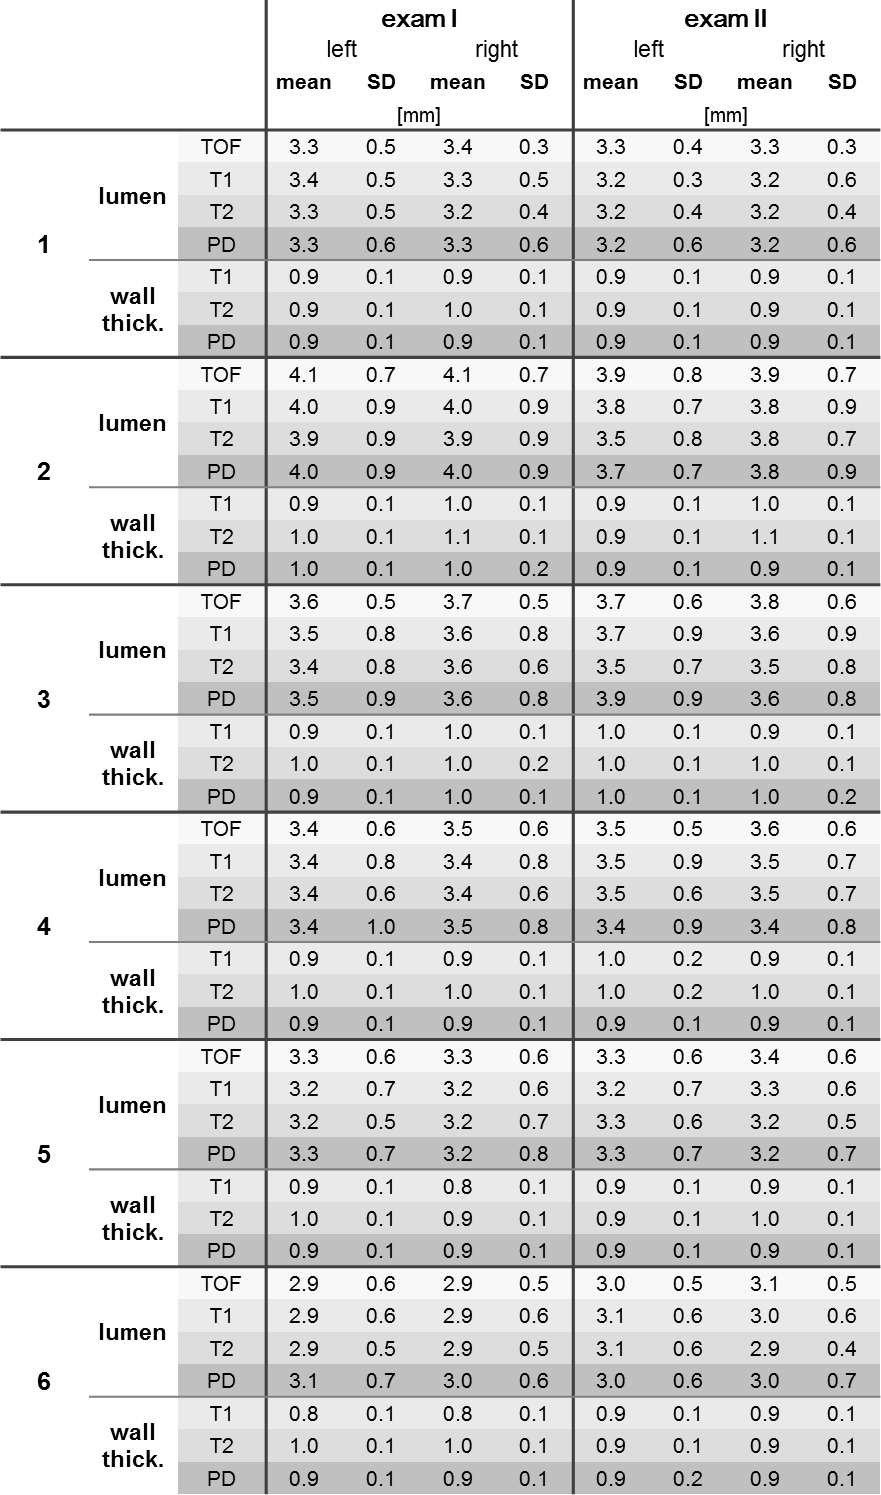
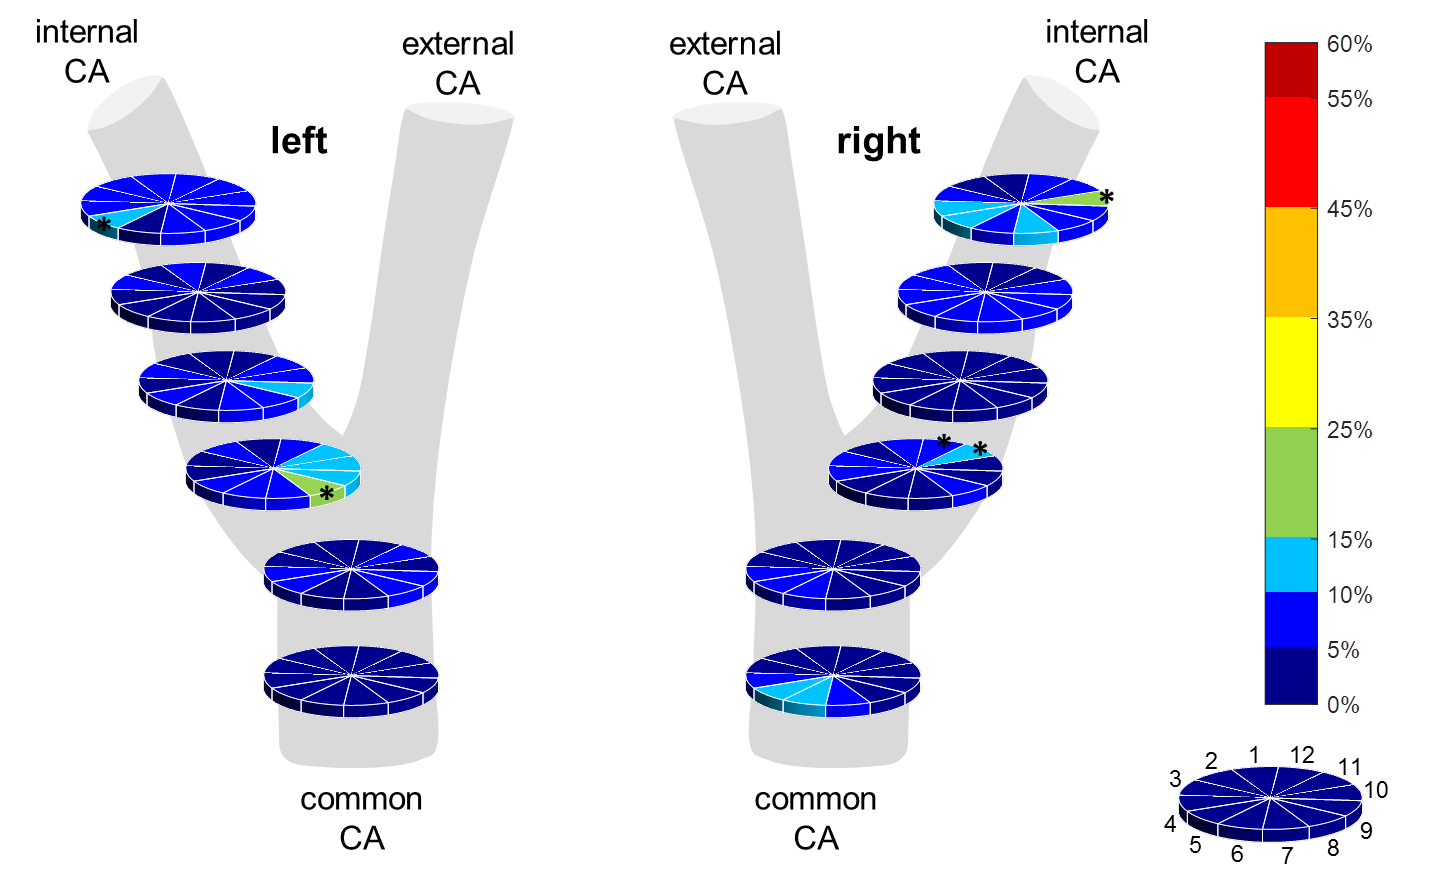
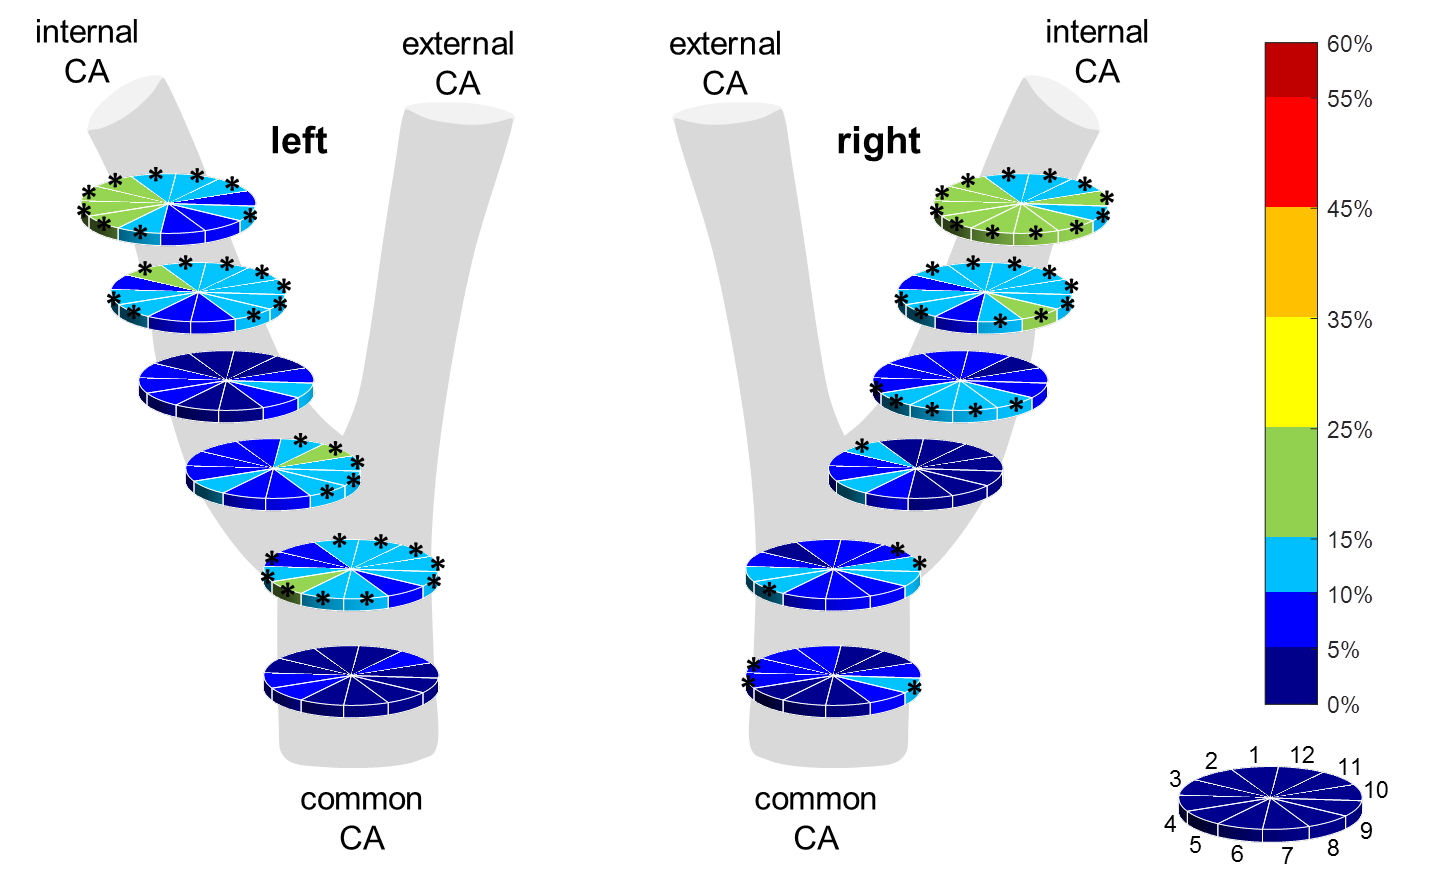
Representative VWI data for one volunteer is shown in Fig. 2. Table 1 summarizes mean values and standard deviations from the six analysis planes for vessel lumen radius and wall thickness with overall mean values of 3.4±0.7 mm and 0.9±0.1 mm respectively. Between the two exams, relative deviations were mostly <10%. Larger deviations up to 25% were seen in some segments of the planes in the proximity of the bifurcation. As an example, relative deviations of the wall thickness between the two T1-weighted measurements are presented in Fig. 3.
Comparison of wall thickness measurements between the three different sequences showed relative deviations mostly <15%. As an example, relative deviations in wall thickness between the T1- and T2-weighted protocols of exam 1 are illustrated in Fig. 4. In the retrospective correction stage, we noted that the orientations of some of the analysis planes were not always perpendicular to the local vessel track. For example with the T1-weighted protocol of exam 1, 4/5 (out of 11) misaligned orientations occurred for plane 2 of the left/right CA. Misaligned planes were mainly found close to the bifurcation where identification of the vessel’s centerline is challenging. This might also explain deviations in lumen and wall thickness seen in that region.
Although plane orientations were not always optimal which will be addressed in future implementations of the post-processing tool, our preliminary results show that quantitative assessment of the CAs via multi-contrast VWI can be done reproducibly. The observed values of wall thickness were larger as with high-resolution 2D imaging which could be explained by the absence of ECG-triggering. Further studies on the usability and applicability of the proposed framework in patients with carotid plaques are underway.
Acknowledgements
Grant support by the Deutsche Forschungsgemeinschaft (DFG) under grant numbers DFG HA 5399/5-1, HE7312/4-1, HE 1875/29-1 is greatly acknowledged.References
[1] Coolen BF, Calcagno C, van Ooij P, Fayad ZA, Strijkers GJ, Nederveen AJ. Vessel wall characterization using quantitative MRI: what's in a number? MAGMA. 2018 Feb;31(1):201-222.
[2] Petty GW, Brown RD Jr, Whisnant JP, Sicks JD, O'Fallon WM, Wiebers DO. Ischemic stroke subtypes: a population-based study of incidence and risk factors. Stroke. 1999 Dec;30(12):2513-6.
[3] Saam T, Hatsukami TS, Takaya N, Chu B, Underhill H, Kerwin WS, Cai J, Ferguson MS, Yuan C. The vulnerable, or high-risk, atherosclerotic plaque: noninvasive MR imaging for characterization and assessment. Radiology. 2007 Jul;244(1):64-77.
[4] Duivenvoorden R, de Groot E, Afzali H, Vanbavel ET, de Boer OJ, Laméris JS, Fayad ZA, Stroes ES, Kastelein JJ, Nederveen AJ. Comparison of in vivo carotid 3.0-T magnetic resonance to B-mode ultrasound imaging and histology in a porcine model. JACC Cardiovasc Imaging. 2009 Jun; 2(6):744-50.
[5] Duivenvoorden R, de Groot E, Elsen BM, Laméris JS, van der Geest RJ, Stroes ES, Kastelein JJ, Nederveen AJ. In vivo quantification of carotid artery wall dimensions: 3.0-Tesla MRI versus B-mode ultrasound imaging. Circ Cardiovasc Imaging. 2009 May; 2(3):235-42.
[6] Kaufhold L, Krafft A, Strecker C, Huellebrand M, Ludwig U, Harloff A, Hennemuth A. Automatic carotid vessel wall assessment based on a combined analysis of TOF-MR angiography and MSD T2-weighted MRI sequences. Annual Meeting ISMRM 2018, Paris, France, abstract: 1885.
[7] Fan Z, Zhang Z, Chung YC, Weale P, Zuehlsdorff S, Carr J, Li D. Carotid arterial wall MRI at 3T using 3D variable-flip-angle turbo spin-echo (TSE) with flow-sensitive dephasing (FSD). J Magn Reson Imaging. 2010 Mar;31(3):645-54.
[8] Li L, Miller KL, Jezzard P. DANTE-prepared pulse trains: a novel approach to motion-sensitized and motion-suppressed quantitative magnetic resonance imaging. Magn Reson Med. 2012 Nov;68(5):1423-38.
Figures