2094
Background tissue suppression for subtractive NCE-MRA techniques based on robust regression using the deviation angle1Department of Radiology, University of Cambridge, Cambridge, United Kingdom, 2Department of Radiology, Addenbrooke’s Hospital, Cambridge, United Kingdom
Synopsis
Intensity differences of static tissues between bright- and dark-blood images commonly exist in subtractive non-contrast-enhanced MRA techniques, resulting in residual background signal in the subtracted images. Some linear regression models can correct the intensity difference but are sensitive to the large number of blood pixels in thoracic MRA. A robust regression model is developed in this study and is demonstrated to have an effective performance in background suppression for different subtractive NCE-MRA techniques.
Introduction
Subtractive Non-Contrast-Enhanced MR Angiography (NCE-MRA) techniques, such as Flow-Sensitive Dephasing (FSD)1 and Fresh Blood Imaging (FBI)2, display vasculature by subtracting dark-blood images (DBIs) from bright-blood images (BBIs). Our previous study3 has reported that intensity differences of some static tissues exist between the BBIs and DBIs, resulting in residual background signal on the subtracted images. An optimised subtraction approach based on principal component analysis (PCA) was proposed to acquire the regression coefficient of background tissue and correct the intensity difference.
However, the PCA model is sensitive to blood signal and has low robustness when large areas of blood appear, such as in thoracic MRA. This study proposes an optimised robust regression model, which uses iteratively reweighted least squares based on the deviation angle.
Method
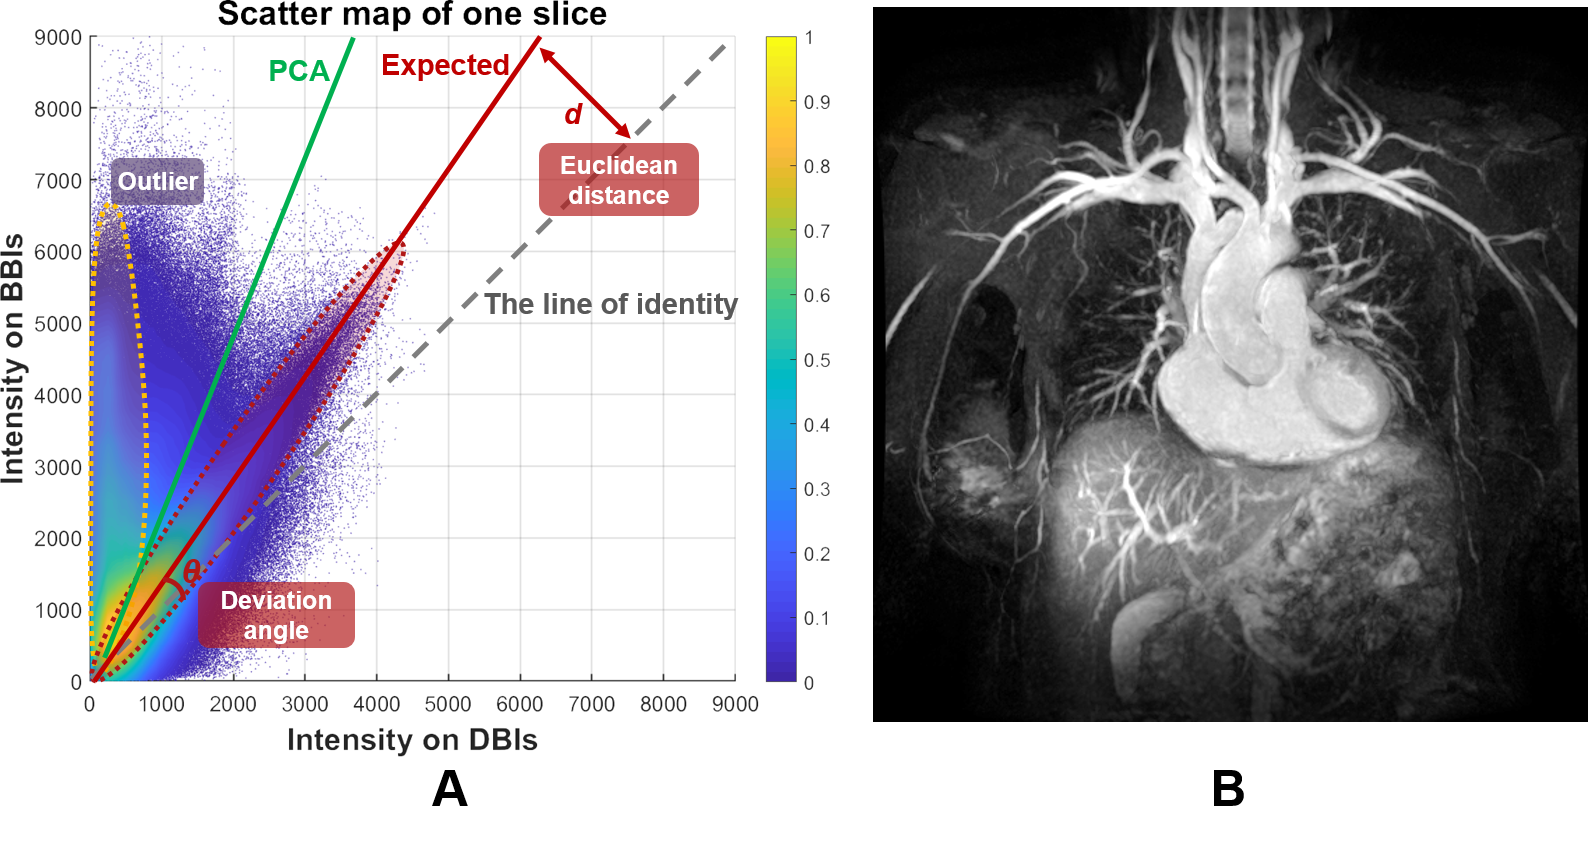
Fig. 1 shows the scatter map of the intensities of each pixel on DBIs and BBIs and the corresponding maximum intensity projection (MIP) of thoracic FSD-MRA images. It can be observed that there is a distance (d) between the distribution of background tissue and the line of identity (y=x). Therefore, a regression line (red solid line) for background pixels (red dashed line) is expected to be obtained to correct the intensity difference and remove the residual background signal on subtracted images.
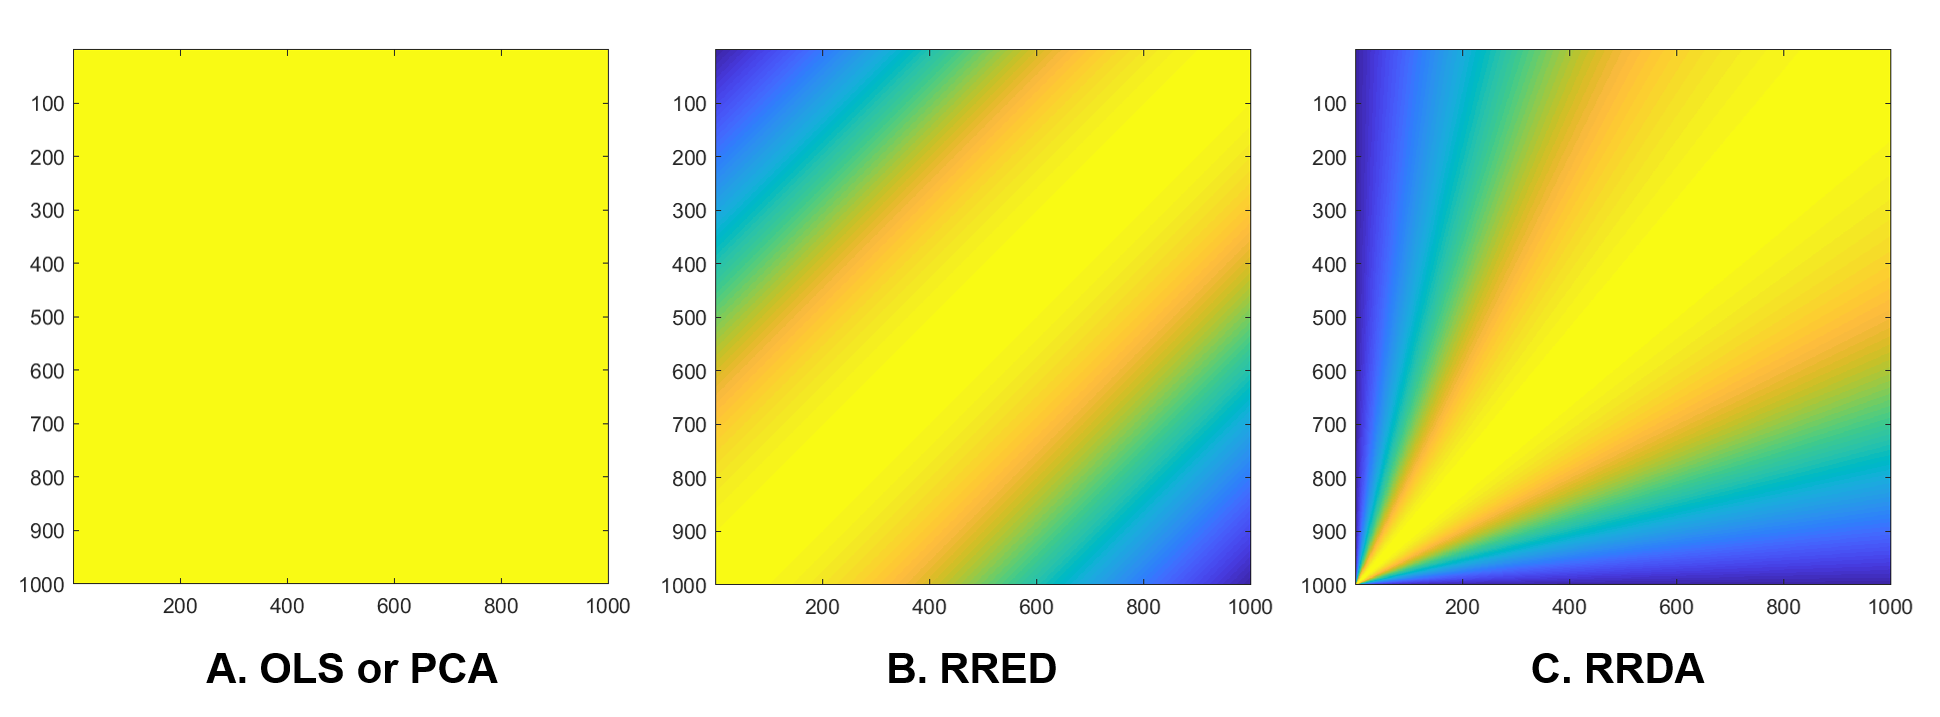
However, because of the presence of the heart (Fig. 1B), many points locating in the region with high intensity on BBIs and low intensity on DBIs (yellow dashed line). These points, which are called “outliers”, have large distances to the model prediction and thus would be given large weights in the models like PCA or ordinary least-squares (OLS). Therefore, the outliers would easily drag the regression line out and generate an overlarge slope, leading to the loss of blood signal.
In this study, a robust regression model using iteratively reweighted least squares4 is employed, which gives the points farther from the model prediction lower weights and recomputes weights and model coefficients iteratively. In particular, instead of using Euclidean distance (d), the deviation angle (θ) is used in the weighting function. The model thus has a fan-shaped weighting map (Fig. 2C), giving the points with larger intensity larger weights. The proposed regression model can be expressed as:
$$minimize\sum_{i=1}^{n}e^{-(\frac{\Theta _{i}}{s})^{2}},$$
where $$s= median\left | \Theta _{i}-median\left ( \Theta _{i} \right ) \right |/0.6745$$
The optimised subtraction approach was tested on multiple datasets including ten coronal femoral Fresh Blood Imaging (FBI)-MRA datasets from five healthy volunteers, 26 coronal thoracic Flow-Sensitive Dephasing (FSD)-MRA5 datasets (DANTE-bSSFP) from 26 healthy volunteers and ten coronal iliac FSD-MRV datasets (iMSDE-bSSFP) from seven healthy volunteers. All the images were acquired using a 1.5 T MRI system (GE Healthcare, Waukesha, WI). Intensity ratios of tissue to artery/vein were calculated for the proposed method and the direct subtraction method. Signal was measured from ROIs drawn in representative locations in the target regions on the MIP. The quantitative results were compared over different subjects using a paired, two-sided Student t-test.
Results and Discussion
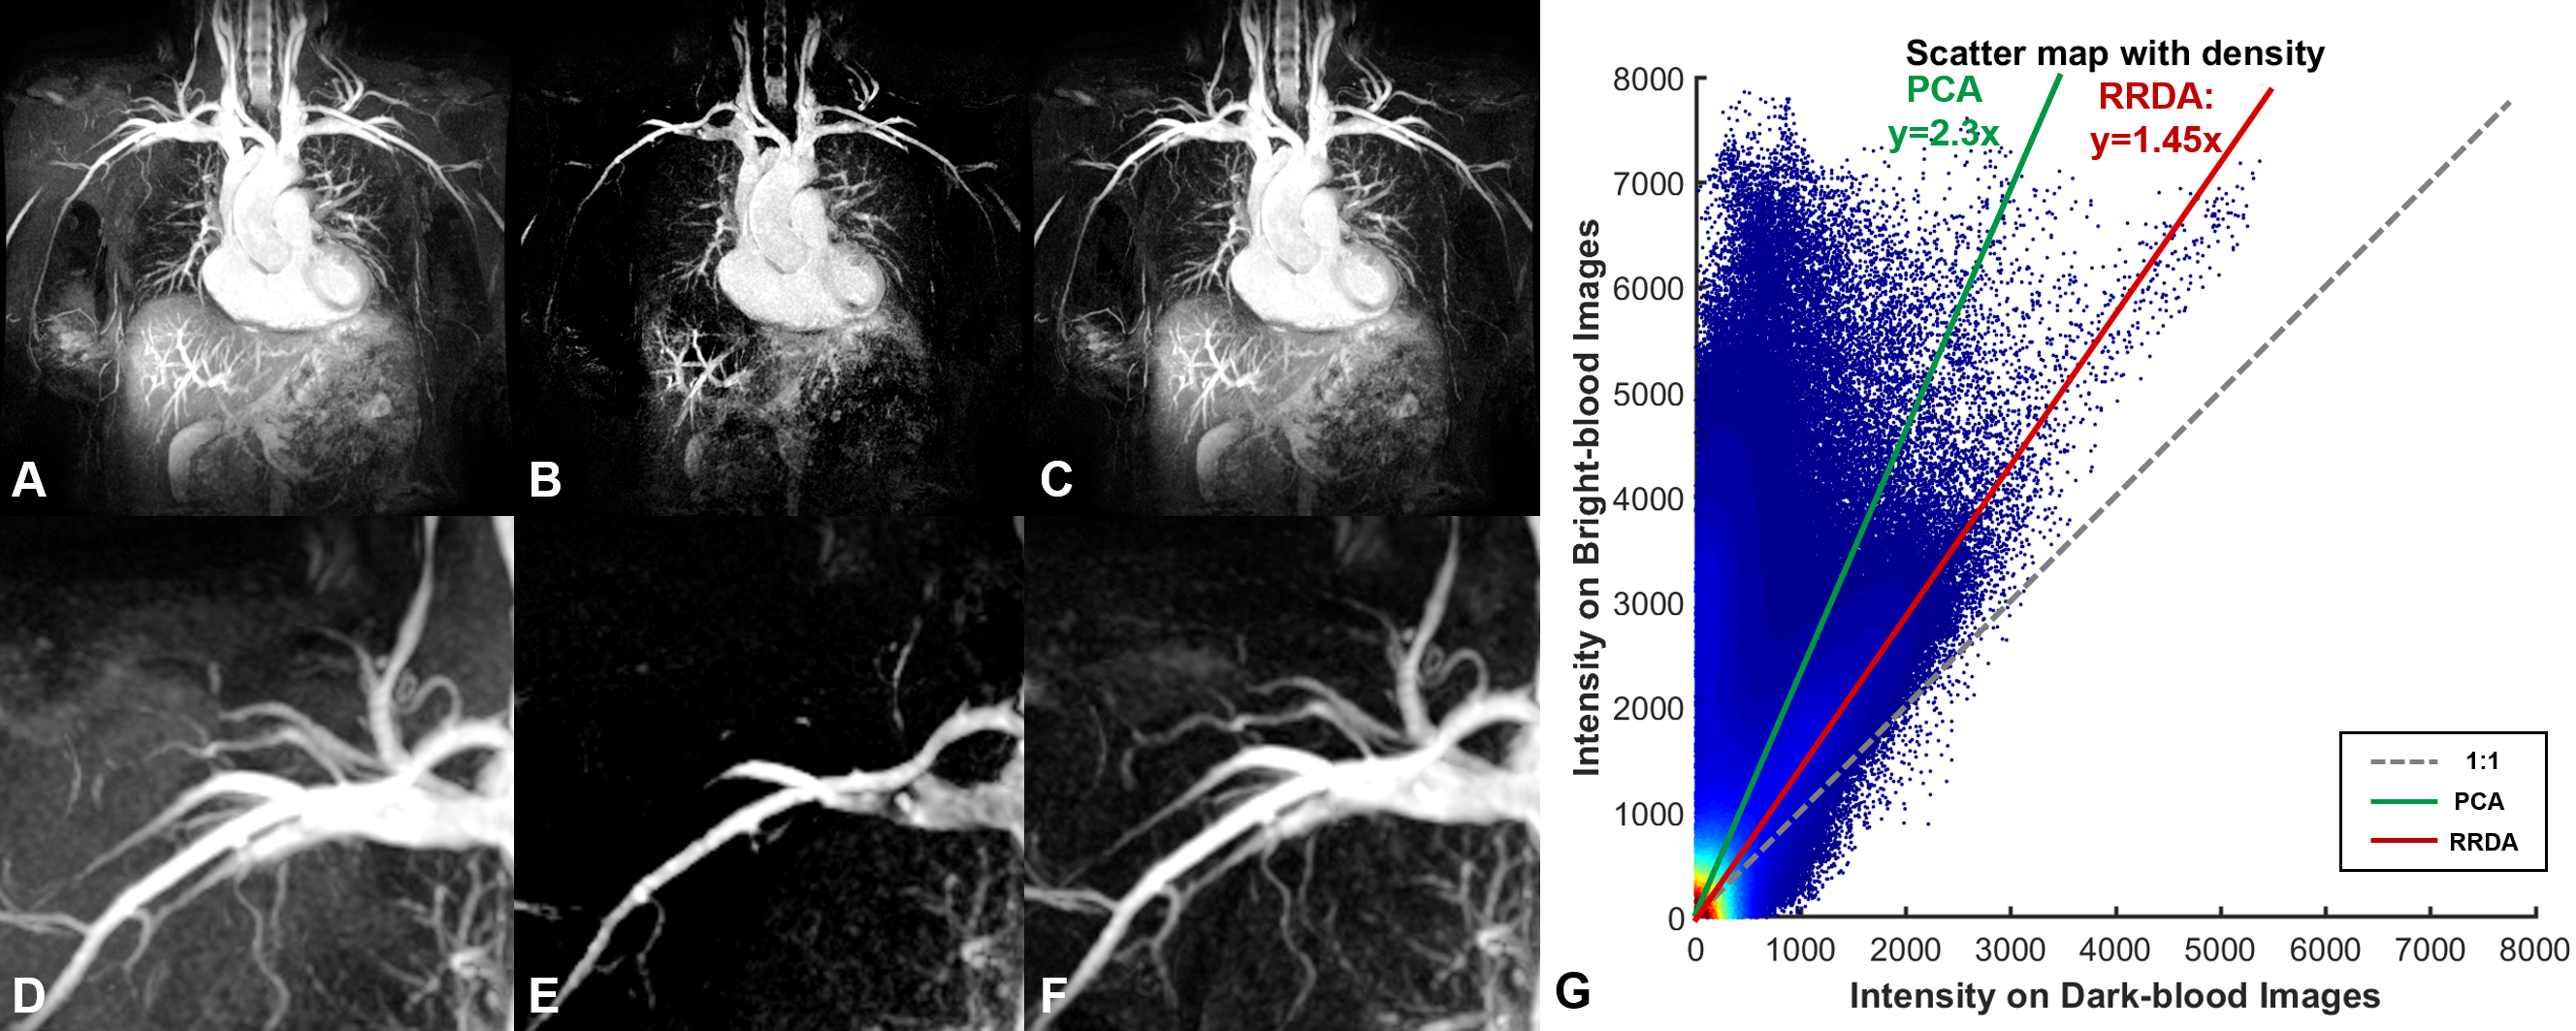
Figure 3 compares the performance of the robust regression model using the deviation angle (RRDA) with the model based on PCA in thoracic FSD-MRA. PCA (green solid line) generated an overlarge regression coefficient, which led to signal loss of small vessels (B and E). In contrast, RRDA is more resistant to outliers. It obtained the correct regression line (red solid line) and thus suppressed residual muscle signal while preserved the blood signal (C and F).
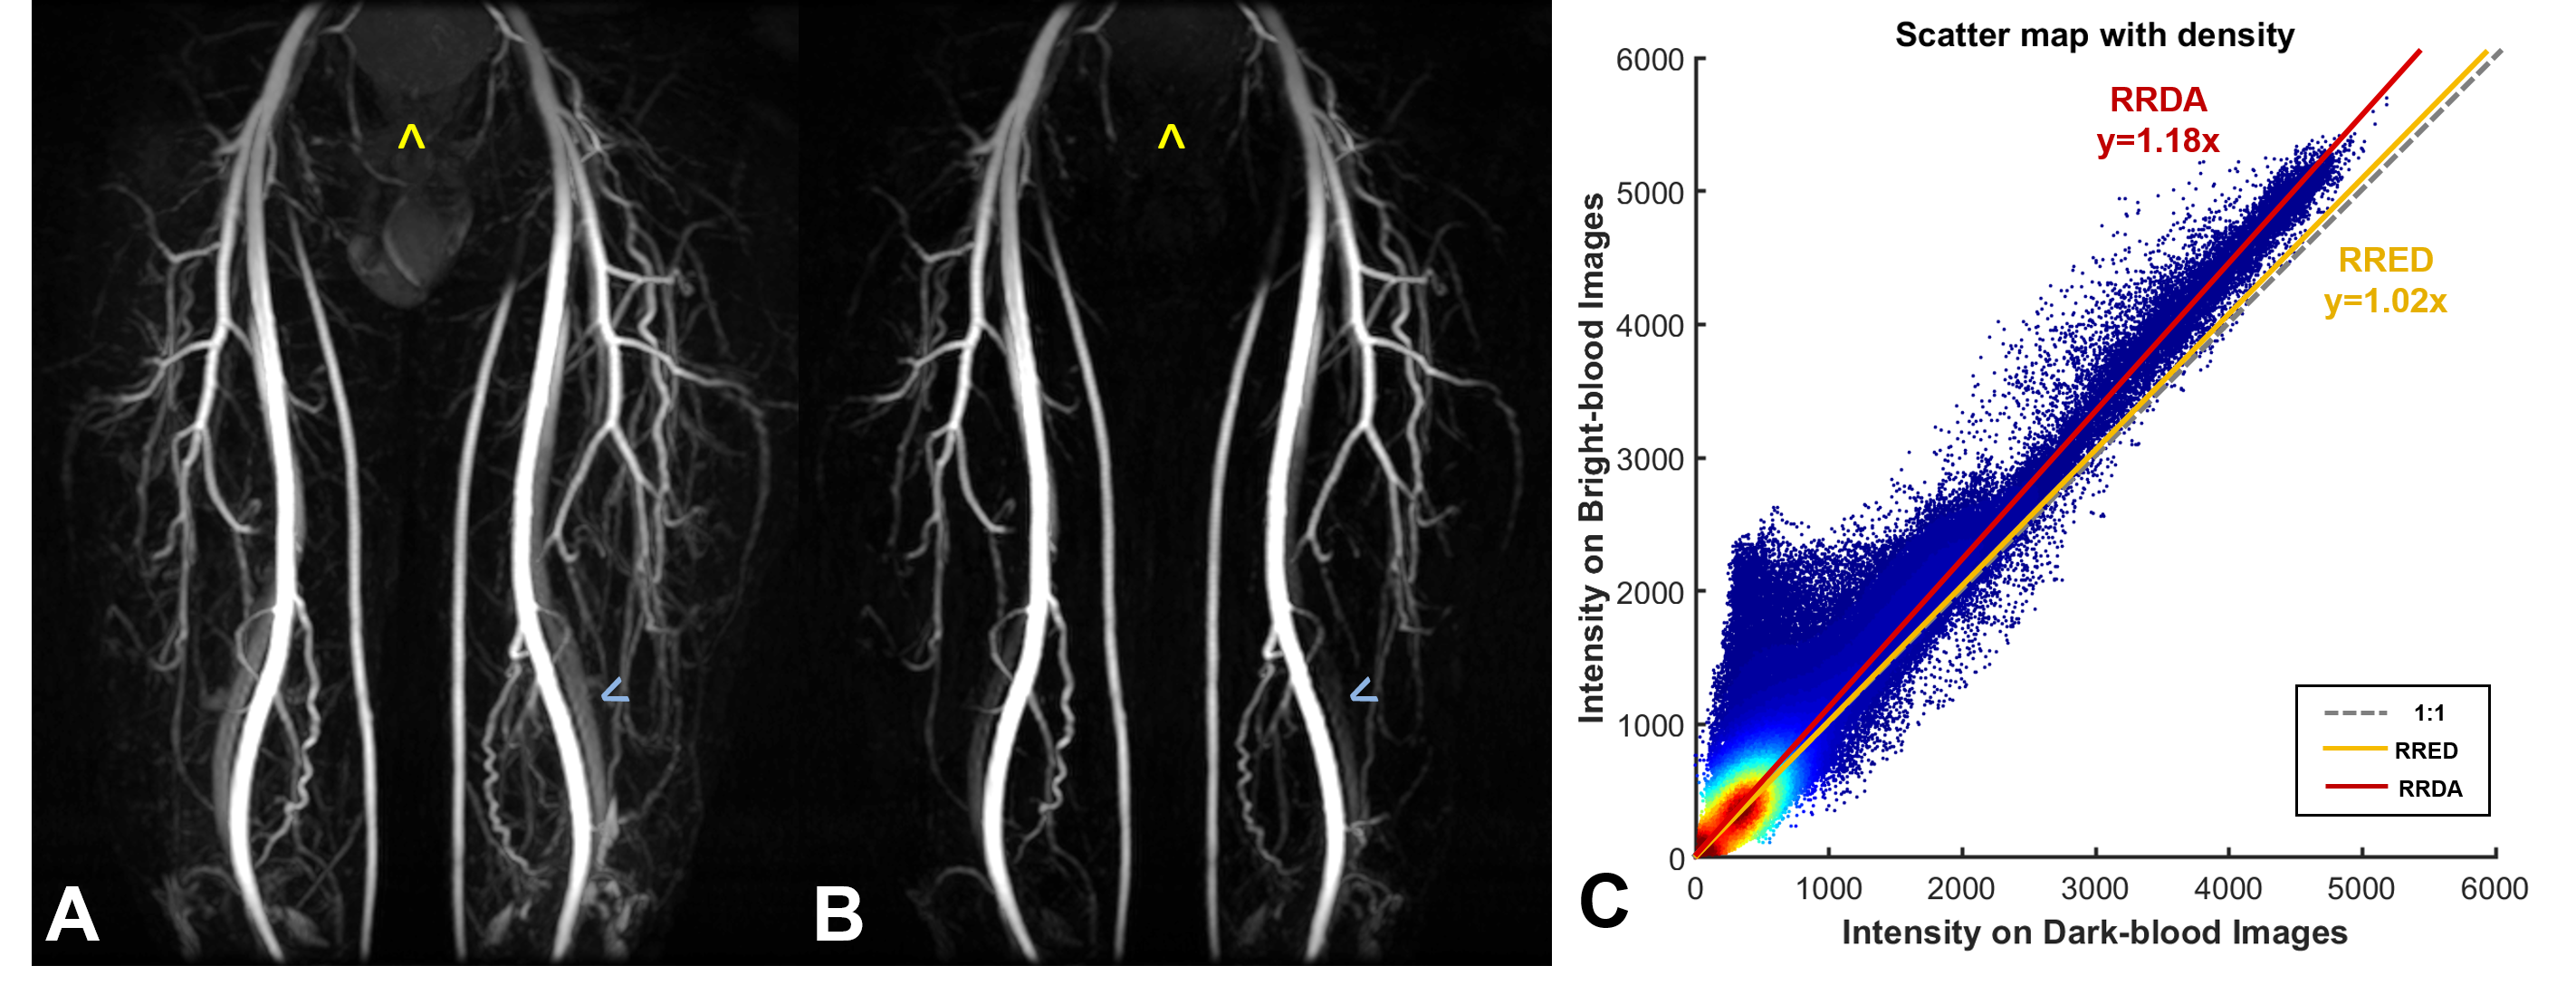
Figure 4 compares the performance of RRDA with the robust regression model using Euclidean distance (RRED) in femoral FBI-MRA. The regression in RRED was dominated by the muscle signal, resulting in a minor regression coefficient (yellow line) and images (not shown in this figure) almost same as the direct subtraction method (A). RRDA is less sensitive to the muscle pixels with a large number (red solid line). The background tissues such as the bladder (yellow arrows) and veins (blue arrows) were suppressed (B).
Comparing RRDA to conventional direct subtraction, the vein, muscle and bladder to artery ratios in the femoral FBI-MRA reduced to 34.2%, 46.1% and 30.2% respectively; the artery, muscle and bladder to vein intensity ratios in the iliac FSD-MRV reduced to 90.4%, 63.1% and 68.9% respectively; the muscle and liver to artery intensity ratios in the thoracic FSD-MRA reduced to 62.1% and 83.7% respectively.
Conclusion
The proposed RRDA approach can correct the intensity difference between background tissues in BBIs and DBIs and thus improve the background suppression. Compared with previous methods, RRDA is less sensitive to large numbers of blood pixels and muscle pixels, and thus achieved robust performance over different NCE-MRA techniques.Acknowledgements
The authors acknowledge the support of the Addenbrooke’s Charitable Trust and the NIHR Cambridge Biomedical Research Centre. Hao Li acknowledges the China Scholarship Council and Cambridge Trust for fellowship support.References
1. Priest AN, Graves MJ, Lomas DJ: Non-contrast-enhanced vascular magnetic resonance imaging using flow-dependent preparation with subtraction. Magn Reson Med 2012; 67:628–637.
2. Miyazaki M, Sugiura S, Tateishi F, Wada H, Kassai Y, Abe H: Non-contrast-enhanced MR angiography using 3D ECG-synchronized half-Fourier fast spin echo. J Magn Reson Imaging 2000; 12:776–783.
3. Li H, Wang S, Priest AN, Graves, MJ, Lomas DJ. An optimised subtraction approach for subtractive NCE-MRA techniques based on principal component analysis, ISMRM. 2018: 922.
4. Holland PW, Welsch RE. Robust regression using iteratively reweighted least-squares. Communications in Statistics - Theory and Methods, 6:9, 813-827.
5. Priest AN, Mortensen KH, Lomas DJ: Comparison of DANTE- and iMSDE-based methods for subtractive NCE-MRA of the central thoracic vein. ISMRM. 2015: 2662.
Figures